Category: <span>Artificial Intelligence</span>

Amazon Chime SDK Call Analytics: Real-Time Voice Tone Analysis and Speaker Search

Today, I am pleased to announce the availability of Amazon Chime SDK call analytics, a new set of capabilities that helps make it easier and cost effective to record and generate insights on real-time audio calls: transcription, voice tone analysis, and speaker search. We’ve also improved the Amazon Chime SDK section of the AWS Management Console to let you integrate machine learning (ML)-based services, such as these new call analytics capabilities or Amazon Transcribe into your audio applications in just a few steps.

Voice Analytics: Voice Tone Analysis and Speaker Search
Voice analytics delivers real-time insights into audio conversations. It helps detect and classify participants expressing a positive, neutral, or negative tone. Typically, enterprises working in regulated industries have obligations to record or want to analyze conversations between employees and their business partners, customers, or suppliers.

Voice tone analysis uses ML to extract sentiment from a speech signal based on a joint analysis of lexical and linguistic information as well as acoustic and tonal information. Voice tone analysis for live calls are delivered in the data lake of your choice, on top of which you can create your own dashboards to visualize the data.

Let’s take an example from the finance industry. Trading room supervisors are sometimes required to record all the trading conversations occurring on the floor. Voice tone analysis helps them meet their regulatory requirements. They can also deliver these insights to the traders to help to improve their productivity. But finance is not the only industry that needs to record and analyze calls. We have received similar requests from customers in Business Process Outsourcing (BPO), public sector, healthcare, telecom, and insurance industries.

Alongside with voice tone analysis, your applications can now benefit from speaker search to help match speakers to an existing database. It only requires a short sample to recognize a speaker based on their voice stored in a database of known voices. Speaker search helps your applications expedite caller lookup and enrich call records and transcripts with identity attribution. Speaker search delivers a suggested unique internal identifier for the speaker and a confidence score. The decision to match current the speaker with a known speaker from your organization is up to your application. Some of our customers plan to use speaker search for real-time speaker labeling on communication happening over trading turrets, which are shared devices.

Integration with AI Services in the AWS Management Console
We want to make it easier for developers to add these capabilities into existing telephony applications without requiring expertise in telephony, cloud infrastructure, or AI.

This is why we added a easier-to-use graphical configuration in the Amazon Chime SDK section of the console. On the console, you can choose the AWS AI service you want to use to analyze real-time audio data: voice analytics, Amazon Transcribe, or Amazon Transcribe Call Analytics. Whether you choose to use voice analytics or Amazon Transcribe to generate insights, you don’t have to write any integration code. We manage the integrations with AWS AI services and your voice-based or telephony applications. The console helps you define where you want to send the analytics data: an Amazon Kinesis stream or an Amazon Simple Storage Service (Amazon S3) bucket. Voice analytics can send real-time notifications to a function deployed on AWS Lambda, or an SQS queue or Amazon Simple Notification Service (Amazon SNS) topic.

To visualize insights, call analytics also delivers analyses to a data lake of your choice. You can then use Amazon QuickSight or Tableau to build dashboards and get insights from real-time media. These dashboards can be embedded in apps, wikis, and portals. Of course, we don’t leave you alone with your data. You can download prebuilt dashboards as AWS CloudFormation templates to deploy into your own AWS account. The link to download these templates is available on the console.

Finally, call analytics can generate real-time alerts by posting events to Amazon EventBridge. You can route these events to any destination of your choice, on your AWS account or supported third-party applications.

When using call analytics, you can reduce the initial project time to generate insights from real-time audio from months to days.

How It Works
I’d like to show you how it works.

On the Amazon Chime SDK section of the console, I open Configuration under Call Analytics on the left-side menu. Then, I select Create configuration.

A screenshot of the Amazon Chime SDK console page.

I give a name to my configuration. Optionally, I may also associate tags.

Amazon Chime SDK - Configuration first step

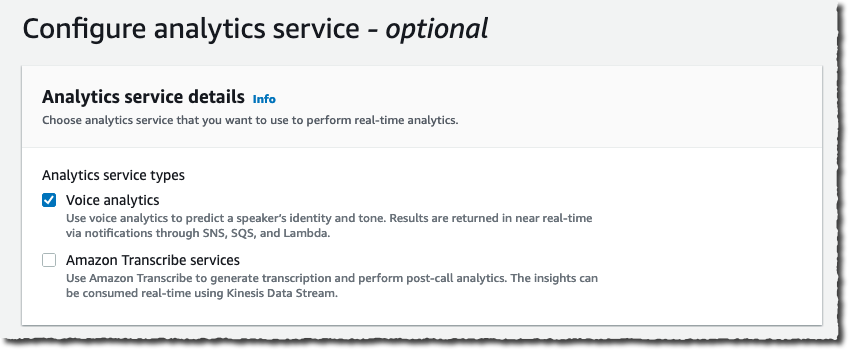
Under Configure analytics service, I can choose between Amazon Chime SDK voice analytics or Amazon Transcribe services to analyse calls. For this demo, I select Voice analytics.

Amazon Chime SDK - Configuration second step

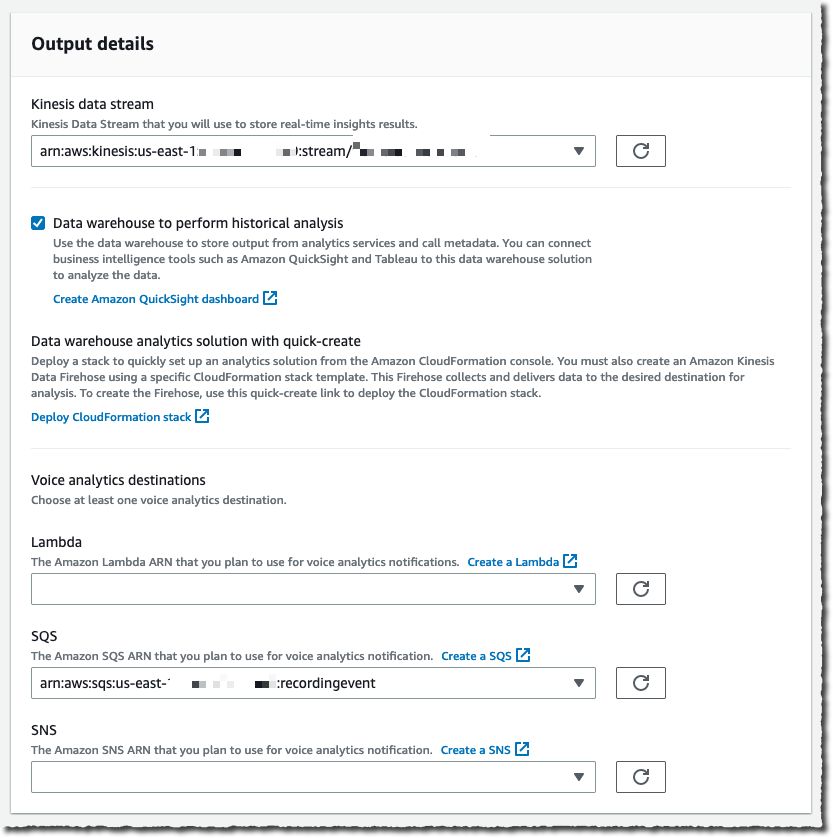
I configure where to send the analysis. Voice analytics results are always sent to Kinesis. I specify a Kinesis data stream I created previously. When I want to use a business intelligence tool such as Quicksight to create a dashboard with analytics results, I also specify an S3 bucket to receive the analysis.

The console also gives me the link to the CloudFormation templates I can use to create the voice analytics dashboards.

Finally, I choose a Lambda function, SQS queue, or SNS topic that will receive notifications of events such as when the analytics are available, a new voice enrollment occurs, or the result of a voice verification. In the later case, the payload looks as follow:

{
    ...common to all events...
    "detail-type": "SpeakerSearchStatus",
    "detail": {
        "taskId": "uuid",
        "detailStatus": "IdentificationSuccessful",
        "speakerSearchDetails" : {
            "results": [
                {
                    "voiceProfileId": "guid",
                    "confidenceScore": "0.94",
                },
                {
                    "voiceProfileId": "guid",
                    "confidenceScore": "0.92",
                },
                {
                    "voiceProfileId": "guid",
                    "confidenceScore": "0.91",
                },
                ... (up to 10)
            ]
        },
        "isCaller": false,
        "voiceConnectorId": "guid",
        "transactionId": "guid"

        ...details from Voice connector
    }
}

For this demo, I choose an existing SQS queue.

Amazon Chime SDK - Configuration third step

Under Consent acknowledgment, I select all the boxes and select Next.

Amazon Chime SDK - Configuration second step consent

The next step is only available when I didn’t specify any analytics service in the previous step. It allows us to configure voice recordings. Recordings are available when no analytics are selected.

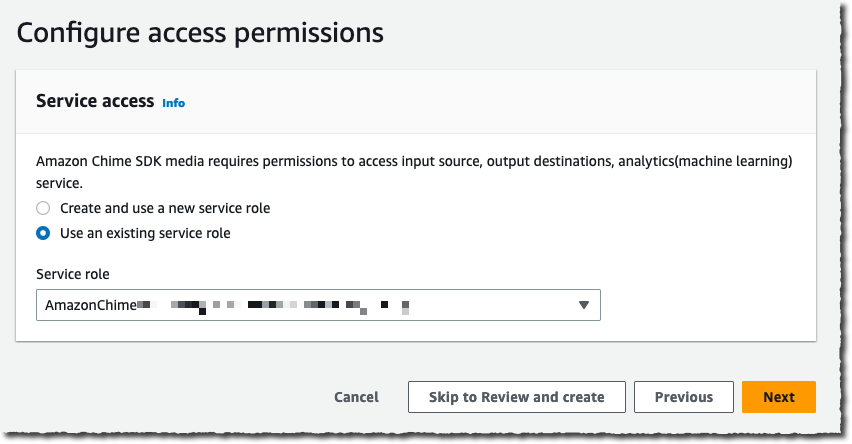
Under Configure access permissions, I choose a previously created AWS Identity and Access Management (IAM) role allowing the Amazon Chime SDK to access the other AWS services I configured: the Kinesis data stream, S3 bucket, and Lambda function, SQS queue, or SNS topic. The console may create an IAM role for me if I don’t have one already.

Amazon Chime SDK - Configuration four step

The next step is available if I selected Amazon Transcribe service under Configure analytics service. It allows me to configure real-time alerts through EventBridge. I may configure rules to send messages based on keyword match, sentiment detected, or issue detection.

The final step is Review and Create my configuration. I review the configuration details and then, I select Create configuration.

Finally, I link this configuration to a voice connector under the Voice Connector section, on the Streaming tab.

That’s it! As I mentioned earlier, no glue between AWS services or AI knowledge is required.

After the data arrives on Kinesis or your S3 bucket, you can point your preferred business reporting solution at it. When you use the QuickSight template we provide, you can get started in minutes with a high-level overview and a deep-dive view, as shown on the following screenshot.

Chime SDK Call Analytics - dashboard general

Chime SDK Call Analytics - dashboard deep dive

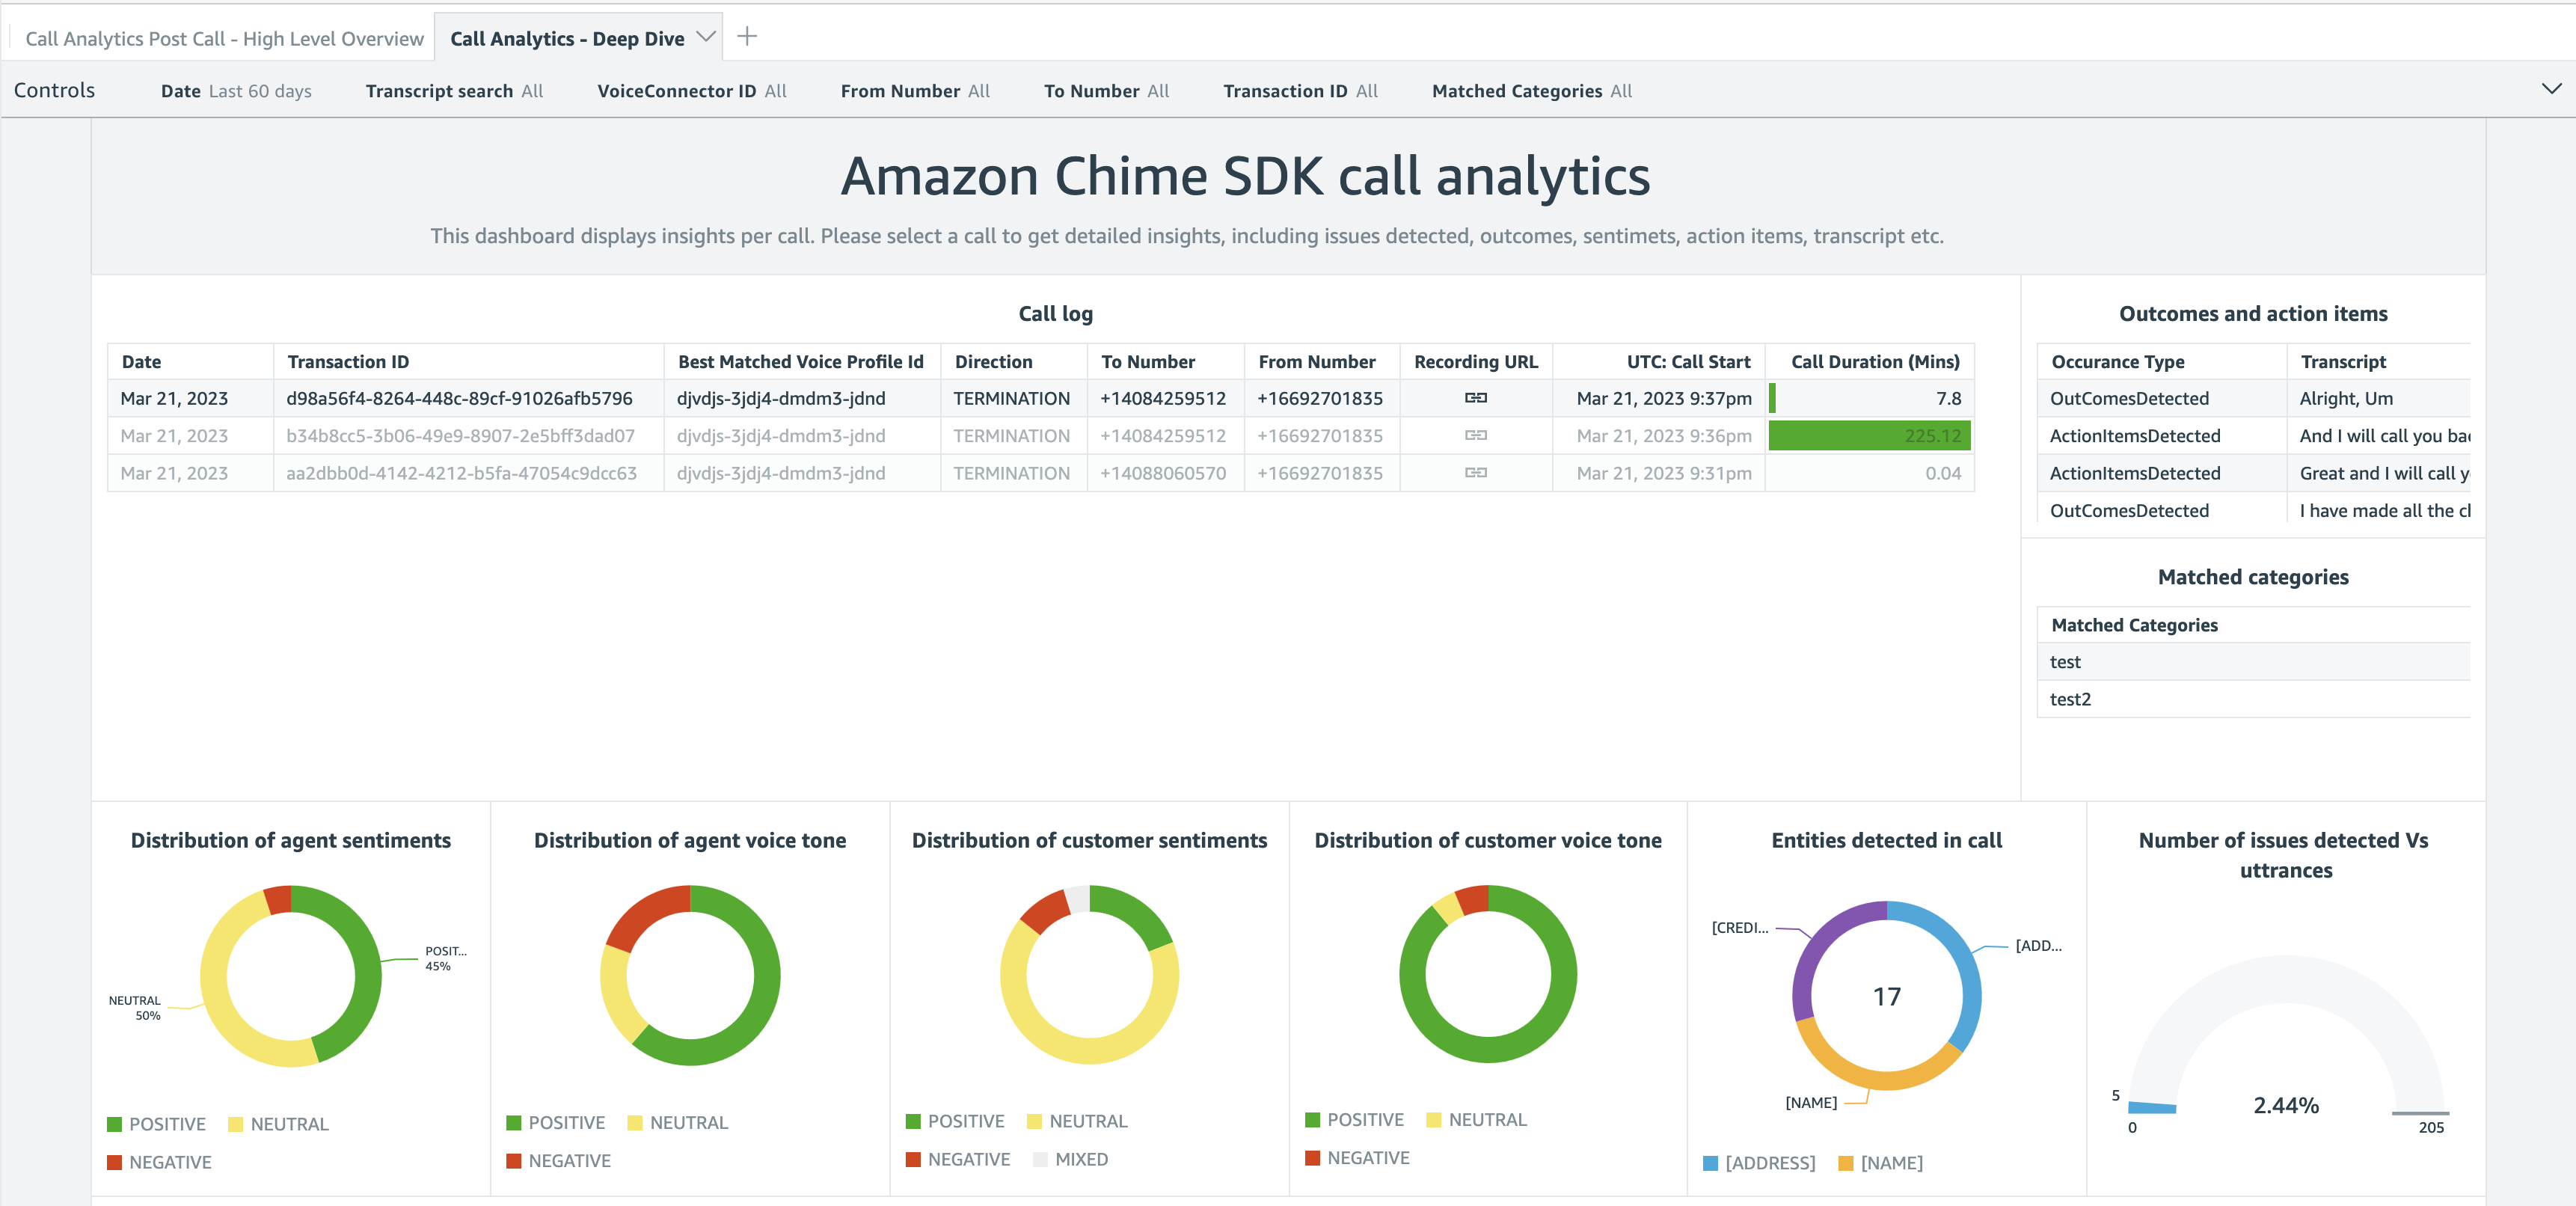
The deep-dive dashboard gives you graphical representations about the distribution of agent and customer sentiments and emotions. You also get a detailed analysis and transcript of the conversation.

Pricing and Availability
Adopting these capabilities in your audio applications requires no up-front infrastructure investment; you will be charged based only on your usage. Pricing is per minute of audio data analyzed. Visit Amazon Chime SDK pricing for details.

Call analytics is available in the following AWS Regions: US East (N. Virginia), US West (Oregon), and Europe (Frankfurt)

In this post, I discussed Amazon Chime SDK call analytics, a new set of capabilities that makes it easier and cost-effective to record and generate insights on real-time audio calls. With their focus on ease of use, these new capabilities are particularly well adapted to customers with minimal knowledge of cloud infrastructure, telephony, and ML.

Start today and configure your first dashboard!

— seb

New – Bring ML Models Built Anywhere into Amazon SageMaker Canvas and Generate Predictions

Amazon SageMaker Canvas provides business analysts with a visual interface to solve business problems using machine learning (ML) without writing a single line of code. Since we introduced SageMaker Canvas in 2021, many users have asked us for an enhanced, seamless collaboration experience that enables data scientists to share trained models with their business analysts with a few simple clicks.

Today, I’m excited to announce that you can now bring ML models built anywhere into SageMaker Canvas and generate predictions.

New – Bring Your Own Model into SageMaker Canvas
As a data scientist or ML practitioner, you can now seamlessly share models built anywhere, within or outside Amazon SageMaker, with your business teams. This removes the heavy lifting for your engineering teams to build a separate tool or user interface to share ML models and collaborate between the different parts of your organization. As a business analyst, you can now leverage ML models shared by your data scientists within minutes to generate predictions.

Let me show you how this works in practice!

In this example, I share an ML model that has been trained to identify customers that are potentially at risk of churning with my marketing analyst. First, I register the model in the SageMaker model registry. SageMaker model registry lets you catalog models and manage model versions. I create a model group called 2022-customer-churn-model-group and then select Create model version to register my model.

Amazon SageMaker Model Registry

To register your model, provide the location of the inference image in Amazon ECR, as well as the location of your model.tar.gz file in Amazon S3. You can also add model endpoint recommendations and additional model information. Once you’ve registered your model, select the model version and select Share.

Amazon SageMaker Studio - Share models from model registry with SageMaker Canvas users

You can now choose the SageMaker Canvas user profile(s) within the same SageMaker domain you want to share your model with. Then, provide additional model details, such as information about training and validation datasets, the ML problem type, and model output information. You can also add a note for the SageMaker Canvas users you share the model with.

Amazon SageMaker Studio - Share a model from Model Registry with SageMaker Canvas users

Similarly, you can now also share models trained in SageMaker Autopilot and models available in SageMaker JumpStart with SageMaker Canvas users.

The business analysts will receive an in-app notification in SageMaker Canvas that a model has been shared with them, along with any notes you added.

Amazon SageMaker Canvas - Received model from SageMaker Studio

My marketing analyst can now open, analyze, and start using the model to generate ML predictions in SageMaker Canvas.

Amazon SageMaker Canvas - Imported model from SageMaker Studio

Select Batch prediction to generate ML predictions for an entire dataset or Single prediction to create predictions for a single input. You can download the results in a .csv file.

Amazon SageMaker Canvas - Generate Predictions

New – Improved Model Sharing and Collaboration from SageMaker Canvas with SageMaker Studio Users
We also improved the sharing and collaboration capabilities from SageMaker Canvas with data science and ML teams. As a business analyst, you can now select which SageMaker Studio user profile(s) you want to share your standard-build models with.

Your data scientists or ML practitioners will receive a similar in-app notification in SageMaker Studio once a model has been shared with them, along with any notes from you. In addition to just reviewing the model, SageMaker Studio users can now also, if needed, update the data transformations in SageMaker Data Wrangler, retrain the model in SageMaker Autopilot, and share back the updated model. SageMaker Studio users can also recommend an alternate model from the list of models in SageMaker Autopilot.

Once SageMaker Studio users share back a model, you receive another notification in SageMaker Canvas that an updated model has been shared back with you. This collaboration between business analysts and data scientists will help democratize ML across organizations by bringing transparency to automated decisions, building trust, and accelerating ML deployments.

Now Available
The enhanced, seamless collaboration capabilities for Amazon SageMaker Canvas, including the ability to bring your ML models built anywhere, are available today in all AWS Regions where SageMaker Canvas is available with no changes to the existing SageMaker Canvas pricing.

Start collaborating and bring your ML model to Amazon SageMaker Canvas today!

— Antje

New – Process PDFs, Word Documents, and Images with Amazon Comprehend for IDP

Today we are announcing a new Amazon Comprehend feature for intelligent document processing (IDP). This feature allows you to classify and extract entities from PDF documents, Microsoft Word files, and images directly from Amazon Comprehend without you needing to extract the text first.

Many customers need to process documents that have a semi-structured format, like images of receipts that were scanned or tax statements in PDF format. Until today, those customers first needed to preprocess those documents to flatten them into machine-readable text, which can reduce the quality of the document context. Then they could use Amazon Comprehend to classify and extract entities from those preprocessed files.

Now with Amazon Comprehend for IDP, customers can process their semi-structured documents, such as PDFs, docx, PNG, JPG, or TIFF images, as well as plain-text documents, with a single API call. This new feature combines OCR and Amazon Comprehend’s existing natural language processing (NLP) capabilities to classify and extract entities from the documents. The custom document classification API allows you to organize documents into categories or classes, and the custom-named entity recognition API allows you to extract entities from documents like product codes or business-specific entities. For example, an insurance company can now process scanned customers’ claims with fewer API calls. Using the Amazon Comprehend entity recognition API, they can extract the customer number from the claims and use the custom classifier API to sort the claim into the different insurance categories—home, car, or personal.

Starting today, Amazon Comprehend for IDP APIs are available for real-time inferencing of files, as well as for asynchronous batch processing on large document sets. This feature simplifies the document processing pipeline and reduces development effort.

Getting Started
You can use Amazon Comprehend for IDP from the AWS Management Console, AWS SDKs, or AWS Command Line Interface (CLI).

In this demo, you will see how to asynchronously process a semi-structured file with a custom classifier. For extracting entities, the steps are different, and you can learn how to do it by checking the documentation.

In order to process a file with a classifier, you will first need to train a custom classifier. You can follow the steps in the Amazon Comprehend Developer Guide. You need to train this classifier with plain text data.

After you train your custom classifier, you can classify documents using either asynchronous or synchronous operations. For using the synchronous operation to analyze a single document, you need to create an endpoint to run real-time analysis using a custom model. You can find more information about real-time analysis in the documentation. For this demo, you are going to use the asynchronous operation, placing the documents to classify in an Amazon Simple Storage Service (Amazon S3) bucket and running an analysis batch job.

To get started classifying documents in batch from the console, on the Amazon Comprehend page, go to Analysis jobs and then Create job.

Create new job

Then you can configure the new analysis job. First, input a name and pick Custom classification and the custom classifier you created earlier.

Then you can configure the input data. First, select the S3 location for that data. In that location, you can place your PDFs, images, and Word Documents. Because you are processing semi-structured documents, you need to choose One document per file. If you want to override Amazon Comprehend settings for extracting and parsing the document, you can configure the Advanced document input options.

Input data for analysis job

After configuring the input data, you can select where the output of this analysis should be stored. Also, you need to give access permissions for this analysis job to read and write on the specified Amazon S3 locations, and then you are ready to create the job.

Configuring the classification job

The job takes a few minutes to run, depending on the size of the input. When the job is ready, you can check the output results. You can find the results in the Amazon S3 location you specified when you created the job.

In the results folder, you will find a .out file for each of the semi-structured files Amazon Comprehend classified. The .out file is a JSON, in which each line represents a page of the document. In the amazon-textract-output directory, you will find a folder for each classified file, and inside that folder, there is one file per page from the original file. Those page files contain the classification results. To learn more about the outputs of the classifications, check the documentation page.

Job output

Available Now
You can get started classifying and extracting entities from semi-structured files like PDFs, images, and Word Documents asynchronously and synchronously today from Amazon Comprehend in all the Regions where Amazon Comprehend is available. Learn more about this new launch in the Amazon Comprehend Developer Guide.

Marcia

New for Amazon SageMaker – Perform Shadow Tests to Compare Inference Performance Between ML Model Variants

As you move your machine learning (ML) workloads into production, you need to continuously monitor your deployed models and iterate when you observe a deviation in your model performance. When you build a new model, you typically start validating the model offline using historical inference request data. But this data sometimes fails to account for current, real-world conditions. For example, new products might become trending that your product recommendation model hasn’t seen yet. Or, you experience a sudden spike in the volume of inference requests in production that you never exposed your model to before.

Today, I’m excited to announce Amazon SageMaker support for shadow testing!

Deploying a model in shadow mode lets you conduct a more holistic test by routing a copy of the live inference requests for a production model to the new (shadow) model. Yet, only the responses from the production model are returned to the calling application. Shadow testing helps you build further confidence in your model and catch potential configuration errors and performance issues before they impact end users. Once you complete a shadow test, you can use the deployment guardrails for SageMaker inference endpoints to safely update your model in production.

Get Started with Amazon SageMaker Shadow Testing
You can create shadow tests using the new SageMaker Inference Console and APIs. Shadow testing gives you a fully managed experience for setup, monitoring, viewing, and acting on the results of shadow tests. If you have existing workflows built around SageMaker endpoints, you can also deploy a model in shadow mode using the existing SageMaker Inference APIs.

On the SageMaker console, select Inference and Shadow tests to create, monitor, and deploy shadow tests.

Amazon SageMaker Shadow Tests

To create a shadow test, select an existing (or create a new) SageMaker endpoint and production variant you want to test against.

Amazon SageMaker - Create Shadow Test

Next, configure the proportion of traffic to send to the shadow variant, the comparison metrics you want to evaluate, and the duration of the test. You can also enable data capture for your production and shadow variant.

Amazon SagMaker - Create Shadow Test

That’s it. SageMaker now automatically deploys the new variant in shadow mode and routes a copy of the inference requests to it in real time, all within the same endpoint. The following diagram illustrates this workflow.

Amazon SageMaker - Shadow Testing

Note that only the responses of the production variant are returned to the calling application. You can choose to either discard or log the responses of the shadow variant for offline comparison.

You can also use shadow testing to validate changes you made to any component in your production variant, including the serving container or ML instance. This can be useful when you’re upgrading to a new framework version of your serving container, applying patches, or if you want to make sure that there is no impact to latency or error rate due to this change. Similarly, if you consider moving to another ML instance type, for example, Amazon EC2 C7g instances based on AWS Graviton processors, or EC2 G5 instances powered by NVIDIA A10G Tensor Core GPUs, you can use shadow testing to evaluate the performance on production traffic prior to rollout.

You can monitor the progress of the shadow test and performance metrics such as latency and error rate through a live dashboard. On the SageMaker console, select Inference and Shadow tests, then select the shadow test you want to monitor.

Amazon SageMaker - Monitor Shadow Test

Amazon SageMaker - Monitor Shadow Test

If you decide to promote the shadow model to production, select Deploy shadow variant and define the infrastructure configuration to deploy the shadow variant.

Amazon SageMaker - Deploy Shadow Variant

Amazon SageMaker - Deploy Shadow Variant

You can also use the SageMaker deployment guardrails if you want to add linear or canary traffic shifting modes and auto rollbacks to your update.

Availability and Pricing
SageMaker support for shadow testing is available today in all AWS Regions where SageMaker hosting is available except for the AWS GovCloud (US) Regions and AWS China Regions.

There is no additional charge for SageMaker shadow testing other than usage charges for the ML instances and ML storage provisioned to host the shadow variant. The pricing for ML instances and ML storage dimensions is the same as the real-time inference option. There is no additional charge for data processed in and out of shadow deployments. The SageMaker pricing page has all the details.

To learn more, visit Amazon SageMaker shadow testing.

Start validating your new ML models with SageMaker shadow tests today!

— Antje

Next Generation SageMaker Notebooks – Now with Built-in Data Preparation, Real-Time Collaboration, and Notebook Automation

In 2019, we introduced Amazon SageMaker Studio, the first fully integrated development environment (IDE) for data science and machine learning (ML). SageMaker Studio gives you access to fully managed Jupyter Notebooks that integrate with purpose-built tools to perform all ML steps, from preparing data to training and debugging models, tracking experiments, deploying and monitoring models, and managing pipelines.

Today, I’m excited to announce the next generation of Amazon SageMaker Notebooks to increase efficiency across the ML development workflow. You can now improve data quality in minutes with the built-in data preparation capability, edit the same notebooks with your teams in real time, and automatically convert notebook code to production-ready jobs.

Let me show you what’s new!

New Notebook Capability for Simplified Data Preparation
The new built-in data preparation capability is powered by Amazon SageMaker Data Wrangler and is available in SageMaker Studio notebooks.  SageMaker Studio notebooks automatically generate key visualizations on top of Pandas data frames to help you understand data distribution and identify data quality issues, like missing values, invalid data, and outliers. You can also select the target column for ML models and generate ML-specific insights such as imbalanced class or high correlation columns. You then receive recommendations for data transformations to resolve the issues. You can apply the data transformations right in the UI, and SageMaker Studio notebooks automatically generate the corresponding transformation code in the notebook cells that you can use to replay your data preparation pipeline.

Using the Built-in Data Preparation Capability
To get started, pip install and import sagemaker_datawrangler along with the pandas Python package. Then, download the dataset you want to analyze to the notebook working directory, and read the dataset with pandas.

import pandas as pd 
import sagemaker_datawrangler 

!aws s3 cp s3://<YOUR_S3_BUCKET>/data.csv . 

df = pd.read_csv("data.csv")

Now, when you display the data frame, it automatically shows key data visualizations at the top of each column, surfaces data insights, detects data quality issues, and suggests solutions to improve data quality. When you select a column as the target column for ML predictions, you get target-specific insights and warnings, such as mixed data types in target (for regression use cases) or too few instances per class (for classification use cases).

In this example, I’m using the Women’s E-Commerce Clothing Reviews dataset that contains customer reviews and ratings for women’s clothing. This dataset was obtained from Kaggle and has been modified by Amazon to add synthetic data quality issues.

Amazon SageMaker Studio notebooks with built-in data preparation

You can review the suggested data transformations to improve the data quality and apply them right in the UI. For a list of all supported data transformations, have a look at the documentation. Once you apply a data transformation, SageMaker Studio notebooks automatically generate the code to reproduce those data preparation steps in another notebook cell.

For my example, I select Rating as my target column. Target column insights tells me in a high-priority warning that this column has too few instances per class and with a medium-priority warning that classes are too imbalanced. Let’s follow the suggestions and drop rare target values and drop missing values. I will also follow the suggestions for some of the feature columns and drop missing values in the Review Text column and drop the Division Name column.

Once I apply the transformations, the notebook generates this code for me:

# Pandas code generated by sagemaker_datawrangler
output_df = df.copy(deep=True)


# Code to Drop rare target values for column: Rating to resolve warning: Too few instances per class 
rare_target_labels_to_drop = ['-100', '100']
output_df = output_df[~output_df['Rating'].isin(rare_target_labels_to_drop)]


# Code to Drop missing for column: Rating to resolve warning: Missing values 
output_df = output_df[output_df['Rating'].notnull()]


# Code to Drop missing for column: Review Text to resolve warning: Missing values 
output_df = output_df[output_df['Review Text'].notnull()]


# Code to Drop column for column: Division Name to resolve warning: Missing values 
output_df=output_df.drop(columns=['Division Name'])

I can now review and modify the code if needed or start integrating the data transformations as part of my ML development workflow.

Introducing Shared Spaces for Team-Based Sharing and Real-Time Collaboration
SageMaker Studio now offers shared spaces that give data science and ML teams a workspace where they can read, edit, and run notebooks together in real time to streamline collaboration and communication during the development process. Shared spaces provide a shared Amazon EFS directory that you can utilize to share files within a shared space. All taggable SageMaker resources that you create in a shared space are automatically tagged to help you organize and have a filtered view of your ML resources, such as training jobs, experiments, and models, that are relevant to the business problem you work on in the space. This also helps you monitor costs and plan budgets using tools such as AWS Budgets and AWS Cost Explorer.

And that’s not all. You can now also create multiple SageMaker domains within the same AWS account to scope access and isolate resources to different teams or business units in your organization. Now, let me show you how to create a shared space for users within a SageMaker domain.

Using Shared Spaces
You can use the SageMaker console or the AWS CLI to create shared spaces for a SageMaker domain. To get started in the SageMaker console, go to Domains, select or create a new domain, and select Space management on the Domain details page. Then, select Create and give the shared space a name.

Amazon SageMaker Spaces - Create Space

Users in this SageMaker domain can now launch and join the shared space through their SageMaker domain user profiles.

Amazon SageMaker Spaces - Launch Spaces

In a shared space, select the new Collaborators icon in the left navigation menu. You can now see who else is currently active in this space. The following screenshot shows user tom on the left, editing a notebook file. On the right, user antje sees the edits in real time, together with an annotation of the user name that currently edits that notebook cell.

Amazon SageMaker Spaces

New Notebook Capability to Automatically Convert Notebook Code to Production-Ready Jobs
You can now select a notebook and automate it as a job that can run in a production environment without the need to manage the underlying infrastructure. When you create a SageMaker Notebook Job, SageMaker Studio takes a snapshot of the entire notebook, packages its dependencies in a container, builds the infrastructure, runs the notebook as an automated job on a schedule you define, and deprovisions the infrastructure upon job completion. This notebook capability is now also available in SageMaker Studio Lab, our free ML development environment that provides the compute, storage, and security to learn and experiment with ML.

Using the Notebook Capability to Automate Notebooks
To get started, open a notebook file in SageMaker Studio. Then, right-click your notebook file and select Create Notebook Job or select the Create Notebook Job icon, as highlighted in the following screenshot.

Amazon SageMaker Studio - Automate your notebooks

Define a name for the Notebook Job, review the input file location, specify the compute type to use, and whether to run the job immediately or on a schedule. Then, select Create.

Amazon SageMaker Studio - Create Notebook Job

The Notebook Job has been created, and you can review all Notebook Job Definitions in the UI.

Amazon SageMaker Studio - Notebook Job Definitions

Now Available
The new Amazon SageMaker Studio notebook capabilities are now available in all AWS Regions where Amazon SageMaker Studio is available except for the AWS China Regions.

At launch, the built-in data preparation capability powered by SageMaker Data Wrangler is supported for SageMaker Studio notebooks and the following notebook kernel images:

  • Python 3 (Data Science) with Python 3.7
  • Python 3 (Data Science 2.0) with Python 3.8
  • Python 3 (Data Science 3.0) with Python 3.10
  • Spark Analytics 1.0 and 2.0

For more information, visit Amazon SageMaker Notebooks.

Start building your ML projects with the next generation of Amazon SageMaker Notebooks today!

— Antje

New – Share ML Models and Notebooks More Easily Within Your Organization with Amazon SageMaker JumpStart

Amazon SageMaker JumpStart is a machine learning (ML) hub that can help you accelerate your ML journey. SageMaker JumpStart gives you access to built-in algorithms with pre-trained models from popular model hubs, pre-trained foundation models to help you perform tasks such as article summarization and image generation, and end-to-end solutions to solve common use cases.

Today, I’m happy to announce that you can now share ML artifacts, such as models and notebooks, more easily with other users that share your AWS account using SageMaker JumpStart.

Using SageMaker JumpStart to Share ML Artifacts
Machine learning is a team sport. You might want to share your models and notebooks with other data scientists in your team to collaborate and increase productivity. Or, you might want to share your models with operations teams to put your models into production. Let me show you how to share ML artifacts using SageMaker JumpStart.

In SageMaker Studio, select Models in the left navigation menu. Then, select Shared models and Shared by my organization. You can now discover and search ML artifacts that other users shared within your AWS account. Note that you can add and share ML artifacts developed with SageMaker as well as those developed outside of SageMaker.

To share a model or notebook, select Add. For models, provide basic information, such as title, description, data type, ML task, framework, and any additional metadata. This information helps other users to find the right models for their use cases. You can also enable training and deployment for your model. This allows users to fine-tune your shared model and deploy the model in just a few clicks through SageMaker JumpStart.

Amazon SageMaker Jumpstart - Add model to private ML hub

To enable model training, you can select an existing SageMaker training job that will autopopulate all relevant information. This information includes the container framework, training script location, model artifact location, instance type, default training and validation datasets, and target column. You can also provide custom model training information by selecting a prebuilt SageMaker Deep Learning Container or selecting a custom Docker container in Amazon ECR. You can also specify default hyperparameters and metrics for model training.

To enable model deployment, you also need to define the container image to use, the inference script and model artifact location, and the default instance type. Have a look at the SageMaker Developer Guide to learn more about model training and model deployment options.

Sharing a notebook works similarly. You need to provide basic information about your notebook and the Amazon S3 location of the notebook file.

Amazon SageMaker JumpStart - Add a notebook to private ML hub

Users that share your AWS account can now browse and select shared models to fine-tune, deploy endpoints, or run notebooks directly in SageMaker JumpStart.

In SageMaker Studio, select Quick start solutions in the left navigation menu, then select Solutions, models, example notebooks to access all shared ML artifacts, together with pre-trained models from popular model hubs and end-to-end solutions.

Amazon SageMaker JumpStart

Now Available
The new ML artifact-sharing capability within Amazon SageMaker JumpStart is available today in all AWS Regions where Amazon SageMaker JumpStart is available. To learn more, visit Amazon SageMaker JumpStart and the SageMaker JumpStart documentation.

Start sharing your models and notebooks with Amazon SageMaker JumpStart today!

— Antje

Decrease Your Machine Learning Costs with Instance Price Reductions and Savings Plans for Amazon SageMaker

Launched at AWS re:Invent 2017, Amazon SageMaker is a fully-managed service that has already helped tens of thousands of customers quickly build and deploy their machine learning (ML) workflows on AWS.

To help them get the most ML bang for their buck, we’ve added a string of cost-optimization services and capabilities, such as Managed Spot Training, Multi-Model Endpoints, Amazon Elastic Inference, and AWS Inferentia. In fact, customers find that the Total Cost of Ownership (TCO) for SageMaker over a three-year horizon is 54% lower compared to other cloud-based options, such as self-managed Amazon EC2 and AWS-managed Amazon EKS.

Since there’s nothing we like more than making customers happy by saving them money, I’m delighted to announce:

  • A price reduction for CPU and GPU instances in Amazon SageMaker,
  • The availability of Savings Plans for Amazon SageMaker.

Reducing Instance Prices in Amazon SageMaker
Effective today, we are dropping the price of several instance families in Amazon SageMaker by up to 14.2%.

This applies to:

Detailed pricing information is available on the Amazon SageMaker pricing page.

As welcome as price reductions are, many customers have also asked us for a simple and flexible way to optimize SageMaker costs for all instance-related activities, from data preparation to model training to model deployment. In fact, as a lot of customers are already optimizing their compute costs with Savings Plans, they told us that they’d love to do the same for their Amazon SageMaker costs.

Introducing SageMaker Savings Plans
Savings Plans for AWS Compute Services were launched in November 2019 to help customers optimize their compute costs. They offer up to 72% savings over the on-demand price, in exchange for your commitment to use a specific amount of compute power (measured in $ per hour) for a one- or three-year period. In the spirit of self-service, you have full control on setting up your plans, thanks to recommendations based on your past consumption, to usage reports, and to budget coverage and utilization alerts.

SageMaker Savings Plans follow in these footsteps, and you can create plans that cover ML workloads based on:

Savings Plans don’t distinguish between instance families, instance types, or AWS regions. This makes it easy for you to maximize savings regardless of how your use cases and consumption evolve over time, and you can save up to 64% compared to the on-demand price.

For example, you could start with small instances in order to experiment with different algorithms on a fraction of your dataset. Then, you could move on to preparing data and training at scale with larger instances on your full dataset. Finally, you could deploy your models in several AWS regions to serve low-latency predictions to your users. All these activities would be covered by the same Savings Plan, without any management required on your side.

Understanding Savings Plans Recommendations
Savings Plans provides you with recommendations that make it easy to find the right plan. These recommendations are based on:

  • Your SageMaker usage in the last 7, 30 or 60 days. You should select the time period that best represents your future usage.
  • The term of your plan: 1-year or 3-year.
  • Your payment option: no upfront, partial upfront (50% or more), or all upfront. Some customers prefer (or must use) this last option, as it gives them a clear and predictable view of their SageMaker bill.

Instantly, you’ll see what your optimized spend would be, and how much you could start saving per month. Savings Plans also suggest an hourly commitment that maximizes your savings. Of course, you’re completely free to use a different commitment, starting as low as $0.001 per hour!

Once you’ve made up your mind, you can add the plan to your cart, submit it, and start enjoying your savings.

Now, let’s do a quick demo, and see how I could optimize my own SageMaker spend.

Recommending Savings Plans for Amazon SageMaker
Opening the AWS Cost Management Console, I see a Savings Plans menu on the left.

Cost management console

Clicking on Recommendations, I select SageMaker Savings Plans.

Looking at the available options, I select Payer to optimize cost at the Organizations level, a 1-year term, a No upfront payment, and 7 days of past usage (as I’ve just ramped up my SageMaker usage).

SageMaker Savings Plan

Immediately, I see that I could reduce my SageMaker costs by 20%, saving $897.63 every month. This would only require a 1-year commitment of $3.804 per hour.

SageMaker Savings Plan

The monthly charge on my AWS bill would be $2,776 ($3.804 * 24 hours * 365 days / 12 months), plus any additional on-demand costs should my actual usage exceed the commitment. Pretty tempting, especially with no upfront required at all.

Moving to a 3-year plan (still no upfront), I could save $1,790.19 per month, and enjoy 41% savings thanks to a $2.765 per hour commitment.

SageMaker Savings Plan

I could add this plan to the cart as is, and complete my purchase. Every month for 3 years, I would be charged $2,018 ($2.765 * 24 * 365 / 12), plus additional on-demand cost.

As mentioned earlier, I can also create my own plan in just a few clicks. Let me show you how.

Creating Savings Plans for Amazon SageMaker
In the left-hand menu, I click on Purchase Savings Plans and I select SageMaker Savings Plans.

SageMaker Savings Plan

I pick a 1-year term without any upfront. As I expect to rationalize my SageMaker usage a bit in the coming months, I go for a commitment of $3 per hour, instead of the $3.804 recommendation. Then, I add the plan to the cart.

SageMaker Savings Plan

Confirming that I’m fine with an optimized monthly payment of $2,190, I submit my order.

SageMaker Savings Plan

The plan is now active, and I’ll see the savings on my next AWS bill. Thanks to utilization reports available in the Savings Plans console, I’ll also see the percentage of my commitment that I’ve actually used. Likewise, coverage reports will show me how much of my eligible spend has been covered by the plan.

Getting Started
Thanks to price reductions for CPU and GPU instances and to SageMaker Savings Plans, you can now further optimize your SageMaker costs in an easy and predictable way. ML on AWS has never been more cost effective.

Price reductions and SageMaker Savings Plans are available today in the following AWS regions:

  • Americas: US East (N. Virginia), US East (Ohio), US West (Oregon), US West (N. California), AWS GovCloud (US-West), Canada (Central), South America (São Paulo).
  • Europe, Middle East and Africa: Europe (Ireland), Europe (Frankfurt), Europe (London), Europe (Paris), Europe (Stockholm), Europe (Milan), Africa (Cape Town), Middle East (Bahrain).
  • Asia Pacific: Asia Pacific (Singapore), Asia Pacific (Tokyo), Asia Pacific (Sydney), Asia Pacific (Seoul), Asia Pacific (Mumbai), and Asia Pacific (Hong Kong).

Give them a try, and let us know what you think. As always, we’re looking forward to your feedback. You can send it to your usual AWS Support contacts, or on the AWS Forum for Amazon SageMaker.

– Julien


Amazon CodeGuru Reviewer Updates: New Predictable Pricing Model Up To 90% Lower and Python Support Moves to GA

Amazon CodeGuru helps you automate code reviews and improve code quality with recommendations powered by machine learning and automated reasoning. You can use CodeGuru Reviewer to detect potential defects and bugs that are hard to find, and CodeGuru Profiler to fine-tune the performance of your applications based on live data. The service has been generally available since June 2020; you can read more about how to get started with CodeGuru here.

While working with many customers in the last few months, we introduced security detectors, Python support in preview, and memory profiling to help customers improve code quality and save hours of developer time. We also heard resounding feedback on various areas such as the structure of pricing and language coverage. We’ve decided to address that feedback and make it even easier to adopt Amazon CodeGuru at scale within your organization.

Today I’m happy to announce two major updates for CodeGuru Reviewer:

  • There’s a brand new, easy to estimate pricing model with lower and fixed monthly rates based on the size of your repository, with up to 90% price reductions
  • Python Support is now generally available (GA) with wider recommendation coverage and four updates related to Python detectors

New Predictable Pricing for CodeGuru Reviewer
CodeGuru Reviewer allows you to run full scans of your repository stored in GitHub, GitHub Enterprise, AWS CodeCommit, or Bitbucket. Also, every time you submit a pull request, CodeGuru Reviewer starts a new code review and suggests recommendations and improvements in the form of comments.

The previous pricing structure was based on the number of lines of code (LoC) analyzed per month, $0.75 per 100 LoC. We’ve heard your feedback: As a developer, you’d like to analyze your code as often as possible, create as many pull requests and branches as needed without thinking about cost, and maximize the chances of catching errors and defects before they hit production.

That’s why with the new pricing you’ll only pay a fixed monthly rate, based on the total size of your repositories: $10 per month for the first 100k lines of code, across all connected repositories. And $30 per month for each additional 100k of code. Please note that only the largest branch in the repository counts, and that empty lines and comments aren’t counted at all.

This price structure not only makes the cost more predictable and transparent, but it will also help simplify the way you scale CodeGuru Reviewer across different teams in the organization. You still have the possibility to perform full repository scans on demand and incremental reviews on each pull request. The monthly rate includes all incremental reviews, and you get up to two full scans per repository per month included in the monthly rate. Additional full scans are charged $10 per 100k lines of code.

Basically you get all the benefits of Amazon CodeGuru and all the new detectors and integrations, but it’s up to 90% cheaper. Also, you can get started at no cost with the Free Tier for the first 90 days, up to 100k LoC. When the Free Tier expires or if you exceed the 100k LoC, you simply pay the standard rates. Check out the updated pricing page here.

Let me share a few practical examples (excluding the Free Tier):

  1.  Medium-size repository of 150k LoC: In this case, your monthly rate gets rounded up to 200k lines of code, for a total of $40 per month ($10 + $30). The number of LoC is always rounded up. And by the way you could also connect a repository (or multiple) of up to 50K lines of code (bringing the total to that 200k lines of code) for the same price. Up to 2 full scans are included for each repository.
  2. Three repositories of 300k LoC each (the equivalent of a large repository of 900k LoC): In this case, your monthly rate is $250 ($10 for the first 100k lines of code, plus $240 for the remaining 800k lines of code). Up to 2 full scans are included for each repository.
  3.  Small repository of 70k LoC, with 10 full scans every month: In this case, your monthly rate is only $10 for the number of LoC, plus $60 for the additional full scans (560k LoC), for a total of $70 per month.
  4.  Small repository with 50 active branches, the largest branch containing 10k LoC, and 300 pull requests every month: Simple, just $10 per month. Up to 2 full scans are included for each repository.

The new pricing will apply starting in April for new repositories connected on April 6th, 2021, as well as for repositories already connected up to April 5th, 2021. We expect the largest majority of use cases to see a considerable cost reduction. Unless you need to perform full repository scans multiple times a day (this is quite an edge case), most small repositories up to 100k LoC will be charged only a predictable and affordable fee of $10 per month after the 90-day trial, regardless of the number of branches, contributors, or pull requests. Now you can develop and iterate on your code repositories — knowing that CodeGuru will review your code and find potential issues — without worrying about unpredictable costs.

Give CodeGuru Reviewer a try and connect your first repository in the CodeGuru console.

Python Support for CodeGuru Reviewer Now Generally Available
Python Support for CodeGuru Reviewer has been available in preview since December 2020. It allows you to improve your Python applications by suggesting optimal usage of data structures and concurrency. It helps you follow Python best practices for control flow, error handling, and the standard library. Last but not least, it offers recommendations about scientific/math operations and AWS best practices. These suggestions are useful for both beginners and expert developers, and for small and large teams who are passionate about code quality.

With today’s announcement of general availability, you’ll find four main updates related to Python detectors:

  • Increased coverage and precision for existing detectors: Many Python best practices have been integrated into the existing detectors related to standard library, data structures, control flow, and error handling. For example, CodeGuru Reviewer will warn you in case your code is creating a temporary file insecurely, using float numbers instead of decimal for scientific computation that requires maximum precision, or confusing equality with identity. These warnings will help you avoid security vulnerabilities, performance issues, and bugs in general.
  • Improved detector for resource leaks: During the preview, this detector only focused on open file descriptors; now it generates recommendations about a broader set of potential resource leaks such as connections, sessions, sockets, and multiprocessing thread pools. For example, you may implement a Python function that opens a new socket and then forget to close it. This is quite common and it doesn’t immediately turn into a problem, but resource leaks can cause your system to slow down or even crash in the long run. CodeGuru Reviewer will suggest closing the socket or wrapping it in a with statement. As a reminder, this detector is available for Java as well.
  • New code maintainability detector: This new detector helps you identify code issues related to aspects that usually make code bases harder to read, understand, and maintain, such as code complexity and tight coupling. For example, imagine that you’ve spent a couple of hours implementing a simple prototype and then you decide to integrate it with your production code as is. Because you were rushing a bit, this prototype may include a huge Python function with 50+ lines of code ranging from input validation, data preparation, some API calls, and a final write to disk. CodeGuru Reviewer will suggest you refactor this code into smaller, reusable, and loosely coupled functions that are easier to test and maintain.
  • New input validation detector: This new detector helps you identify situations where some functions or classes may benefit from additional validation of input parameters, especially when these parameter are likely to be user-generated or dynamic. For example, you may have implemented a Python function that takes an environment name as CLI input (e.g. dev, stage, prod), performs an API call, and then returns a resource ARN as output. You haven’t validated the environment name, so CodeGuru Reviewer might suggest you implement some additional validation; in this example, you may add a few lines of code to check that the environment name is not empty and that it’s a valid environment for this project.

Please note that Python Support for CodeGuru Profiler is still in preview: CodeGuru Profiler allows you to collect runtime performance data, identify how code is running on the CPU and where time is consumed, so you can tune your Python application starting from the most expensive parts — with the goal of reducing cost and improving performance.

You can get started with CodeGuru Reviewer and CodeGuru Profiler for Python in the CodeGuru console.

Conclusions
Amazon CodeGuru is available in 10 AWS Regions and it supports Python and Java applications. We’re looking forward to publishing even more detectors and support for more programming languages to help more developers and customers improve their application code quality and performance.

If you’d like to learn more about Amazon CodeGuru, check out the CodeGuru Reviewer documentation and CodeGuru Profiler documentation.

Alex