Category: <span>Analytics</span>

New for Amazon Redshift – Simplify Data Ingestion and Make Your Data Warehouse More Secure and Reliable

When we talk with customers, we hear that they want to be able to harness insights from data in order to make timely, impactful, and actionable business decisions. A common pattern with data-driven organizations is that they have many different data sources they need to ingest into their analytics systems. This requires them to build manual data pipelines spanning across their operational databases, data lakes, streaming data, and data within their warehouse. As a consequence of this complex setup, it can take data engineers weeks or even months to build data ingestion pipelines. These data pipelines are costly, and the delays can lead to missed business opportunities. Additionally, data warehouses are increasingly becoming mission critical systems that require high availability, reliability, and security.

Amazon Redshift is a fully managed petabyte-scale data warehouse used by tens of thousands of customers to easily, quickly, securely, and cost-effectively analyze all their data at any scale. This year at re:Invent, Amazon Redshift has announced a number of features to help you simplify data ingestion and get to insights easily and quickly, within a secure, reliable environment.

In this blog, I introduce some of these new features that fit into two main categories:

  • Simplify data ingestion
    • Amazon Redshift now supports auto-copy from Amazon S3 (available in preview). With this new capability, Amazon Redshift automatically loads the files that arrive in an Amazon Simple Storage Service (Amazon S3) location that you specify into your data warehouse. The files can use any of the formats supported by the Amazon Redshift copy command, such as CSV, JSON, Parquet, and Avro. In this way, you don’t need to manually or repeatedly run copy procedures. Amazon Redshift automates file ingestion and takes care of data-loading steps under the hood.
    • With Amazon Aurora zero-ETL integration with Amazon Redshift, you can use Amazon Redshift for near real-time analytics and machine learning on petabytes of transactional data stored on Amazon Aurora MySQL databases (available in limited preview). With this capability, you can choose the Amazon Aurora databases containing the data you want to analyze with Amazon Redshift. Data is then replicated into your data warehouse within seconds after transactional data is written into Amazon Aurora, eliminating the need to build and maintain complex data pipelines. You can replicate data from multiple Amazon Aurora databases into the same Amazon Redshift instance to run analytics across multiple applications. With near real-time access to transactional data, you can leverage Amazon Redshift’s analytics and capabilities, such as built-in machine learning (ML), materialized views, data sharing, and federated access to multiple data stores and data lakes, to derive insights from transactional and other data.
    • With the general availability of Amazon Redshift Streaming Ingestion, you can now natively ingest hundreds of megabytes of data per second from Amazon Kinesis Data Streams and Amazon MSK into an Amazon Redshift materialized view and query it in seconds. Learn more in this post.
  • Make your data warehouse more secure and reliable
    • You can now improve the availability of your data warehouse by choosing multiple Availability Zone (AZ) deployments. Multi-AZ deployments for your Amazon Redshift clusters are available in preview and reduce recovery times to seconds through automatic recovery. In this way, you can build solutions that are more compliant with the recommendations of the Reliability Pillar of the AWS Well-Architected Framework.
    • With dynamic data masking (available in preview), you can protect sensitive information stored in your data warehouse and ensure that only the relevant data is accessible by users based on their roles. You can limit how much identifiable data is visible to users using multiple levels of policies so different users and groups can have different levels of data access without having to create multiple copies of data. Dynamic data masking complements other granular access control capabilities in Amazon Redshift including row-level and column-level security and role-based access controls. In this way, Dynamic Data Masking helps you meet requirements for GDPR, CCPA, and other privacy regulations.
    • Amazon Redshift now supports central access controls for data sharing with AWS Lake Formation (available in public preview). You can now use Lake Formation to simplify governance of data shared from Amazon Redshift and centrally manage granular access across all data-sharing consumers.

There have been other interesting news for Amazon Redshift at re:Invent you might have already heard about:

  • The general availability of Amazon Redshift integration for Apache Spark makes it easy to build and run Spark applications on Amazon Redshift and Redshift Serverless, opening up the data warehouse for a broader set of AWS analytics and machine learning solutions.
  • AWS Backup now supports Amazon Redshift. AWS Backup allows you to define a central backup policy to manage data protection of your applications and can also protect your Amazon Redshift clusters. In this way, you have a consistent experience when managing data protection across all supported services.

Availability and Pricing
Multi-AZ deployments, central access control for data sharing with AWS Lake Formation, auto-copy from Amazon S3, and dynamic data masking are available in preview in US East (Ohio), US East (N. Virginia), US West (Oregon), Asia Pacific (Tokyo), Europe (Ireland), and Europe (Stockholm).

There is no additional cost for using auto-copy from Amazon S3 and near real-time analytics on transactional data. There is no extra charge for dynamic data masking and central access control for data sharing. For more information, see Amazon Redshift pricing.

These new capabilities take you one step further in analyzing all your data across data sources with simple data ingestion capabilities, while improving the security and reliability of your data warehouse.

Danilo

Amazon Redshift ML Is Now Generally Available – Use SQL to Create Machine Learning Models and Make Predictions from Your Data

With Amazon Redshift, you can use SQL to query and combine exabytes of structured and semi-structured data across your data warehouse, operational databases, and data lake. Now that AQUA (Advanced Query Accelerator) is generally available, you can improve the performance of your queries by up to 10 times with no additional costs and no code changes. In fact, Amazon Redshift provides up to three times better price/performance than other cloud data warehouses.

But what if you want to go a step further and process this data to train machine learning (ML) models and use these models to generate insights from data in your warehouse? For example, to implement use cases such as forecasting revenue, predicting customer churn, and detecting anomalies? In the past, you would need to export the training data from Amazon Redshift to an Amazon Simple Storage Service (Amazon S3) bucket, and then configure and start a machine learning training process (for example, using Amazon SageMaker). This process required many different skills and usually more than one person to complete. Can we make it easier?

Today, Amazon Redshift ML is generally available to help you create, train, and deploy machine learning models directly from your Amazon Redshift cluster. To create a machine learning model, you use a simple SQL query to specify the data you want to use to train your model, and the output value you want to predict. For example, to create a model that predicts the success rate for your marketing activities, you define your inputs by selecting the columns (in one or more tables) that include customer profiles and results from previous marketing campaigns, and the output column you want to predict. In this example, the output column could be one that shows whether a customer has shown interest in a campaign.

After you run the SQL command to create the model, Redshift ML securely exports the specified data from Amazon Redshift to your S3 bucket and calls Amazon SageMaker Autopilot to prepare the data (pre-processing and feature engineering), select the appropriate pre-built algorithm, and apply the algorithm for model training. You can optionally specify the algorithm to use, for example XGBoost.
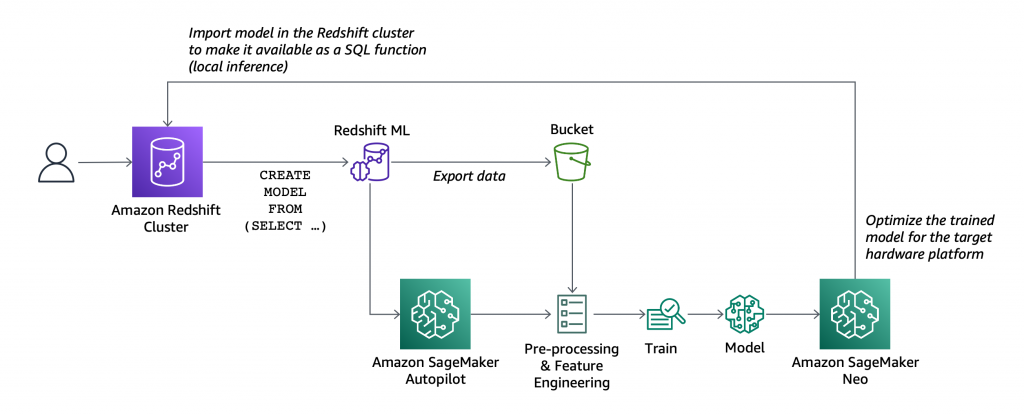
Architectural diagram.

Redshift ML handles all of the interactions between Amazon Redshift, S3, and SageMaker, including all the steps involved in training and compilation. When the model has been trained, Redshift ML uses Amazon SageMaker Neo to optimize the model for deployment and makes it available as a SQL function. You can use the SQL function to apply the machine learning model to your data in queries, reports, and dashboards.

Redshift ML now includes many new features that were not available during the preview, including Amazon Virtual Private Cloud (VPC) support. For example:
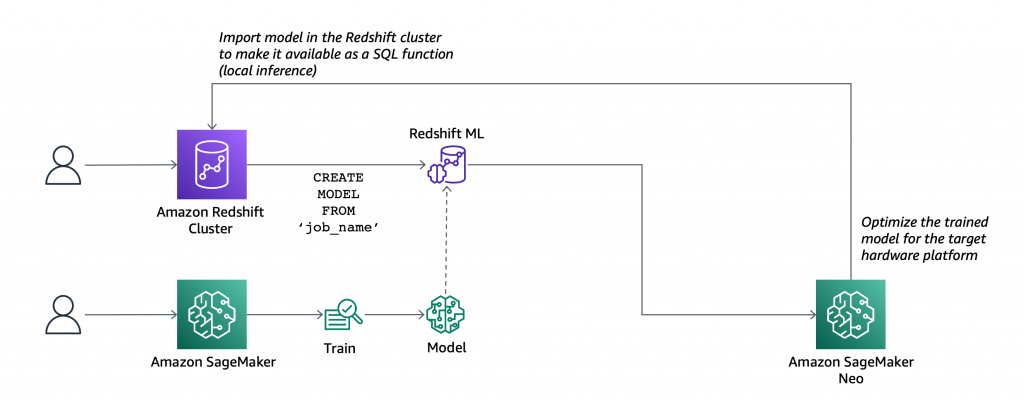
Architectural diagram.

  • You can also create SQL functions that use existing SageMaker endpoints to make predictions (remote inference). In this case, Redshift ML is batching calls to the endpoint to speed up processing.

Before looking into how to use these new capabilities in practice, let’s see the difference between Redshift ML and similar features in AWS databases and analytics services.

ML Feature Data Training
from SQL
Predictions
using SQL Functions
Amazon Redshift ML

Data warehouse

Federated relational databases

S3 data lake (with Redshift Spectrum)

Yes, using
Amazon SageMaker Autopilot
Yes, a model can be imported and executed inside the Amazon Redshift cluster, or invoked using a SageMaker endpoint.
Amazon Aurora ML Relational database
(compatible with MySQL or PostgreSQL)
No

Yes, using a SageMaker endpoint.

A native integration with Amazon Comprehend for sentiment analysis is also available.

Amazon Athena ML

S3 data lake

Other data sources can be used through Athena Federated Query.

No Yes, using a SageMaker endpoint.

Building a Machine Learning Model with Redshift ML
Let’s build a model that predicts if customers will accept or decline a marketing offer.

To manage the interactions with S3 and SageMaker, Redshift ML needs permissions to access those resources. I create an AWS Identity and Access Management (IAM) role as described in the documentation. I use RedshiftML for the role name. Note that the trust policy of the role allows both Amazon Redshift and SageMaker to assume the role to interact with other AWS services.

From the Amazon Redshift console, I create a cluster. In the cluster permissions, I associate the RedshiftML IAM role. When the cluster is available, I load the same dataset used in this super interesting blog post that my colleague Julien wrote when SageMaker Autopilot was announced.

The file I am using (bank-additional-full.csv) is in CSV format. Each line describes a direct marketing activity with a customer. The last column (y) describes the outcome of the activity (if the customer subscribed to a service that was marketed to them).

Here are the first few lines of the file. The first line contains the headers.

age,job,marital,education,default,housing,loan,contact,month,day_of_week,duration,campaign,pdays,previous,poutcome,emp.var.rate,cons.price.idx,cons.conf.idx,euribor3m,nr.employed,y 56,housemaid,married,basic.4y,no,no,no,telephone,may,mon,261,1,999,0,nonexistent,1.1,93.994,-36.4,4.857,5191.0,no
57,services,married,high.school,unknown,no,no,telephone,may,mon,149,1,999,0,nonexistent,1.1,93.994,-36.4,4.857,5191.0,no
37,services,married,high.school,no,yes,no,telephone,may,mon,226,1,999,0,nonexistent,1.1,93.994,-36.4,4.857,5191.0,no
40,admin.,married,basic.6y,no,no,no,telephone,may,mon,151,1,999,0,nonexistent,1.1,93.994,-36.4,4.857,5191.0,no

I store the file in one of my S3 buckets. The S3 bucket is used to unload data and store SageMaker training artifacts.

Then, using the Amazon Redshift query editor in the console, I create a table to load the data.

CREATE TABLE direct_marketing (
	age DECIMAL NOT NULL, 
	job VARCHAR NOT NULL, 
	marital VARCHAR NOT NULL, 
	education VARCHAR NOT NULL, 
	credit_default VARCHAR NOT NULL, 
	housing VARCHAR NOT NULL, 
	loan VARCHAR NOT NULL, 
	contact VARCHAR NOT NULL, 
	month VARCHAR NOT NULL, 
	day_of_week VARCHAR NOT NULL, 
	duration DECIMAL NOT NULL, 
	campaign DECIMAL NOT NULL, 
	pdays DECIMAL NOT NULL, 
	previous DECIMAL NOT NULL, 
	poutcome VARCHAR NOT NULL, 
	emp_var_rate DECIMAL NOT NULL, 
	cons_price_idx DECIMAL NOT NULL, 
	cons_conf_idx DECIMAL NOT NULL, 
	euribor3m DECIMAL NOT NULL, 
	nr_employed DECIMAL NOT NULL, 
	y BOOLEAN NOT NULL
);

I load the data into the table using the COPY command. I can use the same IAM role I created earlier (RedshiftML) because I am using the same S3 bucket to import and export the data.

COPY direct_marketing 
FROM 's3://my-bucket/direct_marketing/bank-additional-full.csv' 
DELIMITER ',' IGNOREHEADER 1
IAM_ROLE 'arn:aws:iam::123412341234:role/RedshiftML'
REGION 'us-east-1';

Now, I create the model straight form the SQL interface using the new CREATE MODEL statement:

CREATE MODEL direct_marketing
FROM direct_marketing
TARGET y
FUNCTION predict_direct_marketing
IAM_ROLE 'arn:aws:iam::123412341234:role/RedshiftML'
SETTINGS (
  S3_BUCKET 'my-bucket'
);

In this SQL command, I specify the parameters required to create the model:

  • FROM – I select all the rows in the direct_marketing table, but I can replace the name of the table with a nested query (see example below).
  • TARGET – This is the column that I want to predict (in this case, y).
  • FUNCTION – The name of the SQL function to make predictions.
  • IAM_ROLE – The IAM role assumed by Amazon Redshift and SageMaker to create, train, and deploy the model.
  • S3_BUCKET – The S3 bucket where the training data is temporarily stored, and where model artifacts are stored if you choose to retain a copy of them.

Here I am using a simple syntax for the CREATE MODEL statement. For more advanced users, other options are available, such as:

  • MODEL_TYPE – To use a specific model type for training, such as XGBoost or multilayer perceptron (MLP). If I don’t specify this parameter, SageMaker Autopilot selects the appropriate model class to use.
  • PROBLEM_TYPE – To define the type of problem to solve: regression, binary classification, or multiclass classification. If I don’t specify this parameter, the problem type is discovered during training, based on my data.
  • OBJECTIVE – The objective metric used to measure the quality of the model. This metric is optimized during training to provide the best estimate from data. If I don’t specify a metric, the default behavior is to use mean squared error (MSE) for regression, the F1 score for binary classification, and accuracy for multiclass classification. Other available options are F1Macro (to apply F1 scoring to multiclass classification) and area under the curve (AUC). More information on objective metrics is available in the SageMaker documentation.

Depending on the complexity of the model and the amount of data, it can take some time for the model to be available. I use the SHOW MODEL command to see when it is available:

SHOW MODEL direct_marketing

When I execute this command using the query editor in the console, I get the following output:
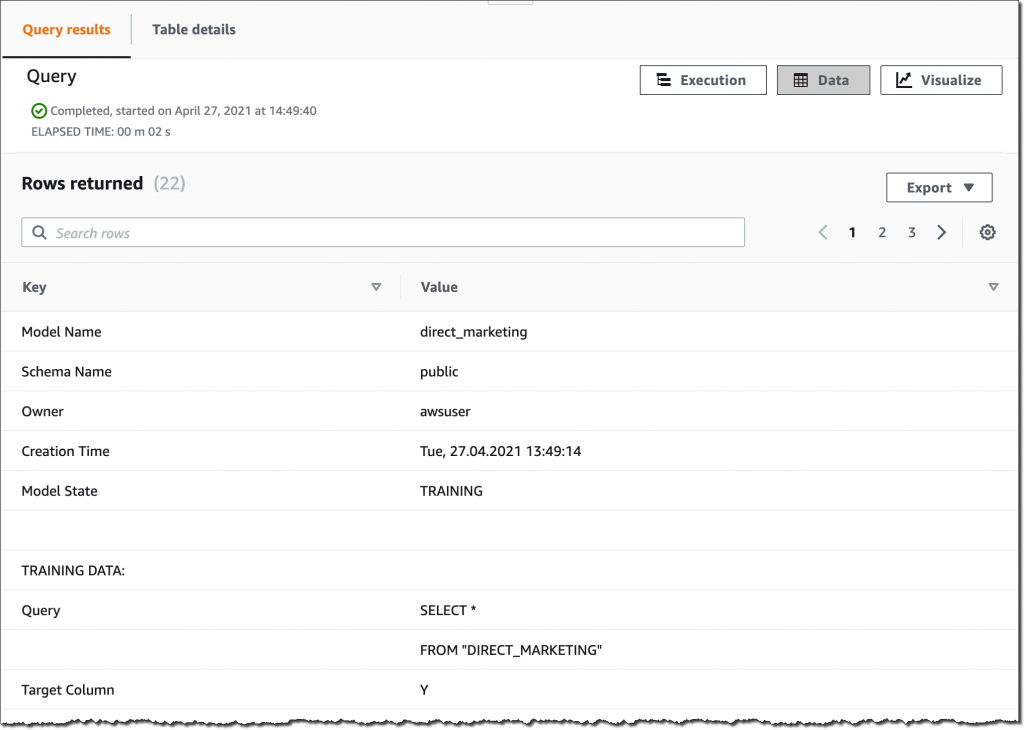
Console screenshot.

As expected, the model is currently in the TRAINING state.

When I created this model, I selected all the columns in the table as input parameters. I wonder what happens if I create a model that uses fewer input parameters? I am in the cloud and I am not slowed down by limited resources, so I create another model using a subset of the columns in the table:

CREATE MODEL simple_direct_marketing
FROM (
        SELECT age, job, marital, education, housing, contact, month, day_of_week, y
 	  FROM direct_marketing
)
TARGET y
FUNCTION predict_simple_direct_marketing
IAM_ROLE 'arn:aws:iam::123412341234:role/RedshiftML'
SETTINGS (
  S3_BUCKET 'my-bucket'
);

After some time, my first model is ready, and I get this output from SHOW MODEL. The actual output in the console is in multiple pages, I merged the results here to make it easier to follow:
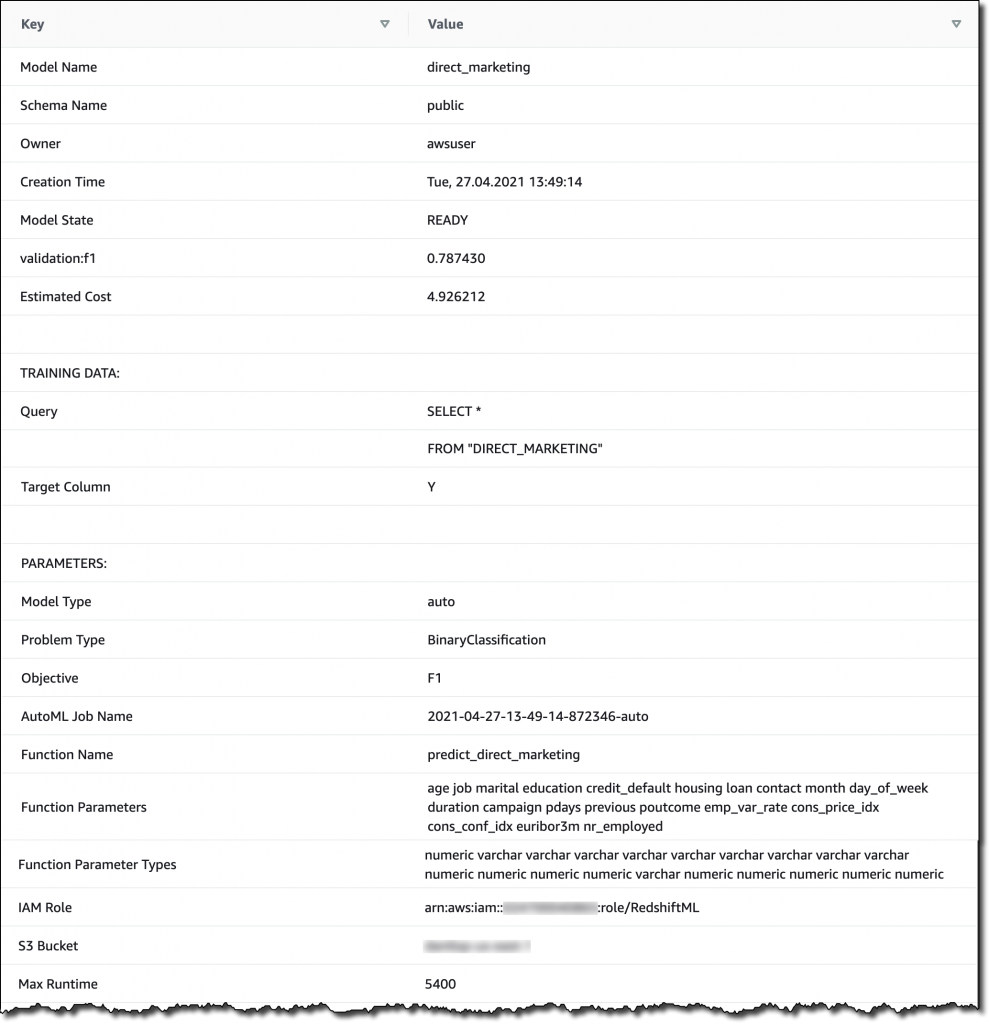
Console screenshot.

From the output, I see that the model has been correctly recognized as BinaryClassification, and F1 has been selected as the objective. The F1 score is a metrics that considers both precision and recall. It returns a value between 1 (perfect precision and recall) and 0 (lowest possible score). The final score for the model (validation:f1) is 0.79. In this table I also find the name of the SQL function (predict_direct_marketing) that has been created for the model, its parameters and their types, and an estimation of the training costs.

When the second model is ready, I compare the F1 scores. The F1 score of the second model is lower (0.66) than the first one. However, with fewer parameters the SQL function is easier to apply to new data. As is often the case with machine learning, I have to find the right balance between complexity and usability.

Using Redshift ML to Make Predictions
Now that the two models are ready, I can make predictions using SQL functions. Using the first model, I check how many false positives (wrong positive predictions) and false negatives (wrong negative predictions) I get when applying the model on the same data used for training:

SELECT predict_direct_marketing, y, COUNT(*)
  FROM (SELECT predict_direct_marketing(
                   age, job, marital, education, credit_default, housing,
                   loan, contact, month, day_of_week, duration, campaign,
                   pdays, previous, poutcome, emp_var_rate, cons_price_idx,
                   cons_conf_idx, euribor3m, nr_employed), y
          FROM direct_marketing)
 GROUP BY predict_direct_marketing, y;

The result of the query shows that the model is better at predicting negative rather than positive outcomes. In fact, even if the number of true negatives is much bigger than true positives, there are much more false positives than false negatives. I added some comments in green and red to the following screenshot to clarify the meaning of the results.
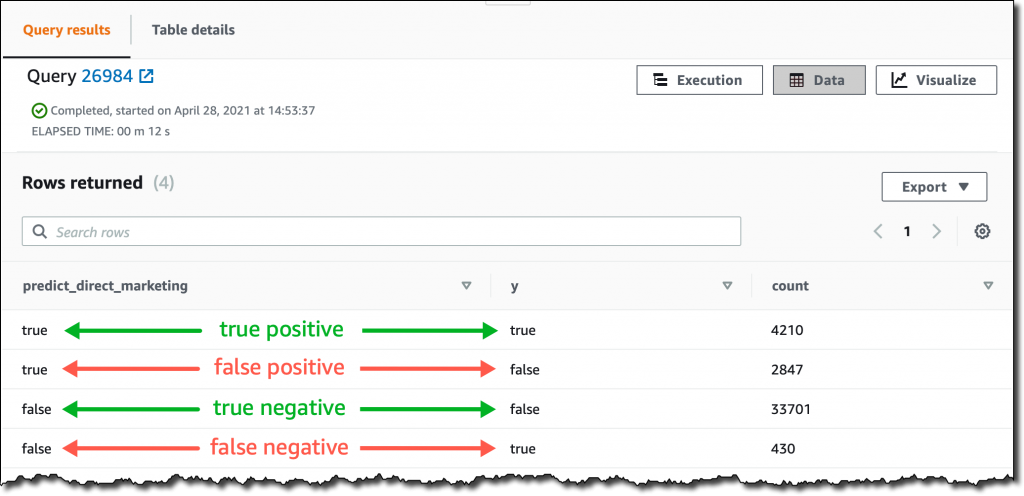
Console screenshot.

Using the second model, I see how many customers might be interested in a marketing campaign. Ideally, I should run this query on new customer data, not the same data I used for training.

SELECT COUNT(*)
  FROM direct_marketing
 WHERE predict_simple_direct_marketing(
           age, job, marital, education, housing,
           contact, month, day_of_week) = true;

Wow, looking at the results, there are more than 7,000 prospects!

Console screenshot.

Availability and Pricing
Redshift ML is available today in the following AWS Regions: US East (Ohio), US East (N Virginia), US West (Oregon), US West (San Francisco), Canada (Central), Europe (Frankfurt), Europe (Ireland), Europe (Paris), Europe (Stockholm), Asia Pacific (Hong Kong) Asia Pacific (Tokyo), Asia Pacific (Singapore), Asia Pacific (Sydney), and South America (São Paulo). For more information, see the AWS Regional Services list.

With Redshift ML, you pay only for what you use. When training a new model, you pay for the Amazon SageMaker Autopilot and S3 resources used by Redshift ML. When making predictions, there is no additional cost for models imported into your Amazon Redshift cluster, as in the example I used in this post.

Redshift ML also allows you to use existing Amazon SageMaker endpoints for inference. In that case, the usual SageMaker pricing for real-time inference applies. Here you can find a few tips on how to control your costs with Redshift ML.

To learn more, you can see this blog post from when Redshift ML was announced in preview and the documentation.

Start getting better insights from your data with Redshift ML.

Danilo
Introducing Amazon Kinesis Data Analytics Studio – Quickly Interact with Streaming Data Using SQL, Python, or Scala

The best way to get timely insights and react quickly to new information you receive from your business and your applications is to analyze streaming data. This is data that must usually be processed sequentially and incrementally on a record-by-record basis or over sliding time windows, and can be used for a variety of analytics including correlations, aggregations, filtering, and sampling.

To make it easier to analyze streaming data, today we are pleased to introduce Amazon Kinesis Data Analytics Studio.

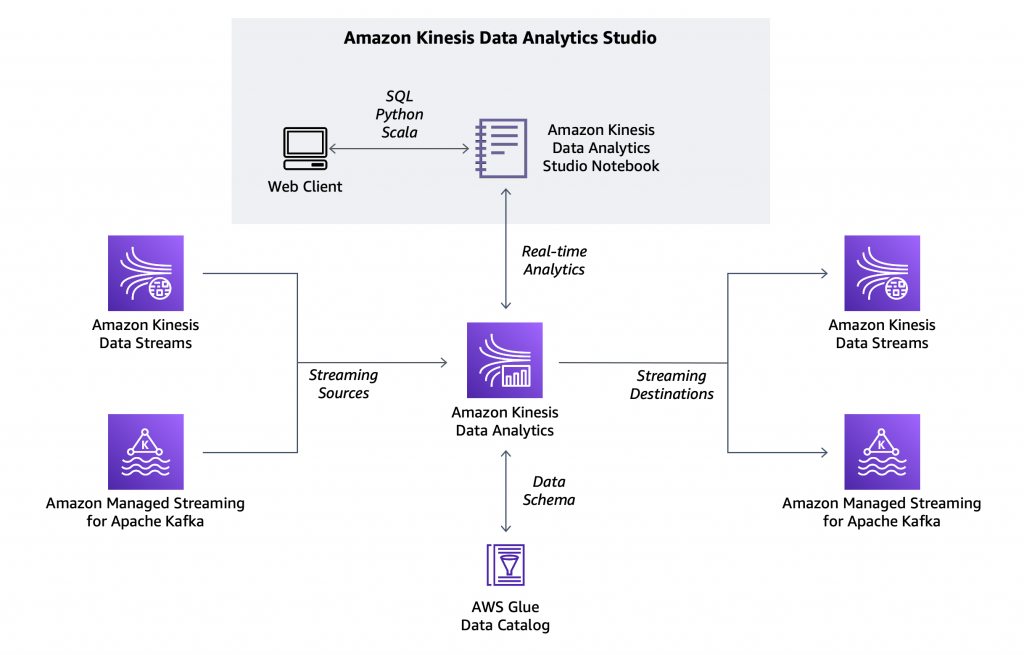
Now, from the Amazon Kinesis console you can select a Kinesis data stream and with a single click start a Kinesis Data Analytics Studio notebook powered by Apache Zeppelin and Apache Flink to interactively analyze data in the stream. Similarly, you can select a cluster in the Amazon Managed Streaming for Apache Kafka console to start a notebook to analyze data in Apache Kafka streams. You can also start a notebook from the Kinesis Data Analytics Studio console and connect to custom sources.

Architectural diagram.

In the notebook, you can interact with streaming data and get results in seconds using SQL queries and Python or Scala programs. When you are satisfied with your results, with a few clicks you can promote your code to a production stream processing application that runs reliably at scale with no additional development effort.

For new projects, we recommend that you use the new Kinesis Data Analytics Studio over Kinesis Data Analytics for SQL Applications. Kinesis Data Analytics Studio combines ease of use with advanced analytical capabilities, which makes it possible to build sophisticated stream processing applications in minutes. Let’s see how that works in practice.

Using Kinesis Data Analytics Studio to Analyze Streaming Data
I want to get a better understanding of the data sent by some sensors to a Kinesis data stream.

To simulate the workload, I use this random_data_generator.py Python script. You don’t need to know Python to use Kinesis Data Analytics Studio. In fact, I am going to use SQL in the following steps. Also, you can avoid any coding and use the Amazon Kinesis Data Generator user interface (UI) to send test data to Kinesis Data Streams or Kinesis Data Firehose. I am using a Python script to have finer control over the data that is being sent.

import datetime
import json
import random
import boto3

STREAM_NAME = "my-input-stream"


def get_random_data():
    current_temperature = round(10 + random.random() * 170, 2)
    if current_temperature > 160:
        status = "ERROR"
    elif current_temperature > 140 or random.randrange(1, 100) > 80:
        status = random.choice(["WARNING","ERROR"])
    else:
        status = "OK"
    return {
        'sensor_id': random.randrange(1, 100),
        'current_temperature': current_temperature,
        'status': status,
        'event_time': datetime.datetime.now().isoformat()
    }


def send_data(stream_name, kinesis_client):
    while True:
        data = get_random_data()
        partition_key = str(data["sensor_id"])
        print(data)
        kinesis_client.put_record(
            StreamName=stream_name,
            Data=json.dumps(data),
            PartitionKey=partition_key)


if __name__ == '__main__':
    kinesis_client = boto3.client('kinesis')
    send_data(STREAM_NAME, kinesis_client)

This script sends random records to my Kinesis data stream using JSON syntax. For example:

{'sensor_id': 77, 'current_temperature': 93.11, 'status': 'OK', 'event_time': '2021-05-19T11:20:00.978328'}
{'sensor_id': 47, 'current_temperature': 168.32, 'status': 'ERROR', 'event_time': '2021-05-19T11:20:01.110236'}
{'sensor_id': 9, 'current_temperature': 140.93, 'status': 'WARNING', 'event_time': '2021-05-19T11:20:01.243881'}
{'sensor_id': 27, 'current_temperature': 130.41, 'status': 'OK', 'event_time': '2021-05-19T11:20:01.371191'}

From the Kinesis console, I select a Kinesis data stream (my-input-stream) and choose Process data in real time from the Process drop-down. In this way, the stream is configured as a source for the notebook.

Console screenshot.

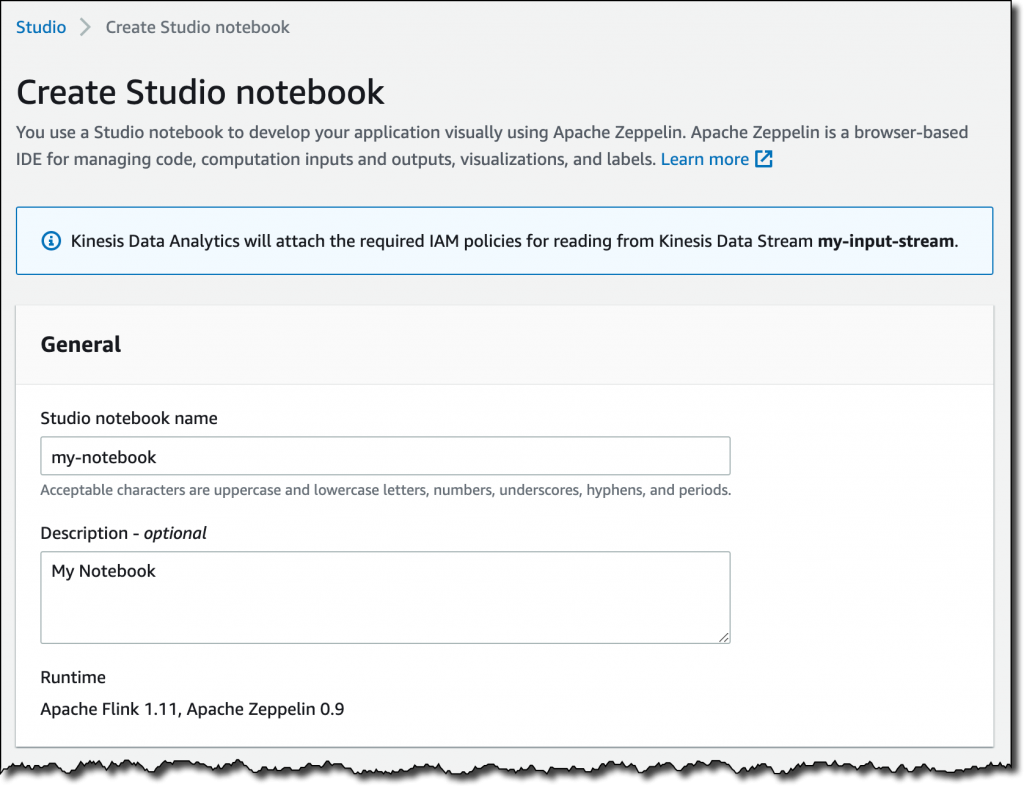
Then, in the following dialog box, I create an Apache Flink – Studio notebook.

I enter a name (my-notebook) and a description for the notebook. The AWS Identity and Access Management (IAM) permissions to read from the Kinesis data stream I selected earlier (my-input-stream) are automatically attached to the IAM role assumed by the notebook.

Console screenshot.

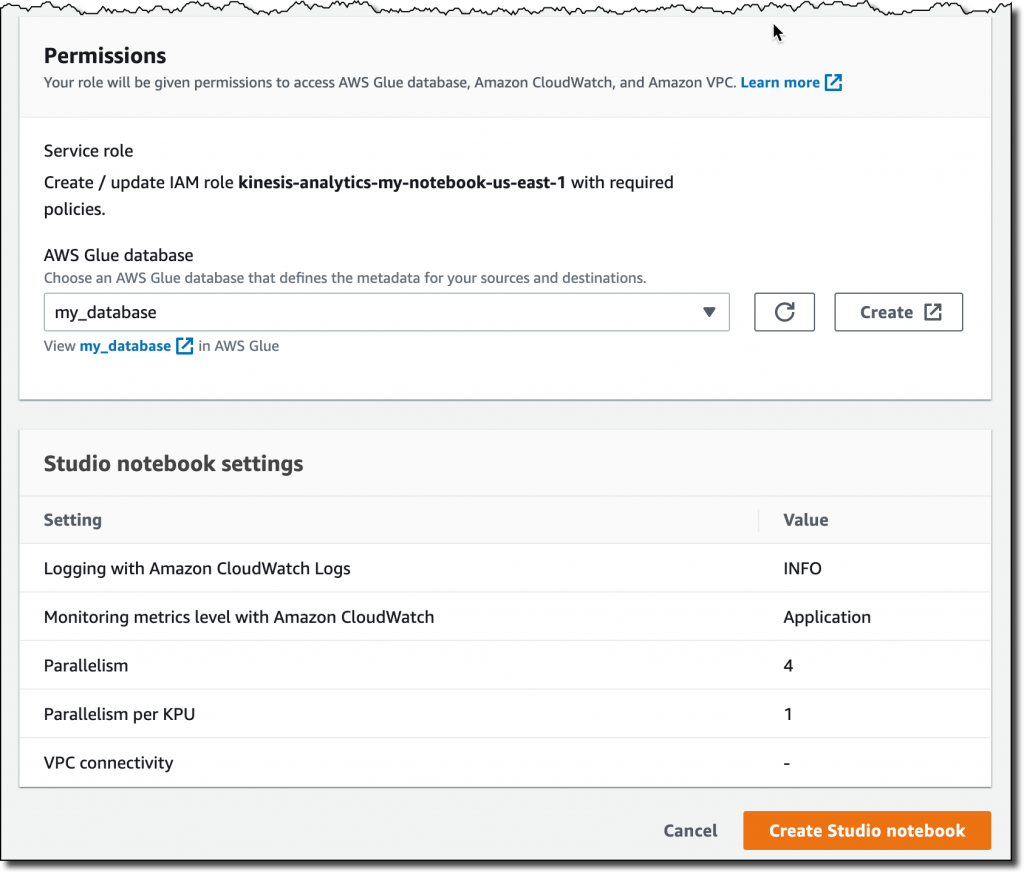
I choose Create to open the AWS Glue console and create an empty database. Back in the Kinesis Data Analytics Studio console, I refresh the list and select the new database. It will define the metadata for my sources and destinations. From here, I can also review the default Studio notebook settings. Then, I choose Create Studio notebook.

Console screenshot.

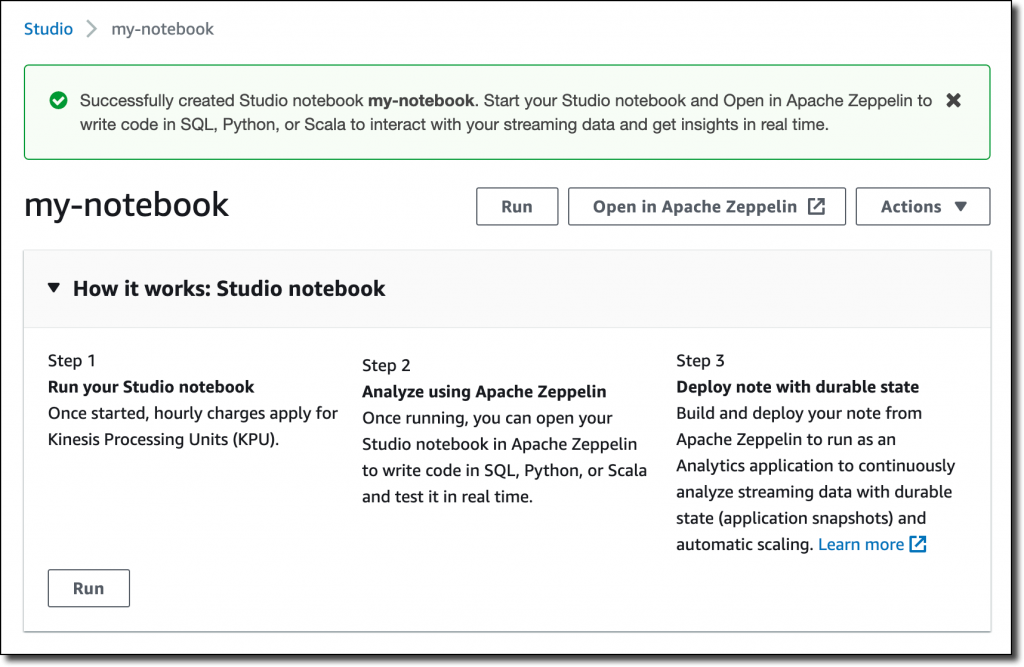
Now that the notebook has been created, I choose Run.

Console screenshot.

When the notebook is running, I choose Open in Apache Zeppelin to get access to the notebook and write code in SQL, Python, or Scala to interact with my streaming data and get insights in real time.

In the notebook, I create a new note and call it Sensors. Then, I create a sensor_data table describing the format of the data in the stream:

%flink.ssql

CREATE TABLE sensor_data (
    sensor_id INTEGER,
    current_temperature DOUBLE,
    status VARCHAR(6),
    event_time TIMESTAMP(3),
    WATERMARK FOR event_time AS event_time - INTERVAL '5' SECOND
)
PARTITIONED BY (sensor_id)
WITH (
    'connector' = 'kinesis',
    'stream' = 'my-input-stream',
    'aws.region' = 'us-east-1',
    'scan.stream.initpos' = 'LATEST',
    'format' = 'json',
    'json.timestamp-format.standard' = 'ISO-8601'
)

The first line in the previous command tells to Apache Zeppelin to provide a stream SQL environment (%flink.ssql) for the Apache Flink interpreter. I can also interact with the streaming data using a batch SQL environment (%flink.bsql), or Python (%flink.pyflink) or Scala (%flink) code.

The first part of the CREATE TABLE statement is familiar to anyone who has used SQL with a database. A table is created to store the sensor data in the stream. The WATERMARK option is used to measure progress in the event time, as described in the Event Time and Watermarks section of the Apache Flink documentation.

The second part of the CREATE TABLE statement describes the connector used to receive data in the table (for example, kinesis or kafka), the name of the stream, the AWS Region, the overall data format of the stream (such as json or csv), and the syntax used for timestamps (in this case, ISO 8601). I can also choose the starting position to process the stream, I am using LATEST to read the most recent data first.

When the table is ready, I find it in the AWS Glue Data Catalog database I selected when I created the notebook:

Console screenshot.

Now I can run SQL queries on the sensor_data table and use sliding or tumbling windows to get a better understanding of what is happening with my sensors.

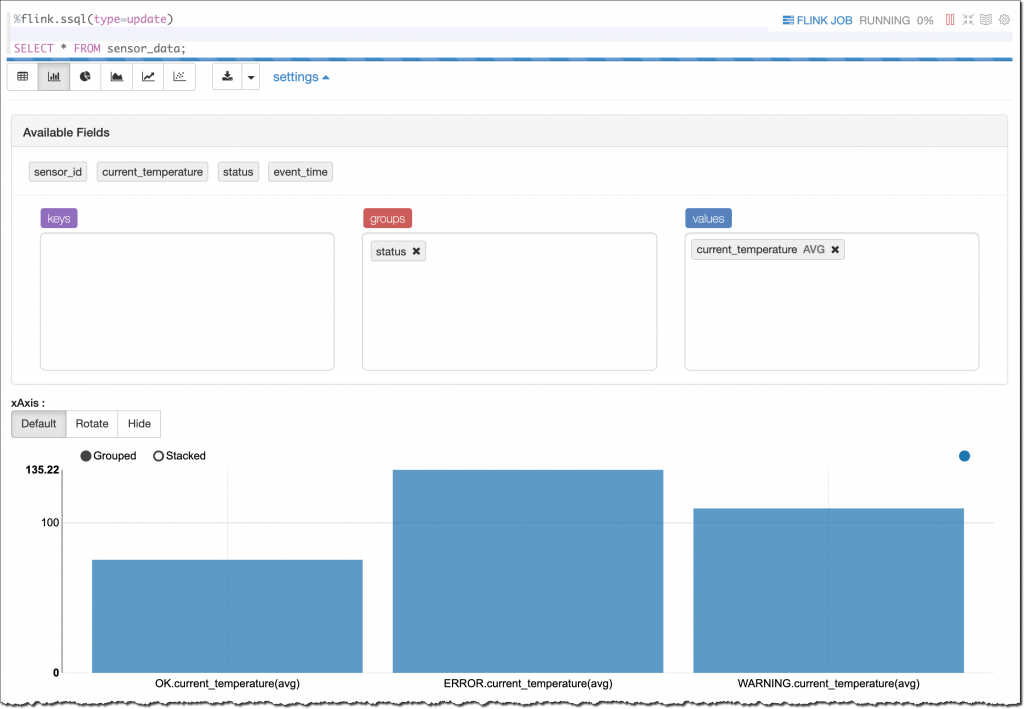
For an overview of the data in the stream, I start with a simple SELECT to get all the content of the sensor_data table:

%flink.ssql(type=update)

SELECT * FROM sensor_data;

This time the first line of the command has a parameter (type=update) so that the output of the SELECT, which is more than one row, is continuously updated when new data arrives.

On the terminal of my laptop, I start the random_data_generator.py script:

$ python3 random_data_generator.py

At first I see a table that contains the data as it comes. To get a better understanding, I select a bar graph view. Then, I group the results by status to see their average current_temperature, as shown here:

Notebook screenshot.

As expected by the way I am generating these results, I have different average temperatures depending on the status (OK, WARNING, or ERROR). The higher the temperature, the greater the probability that something is not working correctly with my sensors.

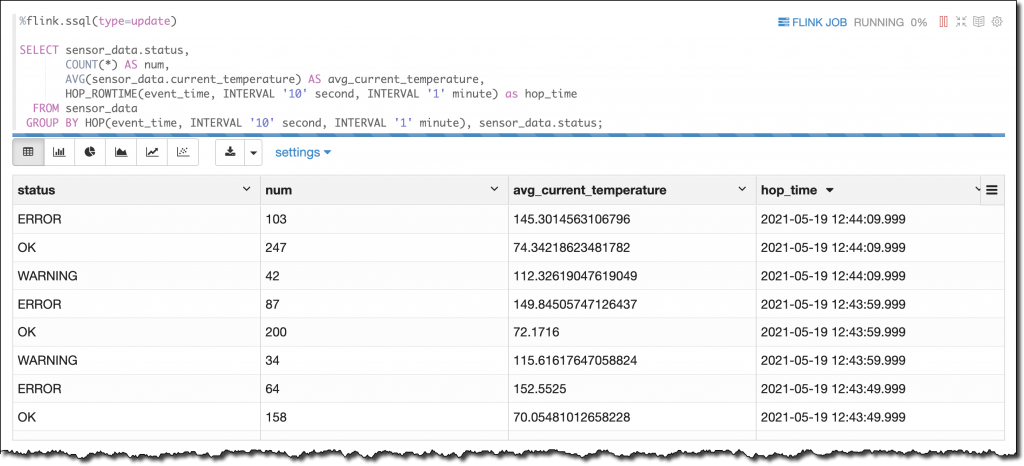
I can run the aggregated query explicitly using a SQL syntax. This time, I want the result computed on a sliding window of 1 minute with results updated every 10 seconds. To do so, I am using the HOP function in the GROUP BY section of the SELECT statement. To add the time to the output of the select, I use the HOP_ROWTIME function. For more information, see how group window aggregations work in the Apache Flink documentation.

%flink.ssql(type=update)

SELECT sensor_data.status,
       COUNT(*) AS num,
       AVG(sensor_data.current_temperature) AS avg_current_temperature,
       HOP_ROWTIME(event_time, INTERVAL '10' second, INTERVAL '1' minute) as hop_time
  FROM sensor_data
 GROUP BY HOP(event_time, INTERVAL '10' second, INTERVAL '1' minute), sensor_data.status;

This time, I look at the results in table format:

Notebook screenshot.

To send the result of the query to a destination stream, I create a table and connect the table to the stream. First, I need to give permissions to the notebook to write into the stream.

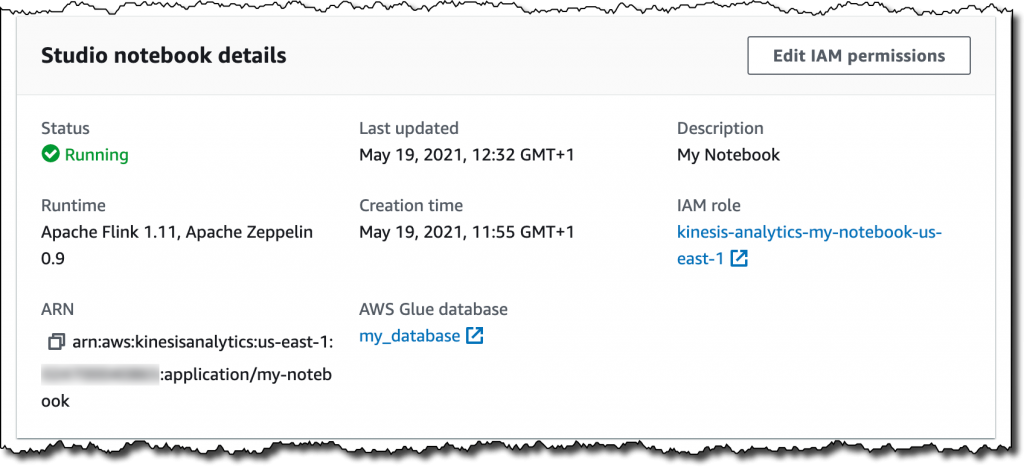
In the Kinesis Data Analytics Studio console, I select my-notebook. Then, in the Studio notebooks details section, I choose Edit IAM permissions. Here, I can configure the sources and destinations used by the notebook and the IAM role permissions are updated automatically.

Console screenshot.

In the Included destinations in IAM policy section, I choose the destination and select my-output-stream. I save changes and wait for the notebook to be updated. I am now ready to use the destination stream.

In the notebook, I create a sensor_state table connected to my-output-stream.

%flink.ssql

CREATE TABLE sensor_state (
    status VARCHAR(6),
    num INTEGER,
    avg_current_temperature DOUBLE,
    hop_time TIMESTAMP(3)
)
WITH (
'connector' = 'kinesis',
'stream' = 'my-output-stream',
'aws.region' = 'us-east-1',
'scan.stream.initpos' = 'LATEST',
'format' = 'json',
'json.timestamp-format.standard' = 'ISO-8601');

I now use this INSERT INTO statement to continuously insert the result of the select into the sensor_state table.

%flink.ssql(type=update)

INSERT INTO sensor_state
SELECT sensor_data.status,
    COUNT(*) AS num,
    AVG(sensor_data.current_temperature) AS avg_current_temperature,
    HOP_ROWTIME(event_time, INTERVAL '10' second, INTERVAL '1' minute) as hop_time
FROM sensor_data
GROUP BY HOP(event_time, INTERVAL '10' second, INTERVAL '1' minute), sensor_data.status;

The data is also sent to the destination Kinesis data stream (my-output-stream) so that it can be used by other applications. For example, the data in the destination stream can be used to update a real-time dashboard, or to monitor the behavior of my sensors after a software update.

I am satisfied with the result. I want to deploy this query and its output as a Kinesis Analytics application.

First, I create a SensorsApp note in my notebook and copy the statements that I want to execute as part of the application. The tables have already been created, so I just copy the INSERT INTO statement above.

Then, from the menu at the top right of my notebook, I choose Build SensorsApp and export to Amazon S3 and confirm the application name.

Notebook screenshot.

When the export is ready, I choose Deploy SensorsApp as Kinesis Analytics application in the same menu. After that, I fine-tune the configuration of the application. I set parallelism to 1 because I have only one shard in my input Kinesis data stream and not a lot of traffic. Then, I run the application, without having to write any code.

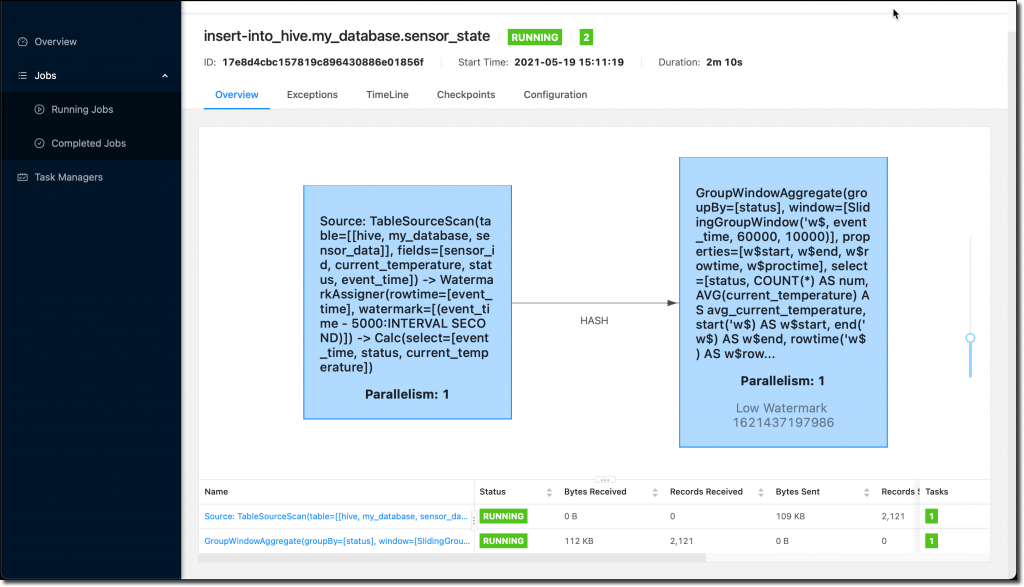
From the Kinesis Data Analytics applications console, I choose Open Apache Flink dashboard to get more information about the execution of my application.

Apache Flink console screenshot.

Availability and Pricing
You can use Amazon Kinesis Data Analytics Studio today in all AWS Regions where Kinesis Data Analytics is generally available. For more information, see the AWS Regional Services List.

In Kinesis Data Analytics Studio, we run the open-source versions of Apache Zeppelin and Apache Flink, and we contribute changes upstream. For example, we have contributed bug fixes for Apache Zeppelin, and we have contributed to AWS connectors for Apache Flink, such as those for Kinesis Data Streams and Kinesis Data Firehose. Also, we are working with the Apache Flink community to contribute availability improvements, including automatic classification of errors at runtime to understand whether errors are in user code or in application infrastructure.

With Kinesis Data Analytics Studio, you pay based on the average number of Kinesis Processing Units (KPU) per hour, including those used by your running notebooks. One KPU comprises 1 vCPU of compute, 4 GB of memory, and associated networking. You also pay for running application storage and durable application storage. For more information, see the Kinesis Data Analytics pricing page.

Start using Kinesis Data Analytics Studio today to get better insights from your streaming data.

Danilo
New Amazon FinSpace Simplifies Data Management and Analytics for Financial Services

Managing data is the core of the Financial Services Industry (FSI). I worked for private banking and fund management companies and helped analysts to collect, aggregate, and analyze hundreds of petabytes of data from internal data sources, such as portfolio management, order management, and accounting systems, but also from external data sources, such as real-time market feeds and historical equities pricing and alternative data systems. During that period, I spent my time trying to access data across organizational silos, to manage permissions, and to build systems to automate recurring tasks in ever-growing and more complex environments.
Today, we are launching a solution that would have reduced the time I spent on such projects: Amazon FinSpace is a data management and analytics solution purpose-built for the financial services industry. Amazon FinSpace reduces the time it takes to find and prepare data from months to minutes so analysts can spend more time on analysis.

What Our Customers Told Us
Before data can be combined and analyzed, analysts spend weeks or months to find and access data across multiple departments, each specialized by market, instrument, or geography. In addition to this logical segregation, data is also physically isolated in different IT systems, file systems, or networks. Because access to data is strictly controlled by governance and policy, analysts must prepare and explain access requests to the compliance department. This is a very manual, ad-hoc process.

Once granted access, they often must perform computational logic (such as Bollinger Bands, Exponential Moving Average, or Average True Range) on larger and larger datasets to prepare data for analysis or to derive information out of the data. These computations often run on servers with constrained capacity, as they were not designed to handle the size of workloads in the modern financial world. Even server-side systems are struggling to scale up and keep up with the ever-growing size of the datasets they need to store and analyze.

How Amazon FinSpace Helps
Amazon FinSpace removes the undifferentiated heavy lifting required to store, prepare, manage, and audit access to data. It automates the steps involved in finding data and preparing it for analysis. Amazon FinSpace stores and organizes data using industry and internal data classification conventions. Analysts connect to the Amazon FinSpace web interface to search for data using familiar business terms (“S&P500,” “CAC40,” “private equity funds in euro”).

Analysts can prepare their chosen datasets using a built-in library of more than 100 specialized functions for time series data. They can use the integrated Jupyter notebooks to experiment with data, and parallelize these financial data transformations at the scale of the cloud in minutes. Finally, Amazon FinSpace provides a framework to manage data access and to audit who is accessing what data and when. It tracks usage of data and generates compliance and audit reports.

Amazon FinSpace also makes it easy to work on historical data. Let’s imagine I built a model to calculate credit risk. This model relies on interest rate and inflation rate. These two rates get updated frequently. The risk level associated with a customer is not the same today as it was a few months ago, when inflation and interest rates were different. When data analysts are looking at data as it is now and as it was in the past, they call it bitemporal modeling. Amazon FinSpace makes it easy to go back in time and to compare how models are evolving alongside multiple dimensions.

To show you how Amazon FinSpace works, let’s imagine I have a team of analysts and data scientists and I want to provide them a tool to search, prepare, and analyze data.

How to Create an Amazon FinSpace Environment
As an AWS account administrator, I create a working environment for my team of financial analysts. This is a one-time setup.

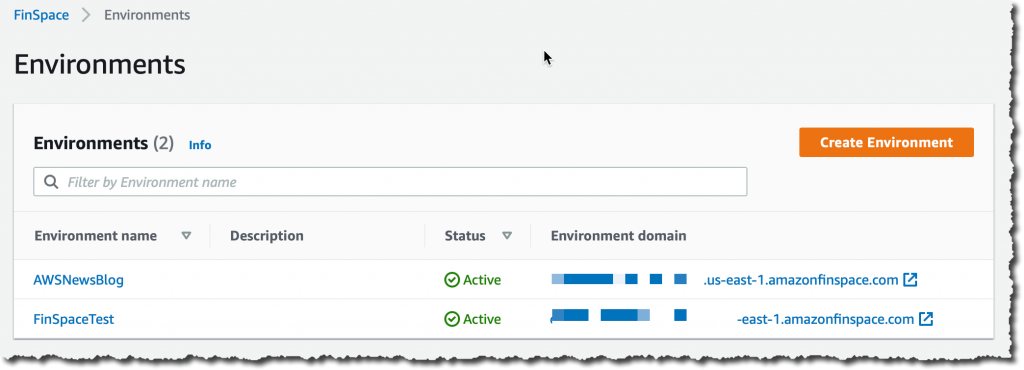
I navigate to the Amazon FinSpace console and click Create Environment:

FinSpace Create environment

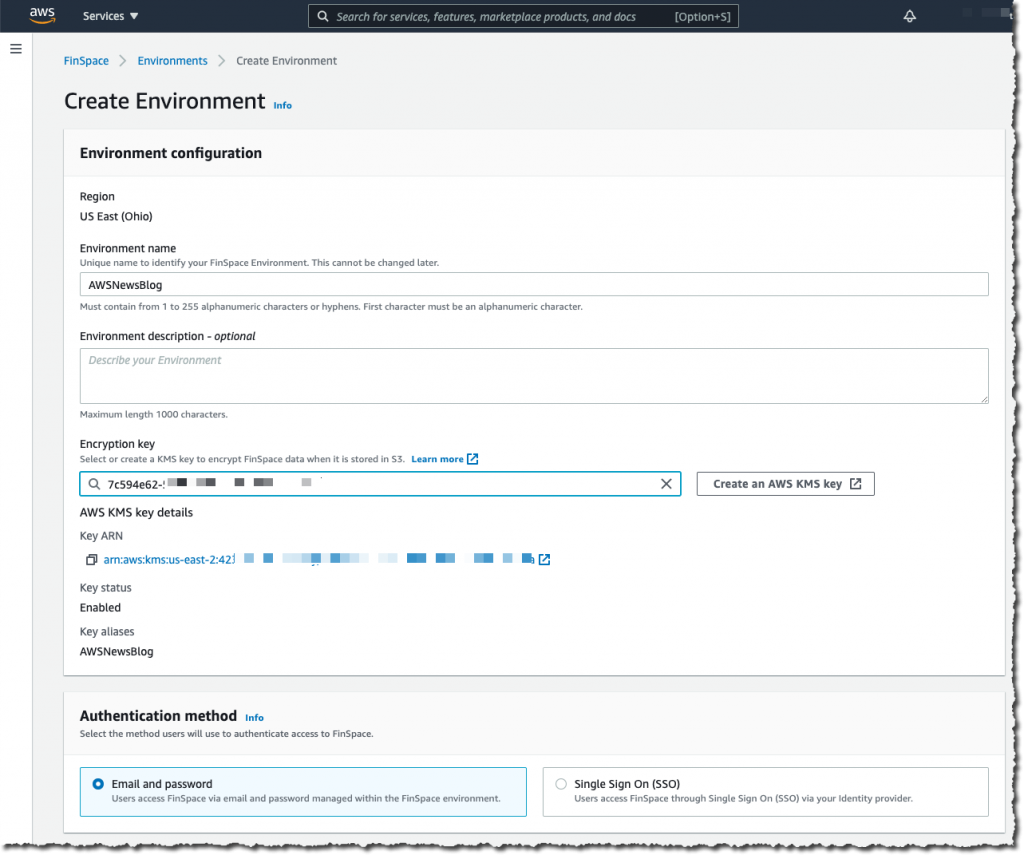
I give my environment a name. I select a KMS encryption key that will serve to encrypt data at rest. Then I choose either to integrate with AWS Single Sign-On or to manage usernames and passwords in Amazon FinSpace. AWS Single Sign-On integration allows your analysts to authenticate with external systems, such as a corporate Active Directory, to access the Amazon FinSpace environment. For this example, I choose to manage the credentials by myself.

FinSpace create environment details

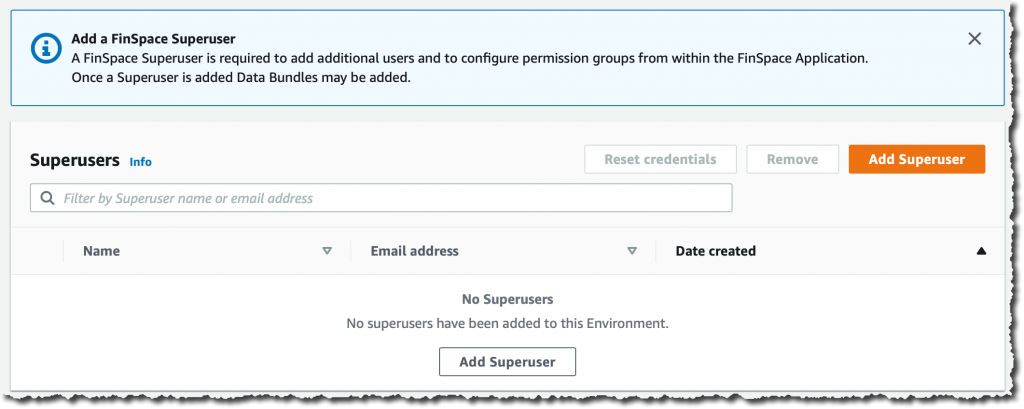
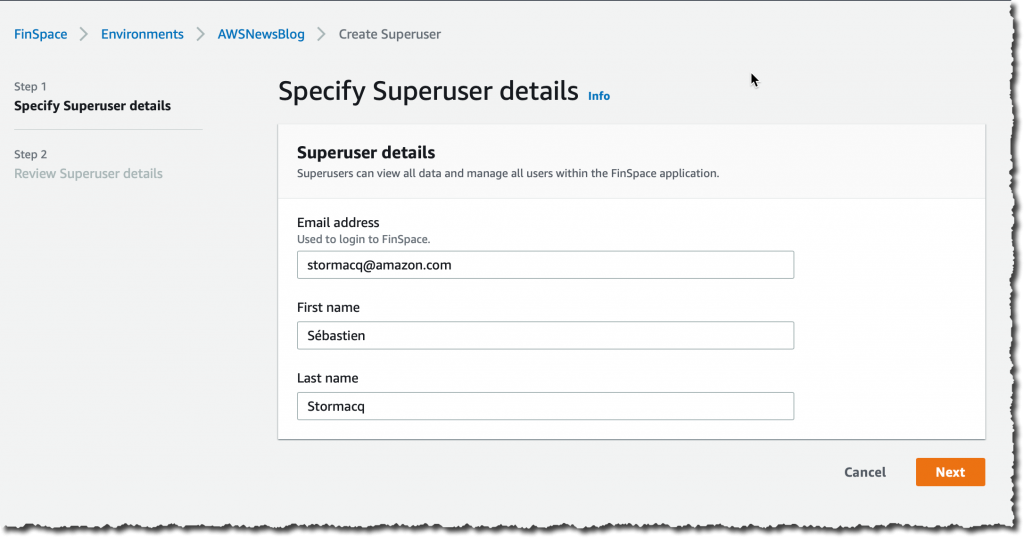
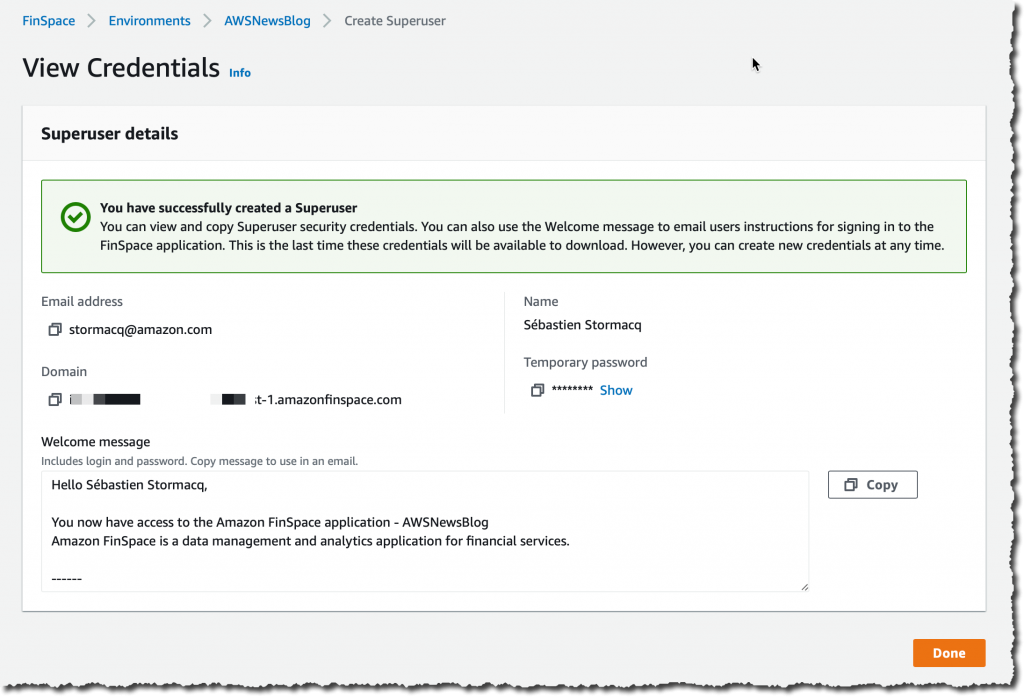
I create a superuser who will have administration permission on the Amazon FinSpace environment. I click Add Superuser:

Finspace create super user 1Finspace create super user 2I take a note of the temporary password. I copy the text of the message to send to my superuser. This message includes the connection instructions for the initial connection to the environment.

The superuser has permission to add other users and to manage these users’ permissions in the Amazon FinSpace environment itself.

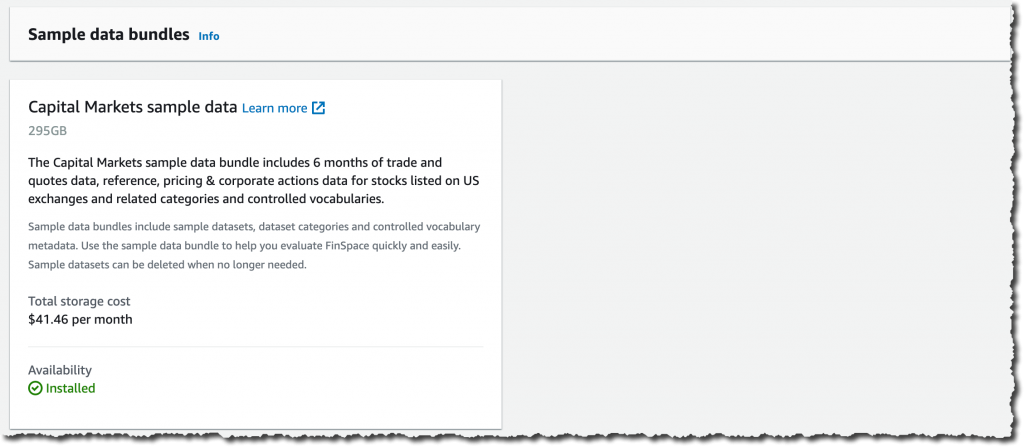
Finally, and just for the purpose of this demo, I choose to import an initial dataset. This allows me to start with some data in the environment. Doing so is just a single click in the console. The storage cost of this dataset is $41.46 / month and I can delete it at any time.

Under Sample data bundles, Capital Markets sample data, I click Install dataset. This can take several minutes, so it’s a good time to stand up, stretch your legs, and grab a cup of coffee.

FinSpace install sample dataset

How to Use an Amazon FinSpace Environment
In my role as financial analyst, my AWS account administrator sends me an email containing a URL to connect to my Amazon FinSpace Environment along with the related credentials. I connect to the Amazon FinSpace environment.

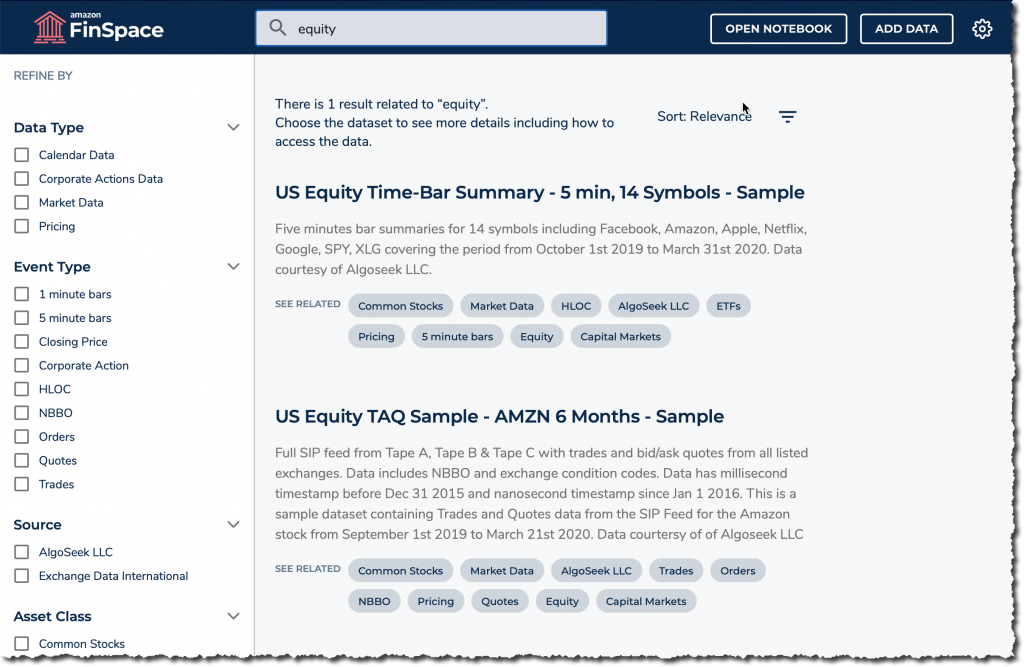
A couple of points are worth noting on the welcome page. First, on the top right side, I click the gear icon to access the environment settings. This is where I can add other users and manage their permissions. Second, you can browse the different data by categories on the left side, or search for specific terms by typing your search query on the search bar on top of the screen, and refine your search on the left side.

I can use Amazon FinSpace as my data hub. Data are fed through the API or I can load data directly from my workstation. I use tags to describe datasets. Datasets are containers for data; changes are versioned and I can create historical views of data or use the auto-updating data view that Amazon FinSpace maintains for me.

For this demo, let’s imagine I received a request from a portfolio manager who wants a chart showing realized volatility using 5 minute time bars for AMZN stock. Let me show you how I use the search bar to locate data and then use a notebook to analyze that data.

First, I search my dataset for stock price time bar summary, with 5 min intervals. I type “equity” in the search box. I’m lucky: The first result is the one I want. If needed, I could have refined the results using the facets on the left.

finspace search equity

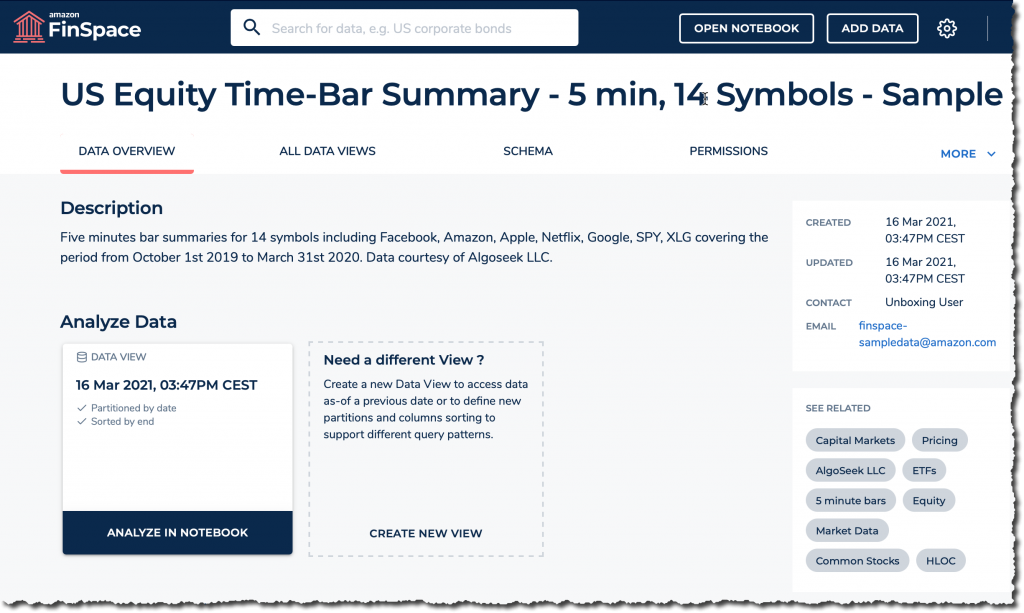
Once I find the dataset, I explore its description, the schema, and other information. Based on these, I decide if this is the correct dataset to answer my portfolio manager’s request.

finspace dataset details


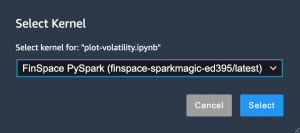
I click Analyze in notebook to start a Jupyter notebook where I’ll be able to further explore the data with PySpark. Once the notebook is open, I first check it is correctly configured to use the Amazon FinSpace PySpark kernel (starting the kernel takes 5-8 minutes).

Finspace select kernel

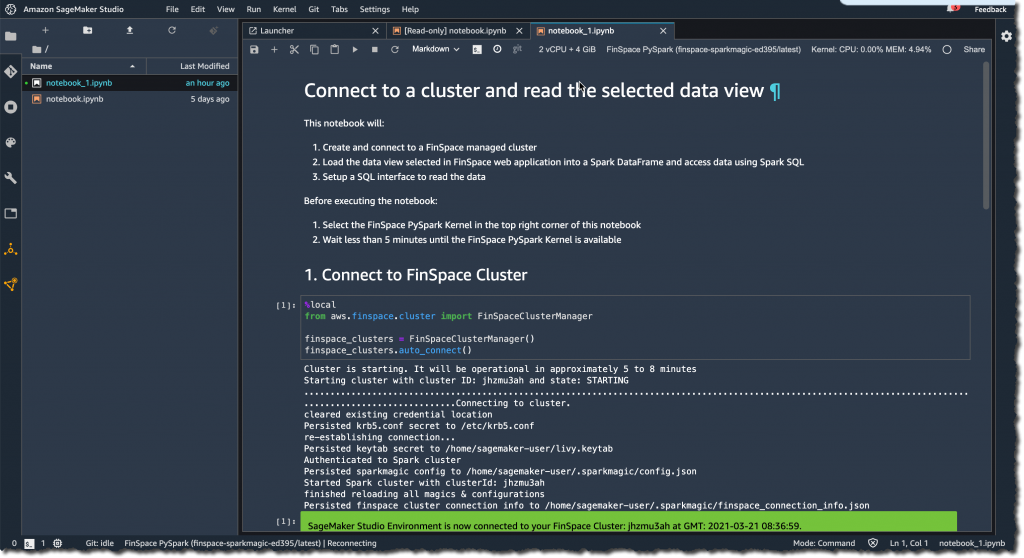
I click “play” on the first code box to connect to the Spark cluster.

finspace connect to cluster

To analyze my dataset and answer the specific question from my PM, I need to type a bit of PySpark code. For the purpose of this demo, I am using sample code from the Amazon FinSpace GitHub repository. You can upload the Notebook to your environment. Click the up arrow as shown on the top left of the screen above to select the file from your local machine.

This notebook pulls data from the Amazon FinSpace catalog “US Equity Time-Bar Summary” data I found earlier, and then uses the Amazon FinSpace built-in analytic function realized_volatility() to compute realized volatility for a group of tickers and exchange event types.

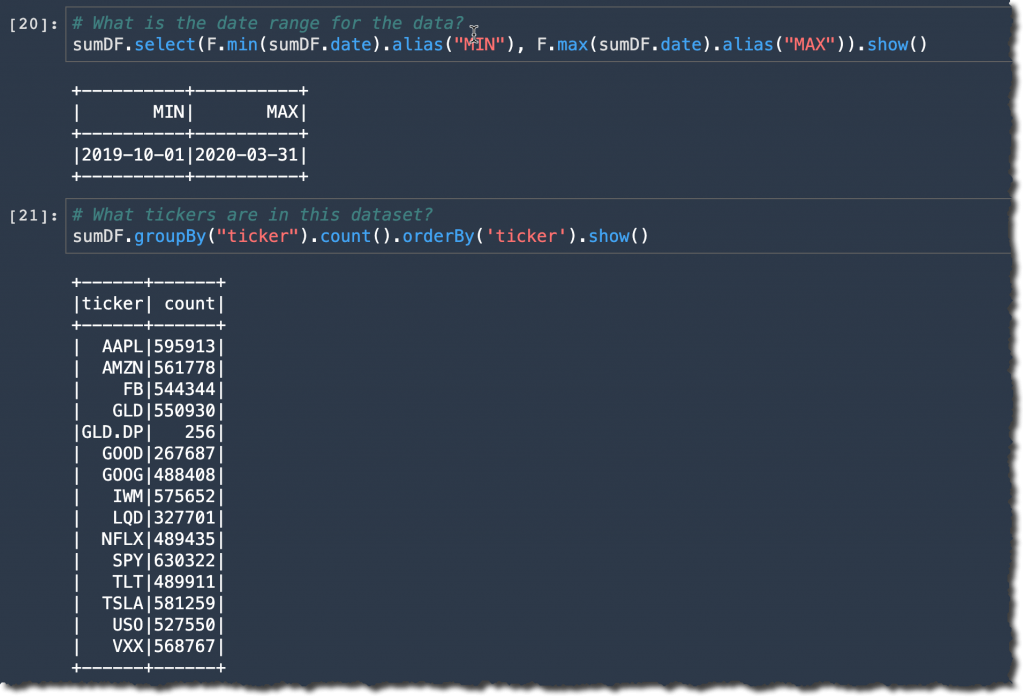
Before creating any graph, let’s have a sense of the dataset. What is the time range of the data ? What tickers are in this dataset ? I answer these questions with simple select() or groupby() functions provided by Amazon FinSpace. I prepare my FinSpaceAnalyticsAnalyser class with the code below :

from aws.finspace.analytics import FinSpaceAnalyticsManager
finspace = FinSpaceAnalyticsManager(spark = spark, endpoint=hfs_endpoint)

sumDF = finspace.read_data_view(dataset_id = dataset_id, data_view_id = view_id)

Once done, I can start to explore the dataset:
finspace analysis 1

I can see there are 561778 AMZN trades and price quotes between Oct. 1, 2019 and March 31, 2020.

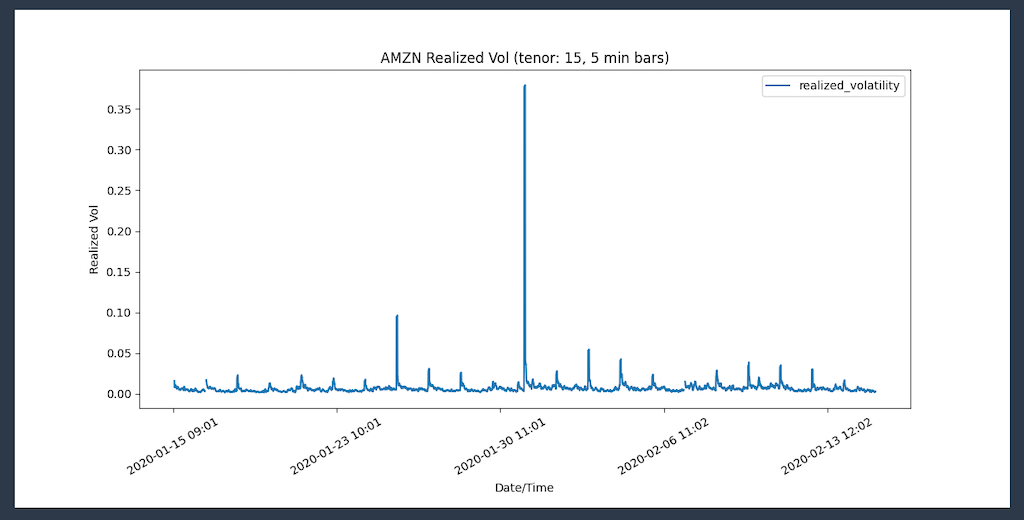
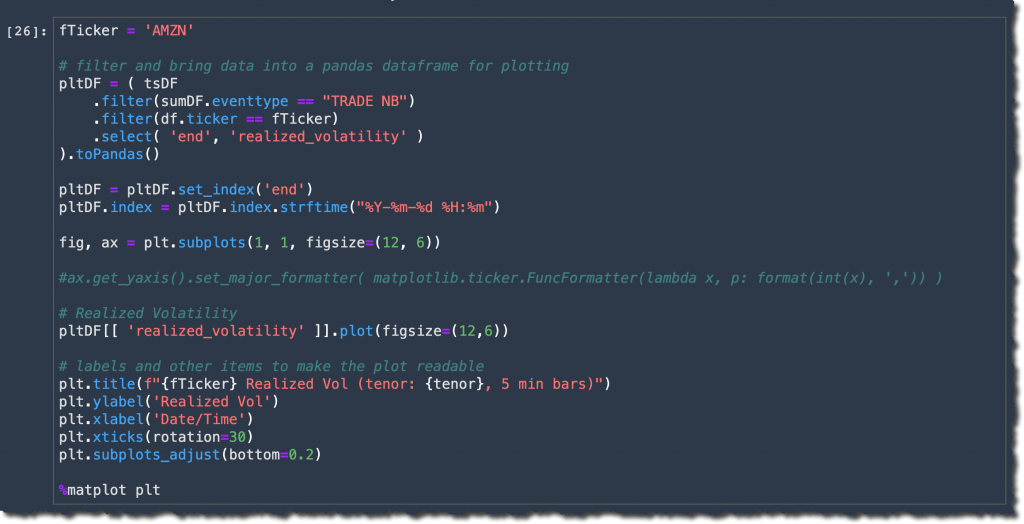
To plot the realized volatility, I use Panda to plot the values:

finspace plot realized volatility code

When I execute this code block, I receive:

finspace plot realized volatility graph


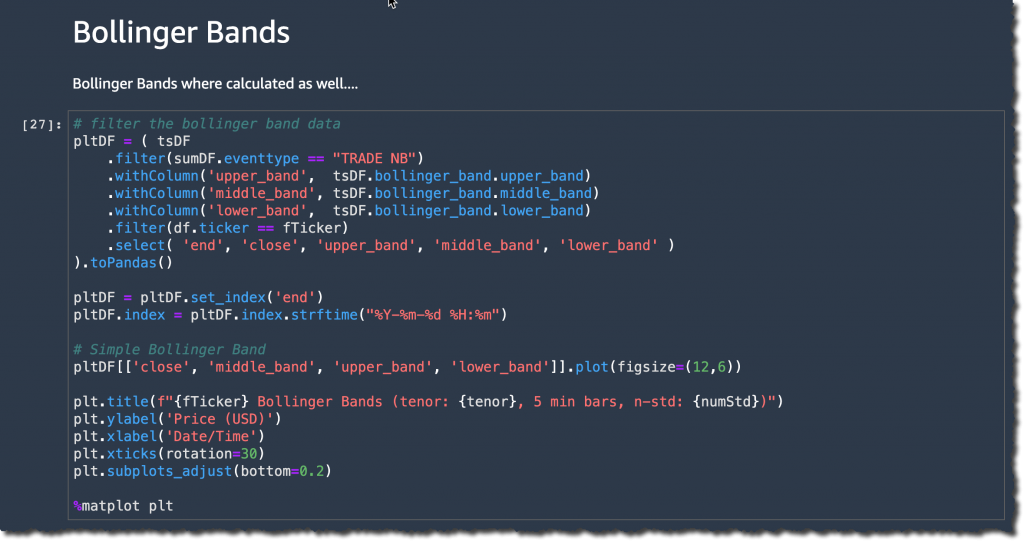
Similarly, I can start a Bollinger Bands analysis to check if the volatility spike created an oversold condition on the AMZN stock. I am also using Panda to plot the values.

finspace plot bollinger bandcode

and generate this graph:

finspace plot realized volatility bolinger graph


I am ready to answer the portfolio manager’s question. But why was there a spike on Jan 30 2020 ? The answer is in the news: “Amazon soars after huge earnings beat.” 🙂

Availability and Pricing
Amazon FinSpace is available today in US East (N. Virginia), US East (Ohio), US West (Oregon), Europe (Ireland), and Canada (Central).

As usual, we charge you only for the resources your project uses. Pricing is based on three dimensions: the number of analysts with access to the service, the volume of data ingested, and the compute hours used to apply your transformations. Detailed pricing information is available on the service pricing page.

Give it a try today and let us know your feedback.

— seb