
Retain the latest events of an event log by using compacted event hubs or Kafka topics in Azure Event Hubs.
Month: December 2022
General availability: Stream Analytics no-code editor updates in December 2022
New features are now available in Stream Analytics no-code editor GA including multiple parameter built-in functions support, Delta Lake format support in ADLS Gen2 output sink.
Public preview: Processor diagram in Physical Job Diagram for Stream Analytics job troubleshooting
The processor diagram in physical job diagram provides you further insights within the streaming nodes of your stream analytics jobs.
Google Workspace Updates Weekly Recap – December 9, 2022
New updates
Unless otherwise indicated, the features below are fully launched or in the process of rolling out (rollouts should take no more than 15 business days to complete), launching to both Rapid and Scheduled Release at the same time (if not, each stage of rollout should take no more than 15 business days to complete), and available to all Google Workspace and G Suite customers.
See collaborator avatars in the toolbar of apps on Android devices
In continuation of our efforts to improve the Google Workspace experience on large screen Android devices, we’re moving collaborator avatars from the overflow menu into the app toolbar at the top of your Android tablets and mobile devices.

Pin table headers when using pageless format on Google Docs
When your Google Doc is set to the pageless format, you can now pin one or more table rows as header rows. When you scroll vertically past the top of the table, the headers will remain visible at the top of the window until you scroll to the bottom of the table. | Learn more.

Easily share files in Google Meet chat on web
Currently, when you share the link to a Google Drive file in Meet chat, you have to ensure the document is shared with those on the call, either proactively or reactively, on a separate screen. Starting this week, when sharing a file in Meet chat, you will now be prompted to update the file sharing permissions to reflect which meeting attendees you’d like to have access to a particular file, all within Meet. | Roll out to Rapid Release and Scheduled Release domains began December 5, 2022 at an extended pace (potentially longer than 15 days for feature visibility). | Learn more.
Warning banners for external email recipients on iOS devices
Beginning today, you'll see a warning banner when adding external recipients to an email on iOS. These warnings are already available for Gmail on the web and Android devices. Note that admins can turn these specific warning labels on or off for their organization. | Roll out to Rapid Release and Scheduled Release domains began December 9, 2022 at an extended pace (potentially longer than 15 days for feature visibility).

Improvements for using Miro in Google Meet
We've made two enhancements for the Miro experience within Google Meet:
- Meeting participants will see a dialog invite instead of a chat message asking them to join a whiteboarding session.
- Meeting hosts now have the option to end collaboration for the group as a whole. Alternatively, meeting participants will have the ability to leave the session individually.
Previous announcements
The announcements below were published on the Workspace Updates blog earlier this week. Please refer to the original blog posts for complete details.
More ways to prevent data exfiltration on iOS devices
In 2020, we released several data exfiltration protections for iOS devices. Today, we’re announcing the next set of enhancements for data exfiltration protections for iOS. We’re expanding these security controls to give admins more ways to protect sensitive company data on iOS devices. | Available to Google Workspace Enterprise Standard, Enterprise Plus, Enterprise for Education, and Cloud Identity Premium customers only. | Learn more.
New default setting for content managers to modify shared drives coming in February 2023
Starting this week, admins will see a new shared drive setting that can be enabled or disabled to give content managers the ability to share folders in shared drives. In February 2023, all content managers will have the ability to share folders by default. If you’d like this feature to remain off for end users, disable the setting now. | Available to Google Workspace Essentials, Business Standard, Business Plus, Enterprise Essentials, Enterprise Standard, Enterprise Plus, Education Fundamentals, Education Plus, Education Standard, the Teaching and Learning Upgrade, and Nonprofits, as well as legacy G Suite Business customers only. | Learn more.
Create drop-down chips in Google Sheets
We’ve added dropdown chips in Google Sheets, a custom formatting feature that is already available in Docs. They also enable you to easily indicate statuses or various project milestones outlined in your Sheet. | Learn more.
Collaborate with colleagues in Google Slides through a new ‘Follow’ feature
We’re introducing a new ‘Follow’ feature that allows you to collaborate with colleagues in real-time on Google Slides. Simply, click on a collaborator’s avatar in the Slides toolbar to jump to whatever slide they are on, and continue to move with them as they navigate and make changes to a presentation. | Learn more.
Completed feature rollouts
The features below completed their rollouts to Rapid Release domains, Scheduled Release domains, or both in the past week. Please refer to the original blog post for additional details.
Rapid Release Domains:
-
Concentrate or disconnect with scheduled Do Not Disturb on Google Chat (Web)
-
The new Gmail user interface is becoming the standard experience
Rapid and Scheduled Release Domains:
-
Google for Education transformation reports window open for customers worldwide
-
Manage projects & tasks with a new timeline view on Google Sheets
-
[Weekly Recap] Use smart chips in Google Sheets as links on mobile
-
[Weekly Recap] Offline printing now available for Google Sheets
-
-
Use Key Migration to change or add key services for Client-side encryption
-
[Weekly Recap] Easily assign Tasks from Google Docs on mobile
-
Use Access Approvals to control data access during support or maintenance
-
-
Sharing suggestions in Google Drive make collaborating easier
-
[Weekly Recap] Improving drag & drop on the Google Drive Android app
-
[Weekly Recap] Drag content from Google Slides into other apps on Android
-
Concentrate or disconnect with scheduled Do Not Disturb on Google Chat (Mobile)
-
[Weekly Recap] Improved search results based on recent search activity in Gmail
-
For a recap of announcements in the past six months, check out What’s new in Google Workspace (recent releases).
Rapid Release Domains:
-
Concentrate or disconnect with scheduled Do Not Disturb on Google Chat (Web)
-
The new Gmail user interface is becoming the standard experience
Rapid and Scheduled Release Domains:
-
Google for Education transformation reports window open for customers worldwide
-
Manage projects & tasks with a new timeline view on Google Sheets
-
[Weekly Recap] Use smart chips in Google Sheets as links on mobile
-
[Weekly Recap] Offline printing now available for Google Sheets
-
Use Key Migration to change or add key services for Client-side encryption
-
[Weekly Recap] Easily assign Tasks from Google Docs on mobile
-
Use Access Approvals to control data access during support or maintenance
-
Sharing suggestions in Google Drive make collaborating easier
-
[Weekly Recap] Improving drag & drop on the Google Drive Android app
-
[Weekly Recap] Drag content from Google Slides into other apps on Android
-
Concentrate or disconnect with scheduled Do Not Disturb on Google Chat (Mobile)
-
[Weekly Recap] Improved search results based on recent search activity in Gmail
For a recap of announcements in the past six months, check out What’s new in Google Workspace (recent releases).
Collaborate with colleagues in Google Slides through a new ‘Follow’ feature
What’s changing
We’re introducing a new ‘Follow’ feature that allows you to collaborate with colleagues in real-time on Google Slides. Building upon the existing feature to see what slide your colleague is on, you can now click on a collaborator’s avatar in the Slides toolbar to jump to whatever slide they are on, and continue to move with them as they navigate and make changes to a presentation.

Getting started
- Admins: There is no admin control for this feature.
- End users: This feature will be ON by default. To follow a collaborator, click their avatar in the Slides toolbar. If you hover over a followed avatar, a “Following” badge will appear. To stop following a collaborator, click on their avatar again.
- You will also stop following the collaborator if:
- The collaborator refreshes or leaves the presentation.
- You make any edits to the presentation.
- You click a different slide.
- You enter Slideshow mode.
- Visit the Help Center to learn more about following a collaboration on Google Slides.
Rollout pace
- Rapid Release and Scheduled Release domains: Extended rollout (potentially longer than 15 days for feature visibility) starting on December 8, 2022
Availability
- Available to all Google Workspace customers, as well as legacy G Suite Basic and Business customers
- Available to users with personal Google Accounts
Resources
Create drop-down chips in Google Sheets
What’s changing
Today we’re adding dropdown chips in Google Sheets. This is the latest smart canvas feature highlighting the next evolution of collaboration for Google Workspace. Dropdown chips are a custom formatting feature that is already available in Docs, and they enable you to easily indicate statuses or various project milestones outlined in your Sheet.

Additionally, we’ve modified the workflow for creating and managing all data validation rules, including dropdown chips and checkboxes. You can now view and edit all existing rules that have been created in a specific Sheets tab and create additional rules from a new sidebar view. This update improves the consistency of your overall Sheets experience as this now mirrors the workflows for creating conditional formatting, protected ranges, and named ranges rules.

Getting started
- Admins: There is no admin control for this feature.
- End users: This feature will be ON by default. You can insert a dropdown chip by selecting Insert > Dropdown or by typing “@” followed by “dropdown”.Visit the Help Center to learn more about inserting smart chips in your Google Sheets.
Rollout pace
- Rapid Release domains: Gradual rollout (up to 15 days for feature visibility) starting on December 8, 2022
- Scheduled Release domains: Gradual rollout (up to 15 days for feature visibility) starting on December 22, 2022
Availability
- Available to all Google Workspace customers, as well as legacy G Suite Basic and Business customers
- Available to users with personal Google Accounts
Resources
- Google Help: Insert smart chips in your Google Sheets
- Google Workspace Updates Blog: Use new table templates and dropdown chips in Google Docs to create highly collaborative documents
- Cloud Blog: Transforming collaboration in Google Workspace
Roadmap
- This feature was listed as an upcoming release.
New default setting for content managers to modify shared drives coming in February 2023
What’s changing
In 2018, we launched the Content manager role, making it easier to manage files in shared drives. Currently, content managers have the ability to edit, reorganize, and delete shared drive content, but they cannot share folders in shared drives.
Starting today, admins will see a new shared drive setting that can be enabled or disabled to give content managers the ability to share folders in shared drives.
In February 2023, all content managers will have the ability to share folders by default. If you’d like this feature to remain off for end users, disable the setting now.
Who’s impacted
Admins and end users
Why it matters
Enabling content managers to share folders is a highly requested feature that will help organizations better manage access to their data.
Additional details
We will provide an update in February 2023 with the exact date that all content managers will have the ability to share folders by default.
Getting started
- Admins:
- This setting is currently ON by default. To disable the setting for content managers to share folders, go to the "Sharing settings" in the Drive and Docs section of the Admin Console > scroll to the "Shared drive creation" section > change the "Allow content managers to share folders" setting to OFF.
- Note: If enabled, Content managers will be able to share folders starting in February 2023.
- Visit the Help Center to learn more about managing shared drives as an admin.

- End users: If enabled by your admin, content managers can share folders starting February 2023. Visit the Help Center to learn more about shared drives.
Rollout pace
Admin controls:
- Rapid Release and Scheduled Release domains: Gradual rollout (up to 15 days for feature visibility) starting on December 8, 2022
End user setting:
- Rapid Release and Scheduled Release domains: Gradual rollout (up to 15 days for feature visibility) starting in February 2023
Availability
- Available to Google Workspace Essentials, Business Standard, Business Plus, Enterprise Essentials, Enterprise Standard, Enterprise Plus, Education Fundamentals, Education Plus, Education Standard, the Teaching and Learning Upgrade, and Nonprofits, as well as legacy G Suite Business customers
- Not available to Google Workspace Business Starter, Frontline, and legacy G Suite Basic customers
- Not available to users with personal Google Accounts
Resources
Generally available: Software inventory & agentless dependency analysis generally available with Azure Migrate
Now generally available for Hyper-V virtual machines and bare-metal servers
Auditing Kubernetes with Wazuh
Kubernetes is an open source platform that helps in managing the automation of container applications. Kubernetes deploys and manages applications in multiple nodes that run in a cluster for scalability. It has a high degree of control over applications and services that run in its clusters. This makes the clusters targets of cyber attacks. Therefore, it is important to log and audit Kubernetes cluster events.
In this blog post, we show how to audit Kubernetes events with Wazuh. To achieve this, we take the following steps:
- Create a webhook listener on the Wazuh server to receive logs from the Kubernetes cluster.
- Enable auditing on the Kubernetes cluster and configure it to forward audit logs to the Wazuh webhook listener.
- Create rules on the Wazuh server to alert about audit events received from Kubernetes.
Requirements
- A Wazuh server 4.3.10: You can use the pre-built ready-to-use Wazuh OVA. Follow this guide to set up the virtual machine.
- A self-managed Kubernetes cluster: To test this, we deploy a local Minikube cluster on a CentOS 8 endpoint. The bash script
minikubesetup.shbelow installs Minikube and all necessary dependencies on the endpoint.
#!/bin/bash

# Disable SELinux
setenforce 0
sed -i --follow-symlinks 's/SELINUX=enforcing/SELINUX=disabled/g' /etc/sysconfig/selinux

# Install Docker
yum install yum-utils -y
yum-config-manager --add-repo https://download.docker.com/linux/centos/docker-ce.repo
yum install docker-ce docker-ce-cli containerd.io docker-compose-plugin -y --allowerasing
systemctl start docker
systemctl enable docker

# Install conntrack
yum install conntrack -y

# Install Kubectl
curl -LO https://storage.googleapis.com/kubernetes-release/release/`curl -s https://storage.googleapis.com/kubernetes-release/release/stable.txt`/bin/linux/amd64/kubectl
chmod +x kubectl
mv kubectl /usr/bin/

# Install Minikube
curl -Lo minikube https://storage.googleapis.com/minikube/releases/latest/minikube-linux-amd64
chmod +x minikube
mv minikube /usr/bin/

# Install crictl
VERSION="v1.25.0"
wget https://github.com/kubernetes-sigs/cri-tools/releases/download/$VERSION/crictl-$VERSION-linux-amd64.tar.gz
tar zxvf crictl-$VERSION-linux-amd64.tar.gz -C /usr/bin/
rm -f crictl-$VERSION-linux-amd64.tar.gz

# Install cricd
wget https://github.com/Mirantis/cri-dockerd/releases/download/v0.2.6/cri-dockerd-0.2.6-3.el8.x86_64.rpm
rpm -i cri-dockerd-0.2.6-3.el8.x86_64.rpm
rm cri-dockerd-0.2.6-3.el8.x86_64.rpm

# Start Minikube
minikube start --driver=none
Create a file minikubesetup.sh and paste the script above into it. Execute the script with root privileges to set up Minikube:
# bash minikubesetup.sh
Configure the Wazuh server
We create a webhook listener on the Wazuh server to receive the Kubernetes audit logs. To do this, we first create certificates for encrypted communication between the Wazuh server and the Kubernetes cluster. We then create the webhook listener that listens on port 8080 and forwards the logs received to the Wazuh server for analysis. Additionally, we create a systemd service to run the webhook listener, and enable the service to run on system reboot.
Create certificates for communication between the Wazuh server and Kubernetes
1. Create the directory to contain the certificates:
# mkdir /var/ossec/integrations/kubernetes-webhook/
2. Create a certificate configuration file /var/ossec/integrations/kubernetes-webhook/csr.conf and add the following. Replace <wazuh_server_ip> with your Wazuh server IP address:
[ req ]
prompt = no
default_bits = 2048
default_md = sha256
distinguished_name = req_distinguished_name
x509_extensions = v3_req
[req_distinguished_name]
C = US
ST = California
L = San Jose
O = Wazuh
OU = Research and development
emailAddress = [email protected]
CN = <wazuh_server_ip>
[ v3_req ]
authorityKeyIdentifier=keyid,issuer
basicConstraints = CA:FALSE
keyUsage = digitalSignature, nonRepudiation, keyEncipherment, dataEncipherment
subjectAltName = @alt_names
[alt_names]
IP.1 = <wazuh_server_ip>
3. Create the root CA public and private keys:
# openssl req -x509 -new -nodes -newkey rsa:2048 -keyout /var/ossec/integrations/kubernetes-webhook/rootCA.key -out /var/ossec/integrations/kubernetes-webhook/rootCA.pem -batch -subj "/C=US/ST=California/L=San Jose/O=Wazuh"
4. Create the certificate signing request (csr) and the server private key:
# openssl req -new -nodes -newkey rsa:2048 -keyout /var/ossec/integrations/kubernetes-webhook/server.key -out /var/ossec/integrations/kubernetes-webhook/server.csr -config /var/ossec/integrations/kubernetes-webhook/csr.conf
5. Generate the server certificate:
# openssl x509 -req -in /var/ossec/integrations/kubernetes-webhook/server.csr -CA /var/ossec/integrations/kubernetes-webhook/rootCA.pem -CAkey /var/ossec/integrations/kubernetes-webhook/rootCA.key -CAcreateserial -out /var/ossec/integrations/kubernetes-webhook/server.crt -extfile /var/ossec/integrations/kubernetes-webhook/csr.conf -extensions v3_req
Create the webhook listener
1. Install the Python flask module with pip. This module is used to create the webhook listener and to receive JSON POST requests:
# /var/ossec/framework/python/bin/pip3 install flask
2. Create the Python webhook listener /var/ossec/integrations/custom-webhook.py. Replace <wazuh_server_ip> with your Wazuh server IP address:
#!/var/ossec/framework/python/bin/python3

import json
from socket import socket, AF_UNIX, SOCK_DGRAM
from flask import Flask, request

# CONFIG
PORT     = 8080
CERT     = '/var/ossec/integrations/kubernetes-webhook/server.crt'
CERT_KEY = '/var/ossec/integrations/kubernetes-webhook/server.key'

# Analysisd socket address
socket_addr = '/var/ossec/queue/sockets/queue'

def send_event(msg):
    string = '1:k8s:{0}'.format(json.dumps(msg))
    sock = socket(AF_UNIX, SOCK_DGRAM)
    sock.connect(socket_addr)
    sock.send(string.encode())
    sock.close()
    return True

app = Flask(__name__)
context = (CERT, CERT_KEY)

@app.route('/', methods=['POST'])
def webhook():
    if request.method == 'POST':
        if send_event(request.json):
            print("Request sent to Wazuh")
        else:
            print("Failed to send request to Wazuh")
    return "Webhook received!"

if __name__ == '__main__':
    app.run(host='<wazuh_server_ip>', port=PORT, ssl_context=context)
3. Create a systemd service at /lib/systemd/system/wazuh-webhook.service:
[Unit]
Description=Wazuh webhook
Wants=network-online.target
After=network.target network-online.target

[Service]
ExecStart=/var/ossec/framework/python/bin/python3 /var/ossec/integrations/custom-webhook.py
Restart=on-failure

[Install]
WantedBy=multi-user.target
4. Reload systemd, enable and start the webhook service:
# systemctl daemon-reload
# systemctl enable wazuh-webhook.service
# systemctl start wazuh-webhook.service
5. Check the status of the webhook service to verify that it is running:
# systemctl status wazuh-webhook.service
6. Enable access to port 8080 if the firewall on the Wazuh server is running.
# firewall-cmd --permanent --add-port=8080/tcp
# firewall-cmd --reload
Configure Kubernetes audit logging on the master node
To configure Kubernetes audit logging, we create an audit policy file to define events that the cluster will log. The policy also defines the amount of information that should be logged for each type of event. We proceed to create a webhook configuration file that specifies the webhook address where the audit events will be sent to. Finally, we apply the newly created audit policy and the webhook configuration to the cluster by modifying the Kubernetes API server configuration file.
The Kubernetes API server runs the Kubernetes API, which serves as the front end through which users interact with the Kubernetes cluster. We log all user requests to the Kubernetes API by adding the audit policy and webhook configuration to the API server.
1. Create a policy file /etc/kubernetes/audit-policy.yaml to log the events:
apiVersion: audit.k8s.io/v1
kind: Policy
rules:
    # Don’t log requests to the following API endpoints
    - level: None
      nonResourceURLs:
          - '/healthz*'
          - '/logs'
          - '/metrics'
          - '/swagger*'
          - '/version'

    # Limit requests containing tokens to Metadata level so the token is not included in the log
    - level: Metadata
      omitStages:
          - RequestReceived
      resources:
          - group: authentication.k8s.io
            resources:
                - tokenreviews

    # Extended audit of auth delegation
    - level: RequestResponse
      omitStages:
          - RequestReceived
      resources:
          - group: authorization.k8s.io
            resources:
                - subjectaccessreviews

    # Log changes to pods at RequestResponse level
    - level: RequestResponse
      omitStages:
          - RequestReceived
      resources:
          # core API group; add third-party API services and your API services if needed
          - group: ''
            resources: ['pods']
            verbs: ['create', 'patch', 'update', 'delete']

    # Log everything else at Metadata level
    - level: Metadata
      omitStages:
          - RequestReceived
2. Create a webhook configuration file /etc/kubernetes/audit-webhook.yaml. Replace <wazuh_server_ip> with the IP address of your Wazuh server:
apiVersion: v1
kind: Config
preferences: {}
clusters:
  - name: wazuh-webhook
    cluster:
      insecure-skip-tls-verify: true
      server: https://<wazuh_server_ip>:8080

# kubeconfig files require a context. Provide one for the API server.
current-context: webhook
contexts:
- context:
    cluster: wazuh-webhook
    user: kube-apiserver # Replace with name of API server if it’s different
  name: webhook
3. Edit the Kubernetes API server configuration file /etc/kubernetes/manifests/kube-apiserver.yaml and add the highlighted lines under the relevant sections :
...
spec:
  containers:
  - command:
    - kube-apiserver
    - --audit-policy-file=/etc/kubernetes/audit-policy.yaml
    - --audit-webhook-config-file=/etc/kubernetes/audit-webhook.yaml
    - --audit-webhook-batch-max-size=1

...

    volumeMounts:
    - mountPath: /etc/kubernetes/audit-policy.yaml
      name: audit
      readOnly: true
    - mountPath: /etc/kubernetes/audit-webhook.yaml
      name: audit-webhook
      readOnly: true

...

  volumes:
  - hostPath:
      path: /etc/kubernetes/audit-policy.yaml
      type: File
    name: audit
  - hostPath:
      path: /etc/kubernetes/audit-webhook.yaml
      type: File
    name: audit-webhook
4. Restart Kubelet to apply the changes:
# systemctl restart kubelet
Create detection rules on the Wazuh server
We create a base rule 110002 that matches all Kubernetes audit events received via the webhook listener. Rule 110003 alerts Kubernetes “create” events, while rule 110004 alerts Kubernetes “delete” events.
1. Add the following rules to the Wazuh server at /var/ossec/etc/rules/local_rules.xml:
<group name="k8s_audit,">
  <rule id="110002" level="0">
    <location>k8s</location>
    <field name="apiVersion">audit</field>
    <description>Kubernetes audit log.</description>
  </rule>

  <rule id="110003" level="5">
    <if_sid>110002</if_sid>
    <regex type="pcre2">requestURI":.+", "verb": "create</regex>
    <description>Kubernetes request to create resource</description>
  </rule>

  <rule id="110004" level="5">
    <if_sid>110002</if_sid>
    <regex type="pcre2">requestURI":.+", "verb": "delete</regex>
    <description>Kubernetes request to delete resource</description>
  </rule>
</group>
2. Restart the Wazuh manager to apply the rules:
# systemctl restart wazuh-manager
Test the configuration
Test the rules by creating and deleting a deployment on the Kubernetes cluster.
1. Run the following command on the Kubernetes master node to create a new deployment:
# kubectl create deployment hello-minikube --image=k8s.gcr.io/echoserver:1.4
2. Run the following command to delete the deployment:
# kubectl delete deployment hello-minikube
You get alerts similar to the following on the Wazuh dashboard when resources are created or deleted in the monitored Kubernetes cluster.
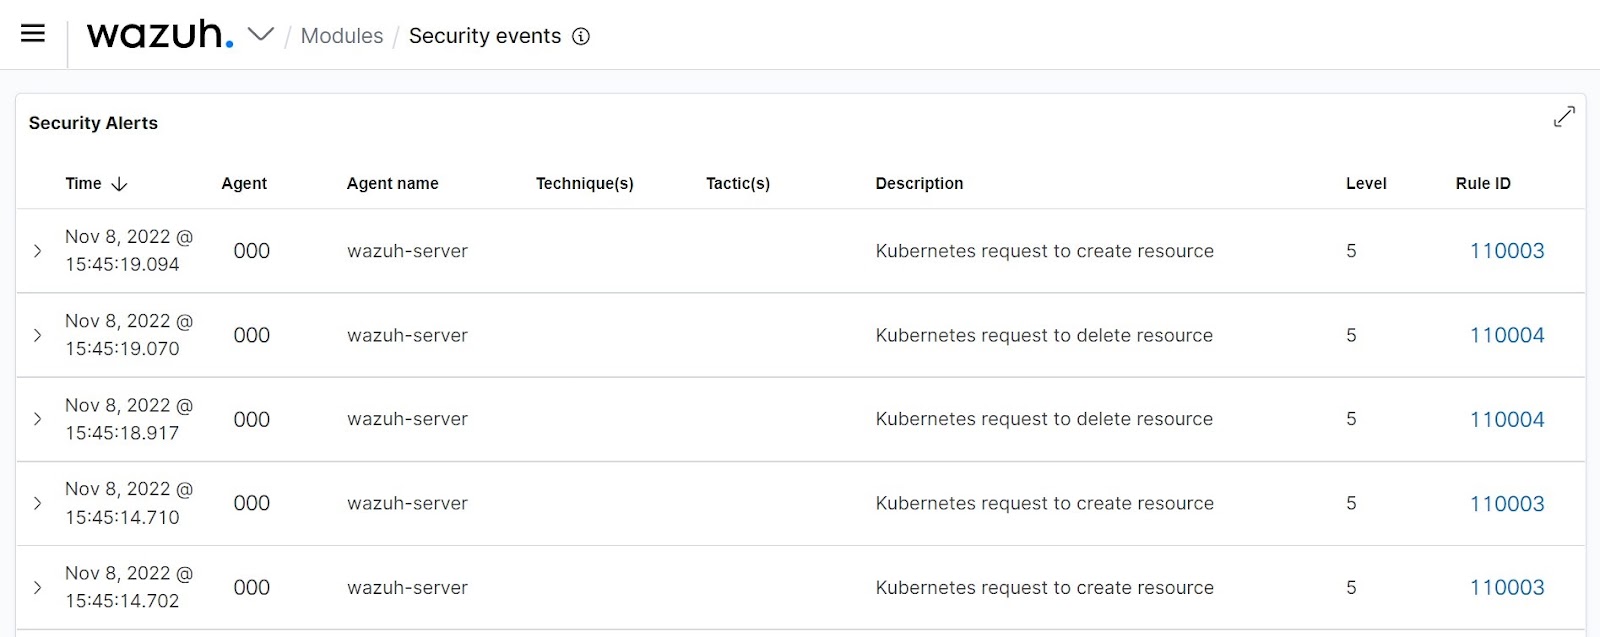
One of the logs is shown below:
{
  "kind": "EventList",
  "apiVersion": "audit.k8s.io/v1",
  "metadata": {},
  "items": [
    {
      "level": "Metadata",
      "auditID": "6ae321a6-0735-41a6-a9d9-050f9a75644c",
      "stage": "ResponseComplete",
      "requestURI": "/apis/apps/v1/namespaces/default/deployments?fieldManager=kubectl-create&fieldValidation=Strict",
      "verb": "create",
      "user": {
        "username": "minikube-user",
        "groups": [
          "system:masters",
          "system:authenticated"
        ]
      },
      "sourceIPs": [
        "192.168.132.137"
      ],
      "userAgent": "kubectl/v1.25.3 (linux/amd64) kubernetes/434bfd8",
      "objectRef": {
        "resource": "deployments",
        "namespace": "default",
        "name": "hello-minikube",
        "apiGroup": "apps",
        "apiVersion": "v1"
      },
      "responseStatus": {
        "metadata": {},
        "code": 201
      },
      "requestReceivedTimestamp": "2022-11-08T15:45:13.929428Z",
      "stageTimestamp": "2022-11-08T15:45:13.946284Z",
      "annotations": {
        "authorization.k8s.io/decision": "allow",
        "authorization.k8s.io/reason": ""
      }
    }
  ]
}
Additional rules can be added to alert Kubernetes “update” and “patch” events. Please note that alerting these events will generate huge volumes of alerts. Alternatively, if you wish to log all Kubernetes events without alerting them, you can save all the logs to the archive.
Save all Kubernetes logs to the Wazuh archive
Please be aware that using the Wazuh archive to save all incoming logs consumes a significant amount of storage space depending on the number of events received per second.
1. To save all logs to the archive, edit the Wazuh server configuration file /var/ossec/etc/ossec.conf and set the value of logall_json to yes. An example is shown below:
<ossec_config>
  <global>
    <jsonout_output>yes</jsonout_output>
    <alerts_log>yes</alerts_log>
    <logall>no</logall>
    <logall_json>yes</logall_json>
    ...
</ossec_config>
2. Restart the Wazuh manager to apply the change:
# systemctl restart wazuh-manager
3. To display archive logs on the Wazuh dashboard, modify the Filebeat configuration file /etc/filebeat/filebeat.yml and enable archives:
...
filebeat.modules:
  - module: wazuh
    alerts:
      enabled: true
    archives:
      enabled: true
...
4. Restart filebeat to apply the change:
# systemctl restart filebeat
5. On the Wazuh dashboard, click the upper-left menu icon and navigate to Stack management -> Index patterns -> Create index pattern. Use wazuh-archives-* as the index pattern name, and set @timestamp in the Time field. The GIF below shows how to create the index pattern:
6. To view the events on the dashboard, click the upper-left menu icon and navigate to Discover. Change the index pattern to wazuh-archives-* and then add the filter data.apiVersion: exists to view all Kubernetes events. The GIF below shows how to view the archive events on the Wazuh dashboard:
References
The post Auditing Kubernetes with Wazuh appeared first on Wazuh.
Public preview: New Memory Optimized VM sizes – E96bsv5 and E112ibsv5
New VM sizes provide the best remote storage performance of any Azure VMs to date. You can now process more data with fewer vCPUs while potentially reducing software licensing costs.