Category: <span>AWS Lambda</span>

Step Functions Distributed Map – A Serverless Solution for Large-Scale Parallel Data Processing

I am excited to announce the availability of a distributed map for AWS Step Functions. This flow extends support for orchestrating large-scale parallel workloads such as the on-demand processing of semi-structured data.

Step Function’s map state executes the same processing steps for multiple entries in a dataset. The existing map state is limited to 40 parallel iterations at a time. This limit makes it challenging to scale data processing workloads to process thousands of items (or even more) in parallel. In order to achieve higher parallel processing prior to today, you had to implement complex workarounds to the existing map state component.

The new distributed map state allows you to write Step Functions to coordinate large-scale parallel workloads within your serverless applications. You can now iterate over millions of objects such as logs, images, or .csv files stored in Amazon Simple Storage Service (Amazon S3). The new distributed map state can launch up to ten thousand parallel workflows to process data.

You can process data by composing any service API supported by Step Functions, but typically, you will invoke Lambda functions to process the data with code written in your favorite programming language.

Step Functions distributed map supports a maximum concurrency of up to 10,000 executions in parallel, which is well above the concurrency supported by many other AWS services. You can use the maximum concurrency feature of the distributed map to ensure that you do not exceed the concurrency of a downstream service. There are two factors to consider when working with other services. First, the maximum concurrency supported by the service for your account. Second, the burst and ramping rates, which determine how quickly you can achieve the maximum concurrency.

Let’s use Lambda as an example. Your functions’ concurrency is the number of instances that serve requests at a given time. The default maximum concurrency quota for Lambda is 1,000 per AWS Region. You can ask for an increase at any time. For an initial burst of traffic, your functions’ cumulative concurrency in a Region can reach an initial level of between 500 and 3000, which varies per Region. The burst concurrency quota applies to all your functions in the Region.

When using a distributed map, be sure to verify the quota on downstream services. Limit the distributed map maximum concurrency during your development, and plan for service quota increases accordingly.

To compare the new distributed map with the original map state flow, I created this table.

Original map state flow New distributed map flow
Sub workflows
  • Runs a sub-workflow for each item in an array. The array must be passed from the previous state.
  • Each iteration of the sub-workflow is called a map iteration, and its events are added to the state machine’s execution history.
  • Runs a sub-workflow for each item in an array or Amazon S3 dataset.
  • Each sub-workflow is run as a totally separate child execution, with its own event history.
Parallel branches Map iterations run in parallel, with an effective maximum concurrency of around 40 at a time. Can pass millions of items to multiple child executions, with concurrency of up to 10,000 executions at a time.
Input source Accepts only a JSON array as input. Accepts input as Amazon S3 object list, JSON arrays or files, csv files, or Amazon S3 inventory.
Payload 256 KB Each iteration receives a reference to a file (Amazon S3) or a single record from a file (state input). Actual file processing capability is limited by Lambda storage and memory.
Execution history 25,000 events Each iteration of the map state is a child execution, with up to 25,000 events each (express mode has no limit on execution history).

Sub-workflows within a distributed map work with both Standard workflows and the low-latency, short-duration Express Workflows.

This new capability is optimized to work with S3. I can configure the bucket and prefix where my data are stored directly from the distributed map configuration. The distributed map stops reading after 100 million items and supports JSON or csv files of up to 10GB.

When processing large files, think about downstream service capabilities. Let’s take Lambda again as an example. Each input—a file on S3, for example—must fit within the Lambda function execution environment in terms of temporary storage and memory. To make it easier to handle large files, Lambda Powertools for Python introduced a new streaming feature to fetch, transform, and process S3 objects with minimal memory footprint. This allows your Lambda functions to handle files larger than the size of their execution environment. To learn more about this new capability, check the Lambda Powertools documentation.

Let’s See It in Action
For this demo, I will create a workflow that processes one thousand dog images stored on S3. The images are already stored on S3.

➜  ~ aws s3 ls awsnewsblog-distributed-map/images/
2022-11-08 15:03:36      27034 n02085620_10074.jpg
2022-11-08 15:03:36      34458 n02085620_10131.jpg
2022-11-08 15:03:36      12883 n02085620_10621.jpg
2022-11-08 15:03:36      34910 n02085620_1073.jpg
...

➜  ~ aws s3 ls awsnewsblog-distributed-map/images/ | wc -l
    1000

The workflow and the S3 bucket must be in the same Region.

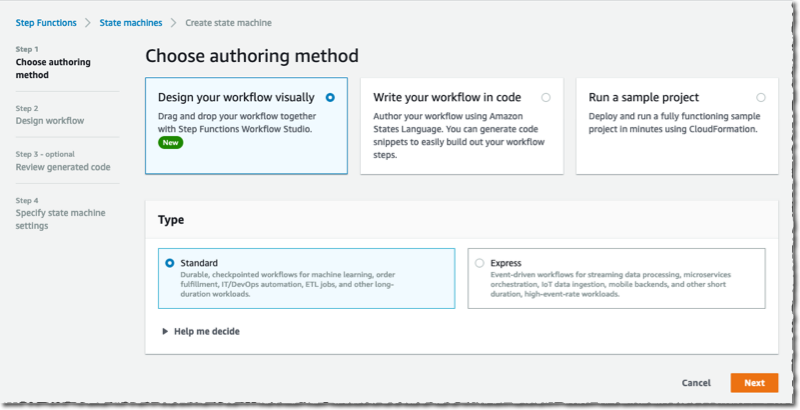
To get started, I navigate to the Step Functions page of the AWS Management Console and select Create state machine. On the next page, I choose to design my workflow using the visual editor. The distributed map works with Standard workflows, and I keep the default selection as-is. I select Next to enter the visual editor.

Distributed Map - create a workflow
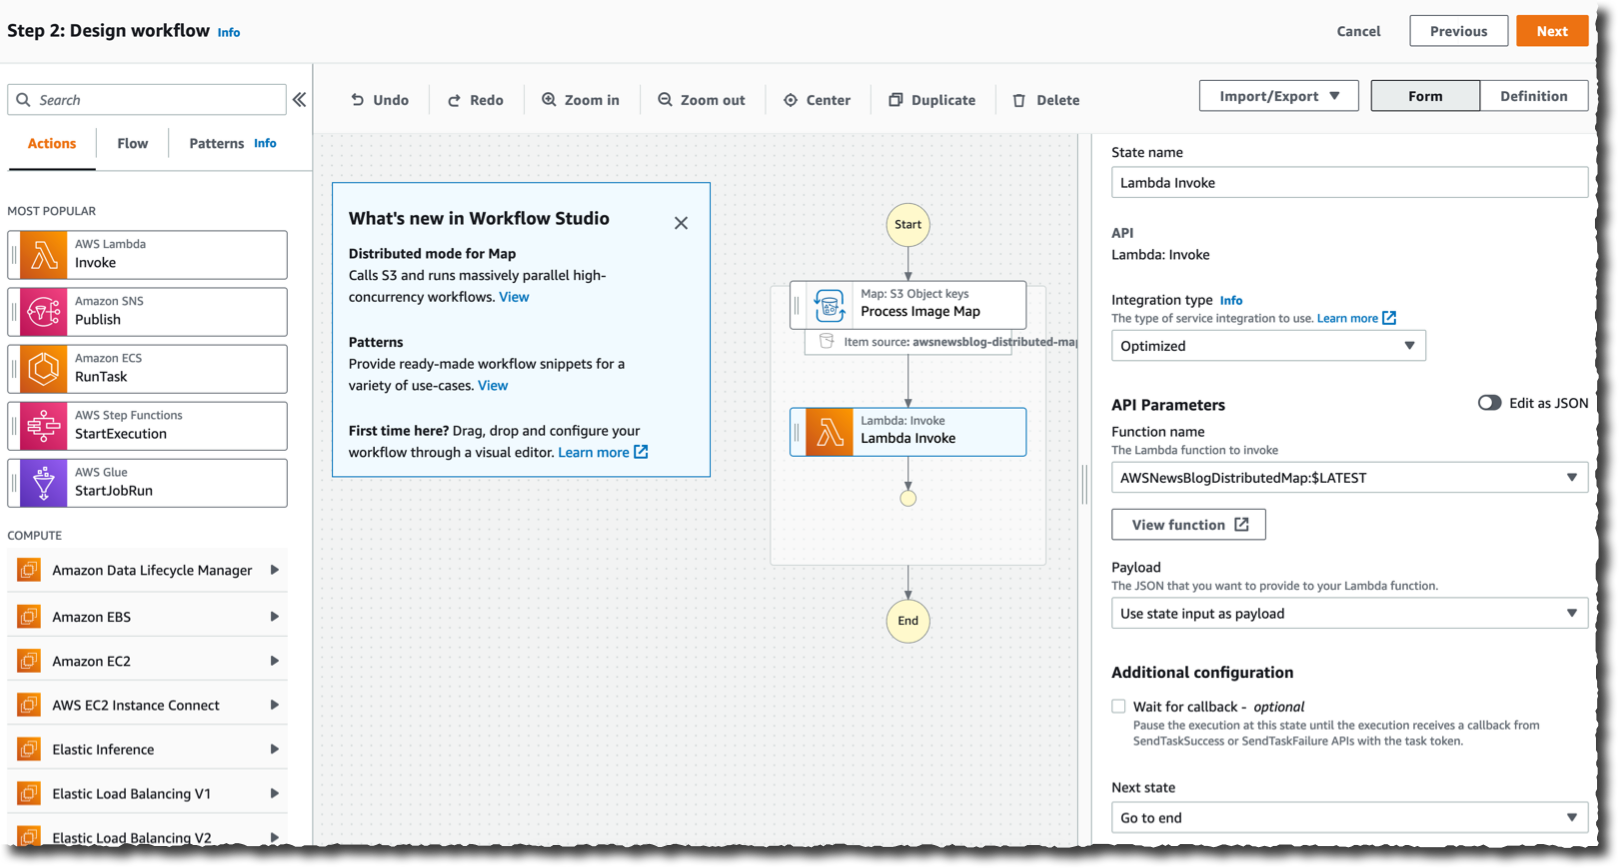
In the visual editor, I search and select the Map component on the left-side pane, and I drag it to the workflow area. On the right side, I configure the component. I choose Distributed as Processing mode and Amazon S3 as Item Source.

Distributed maps are natively integrated with S3. I enter the name of the bucket (awsnewsblog-distributed-map) and the prefix (images) where my images are stored.

On the Runtime Settings section, I choose Express for Child workflow type. I also may decide to restrict the Concurrency limit. It helps to ensure we operate within the concurrency quotas of the downstream services (Lambda in this demo) for a particular account or Region.

By default, the output of my sub-workflows will be aggregated as state output, up to 256KB. To process larger outputs, I may choose to Export map state results to Amazon S3.

Distributed Map - add a Lambda invocation

Finally, I define what to do for each file. In this demo, I want to invoke a Lambda function for each file in the S3 bucket. The function exists already. I search for and select the Lambda invocation action on the left-side pane. I drag it to the distributed map component. Then, I use the right-side configuration panel to select the actual Lambda function to invoke: AWSNewsBlogDistributedMap in this example.

Distributed Map - add a Lambda invocation

When I am done, I select Next. I select Next again on the Review generated code page (not shown here).

On the Specify state machine settings page, I enter a Name for my state machine and the IAM Permissions to run. Then, I select Create state machine.

Create State Machine - Final Screen
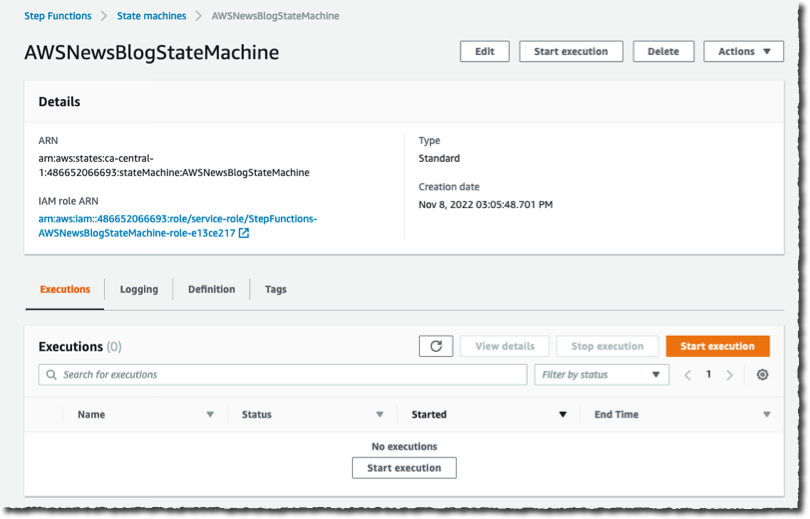
Now I am ready to start the execution. On the State machine page, I select the new workflow and select Start execution. I can optionally enter a JSON document to pass to the workflow. In this demo, the workflow does not handle the input data. I leave it as-is, and I select Start execution.

Start workflow execution Start workflow execution - pass input data

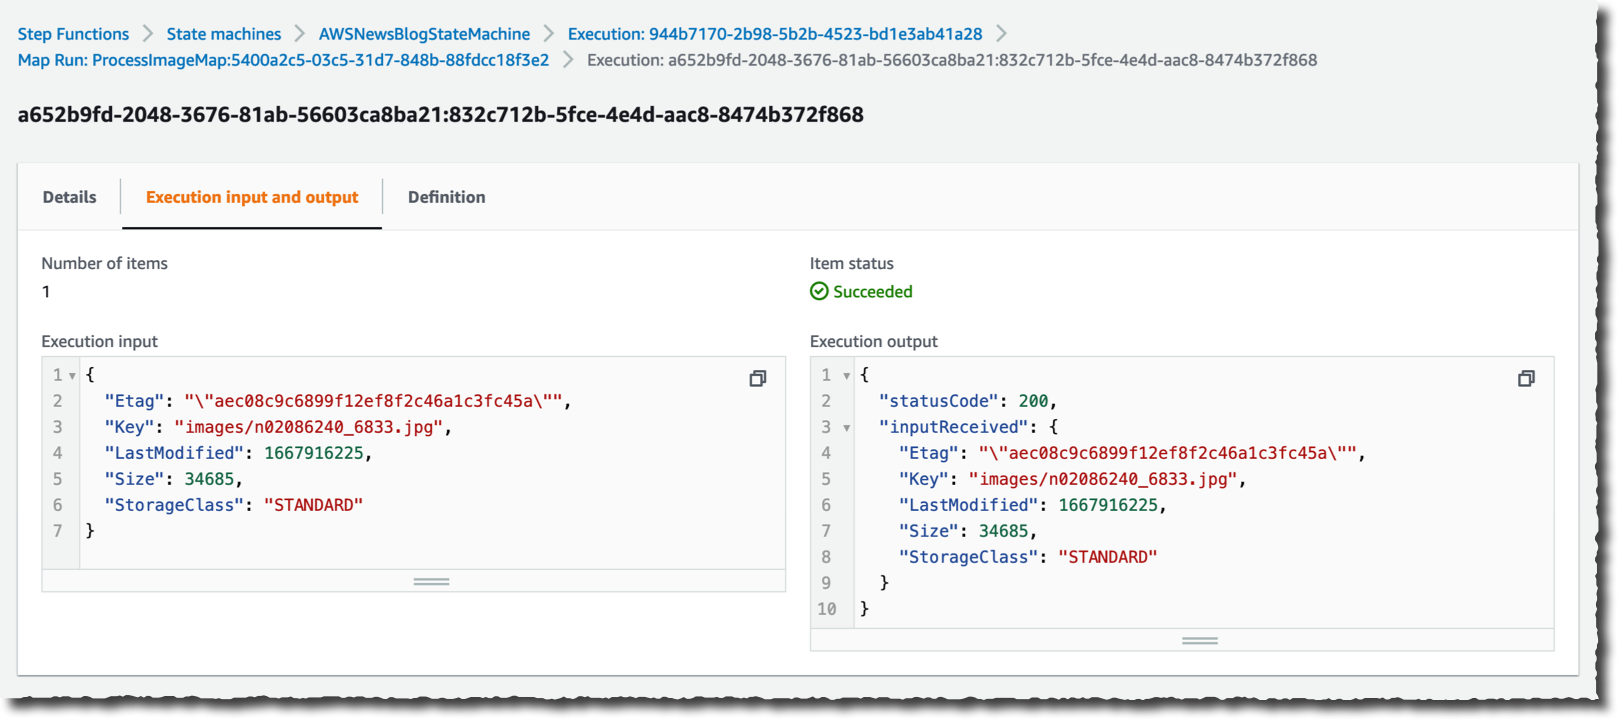
During the execution of the workflow, I can monitor the progress. I observe the number of iterations, and the number of items successfully processed or in error.

I can drill down on one specific execution to see the details.

Distributed Map - monitor execution details

With just a few clicks, I created a large-scale and heavily parallel workflow able to handle a very large quantity of data.

Which AWS Service Should I Use
As often happens on AWS, you might observe an overlap between this new capability and existing services such as AWS Glue, Amazon EMR, or Amazon S3 Batch Operations. Let’s try to differentiate the use cases.

In my mental model, data scientists and data engineers use AWS Glue and EMR to process large amounts of data. On the other hand, application developers will use Step Functions to add serverless data processing into their applications. Step Functions is able to scale from zero quickly, which makes it a good fit for interactive workloads where customers may be waiting for the results. Finally, system administrators and IT operation teams are likely to use Amazon S3 Batch Operations for single-step IT automation operations such as copying, tagging, or changing permissions on billions of S3 objects.

Pricing and Availability
AWS Step Functions’ distributed map is generally available in the following ten AWS Regions: US East (Ohio, N. Virginia), US West (Oregon), Asia Pacific (Singapore, Sydney, Tokyo), Canada (Central), and Europe (Frankfurt, Ireland, Stockholm).

The pricing model for the existing inline map state does not change. For the new distributed map state, we charge one state transition per iteration. Pricing varies between Regions, and it starts at $0.025 per 1,000 state transitions. When you process your data using express workflows, you are also charged based on the number of requests for your workflow and its duration. Again, prices vary between Regions, but they start at $1.00 per 1 million requests and $0.06 per GB-hour (prorated to 100ms).

For the same amount of iterations, you will observe a cost reduction when using the combination of the distributed map and standard workflows compared to the existing inline map. When you use express workflows, expect the costs to stay the same for more value with the distributed map.

I am really excited to discover what you will build using this new capability and how it will unlock innovation. Go start to build highly parallel serverless data processing workflows today!

— seb

AWS Lambda Extensions Are Now Generally Available – Get Started with Your Favorite Operations Tools Today

In October 2020, we announced the preview of AWS Lambda extensions, which you can use to easily integrate Lambda functions with your favorite tools for monitoring, observability, security, and governance.

Today, I’m happy to announce the general availability of AWS Lambda Extensions which comes with new performance improvements and an expanded set of partners. As part of the GA release, we have enabled functions to send responses as soon as the function code is complete without waiting for the included extensions to finish. This enables extensions to perform activities like sending telemetry to a preferred destination after the function’s response has been returned. We also welcome extensions from new partners: Imperva, Instana, Sentry, Site24x7, and the AWS Distro for OpenTelemetry.

You can use Lambda extensions for use cases such as capturing diagnostic information before, during, and after function invocation; automatically instrumenting your code without needing code changes; fetching configuration settings or secrets before the function invocation; detecting and alerting on function activity through security agents; and sending telemetry to custom destinations such as Amazon Simple Storage Service (Amazon S3), Amazon Kinesis, Amazon Elasticsearch Service directly and asynchronously from your Lambda functions.

Customers are drawn to the vision of Serverless. The reduced operational responsibility frees them up to focus on their business problems. To help customers monitor, observe, secure, and govern their functions, AWS Lambda provides native integrations for logs and metrics through Amazon CloudWatch, tracing through AWS X-Ray, tracking configuration changes through AWS Config, and recording API calls through AWS CloudTrail In addition, AWS Lambda partners provide tools for application management, API integration, deployment, monitoring, and security.

AWS Lambda extensions provide a simple way to extend the Lambda execution environment, which is where your function code is executed. AWS customers, partners, and the open source community can use the new Lambda Extensions API to build their own extensions, which are companion processes that augment the capabilities of Lambda functions. To learn how to build your own extensions, see the Building Extensions for AWS Lambda – In preview blog post. The post also includes information about changes to the Lambda lifecycle.

How AWS Lambda Extensions Works
AWS Lambda extensions are designed to be the easiest way to plug in the tools you use today without complex installation or configuration management. You can add tools to your functions using Lambda layers or include them in the image for functions deployed as container images.

Lambda extensions use the Extensions API to register for function and execution environment lifecycle events. In response to these events, extensions can start new processes or run logic. Lambda extensions can also use the Runtime Logs API to subscribe to a stream of the same logs that the Lambda service sends to Amazon CloudWatch directly from the Lambda execution environment. Lambda streams the logs to the extension, and the extension can then process, filter, and send the logs to any preferred destination.

Most customers will use Lambda extensions without needing to know about the capabilities of the Extensions API. You can just consume capabilities of an extension by configuring the options in your Lambda functions.

How to Use Lambda Extensions
You can install and manage extensions using the Lambda console, the AWS Command Line Interface (CLI), or infrastructure as code (IaC) services and tools such as AWS CloudFormation, AWS Serverless Application Model (AWS SAM), and Terraform.

To use Lambda extensions to integrate existing tools with your Lambda functions, choose your a Lambda function and on the Configuration tab, choose Monitoring and Operations tools.

On the Extensions page, you can find available extensions from AWS Lambda partners. Choose an extension to view its installation instructions.

AWS Lambda Extensions Partners
At this launch, Lambda extensions integrate with these AWS Lambda partners who have provided the following information to introduce their extensions. (I am updating this article with links as they are published.)

  • AppDynamics provides end-to-end transaction tracing for AWS Lambda. With the AppDynamics extension, it is no longer mandatory for developers to include the AppDynamics tracer as a dependency in their function code, making tracing transactions across hybrid architectures even simpler.
  • Coralogix is a log analytics and cloud security platform that empowers thousands of companies to improve security and accelerate software delivery, allowing you to get deep insights without paying for the noise. Coralogix can now read Lambda function logs and metrics directly, without using CloudWatch or Amazon S3, reducing the latency, and cost of observability.
  • The Datadog extension brings comprehensive, real-time visibility to your serverless applications. Combined with Datadog’s integration with AWS, you get metrics, traces, and logs to help you monitor, detect, and resolve issues at any scale. The Datadog extension makes it easier than ever to get telemetry from your serverless workloads.
  • The Dynatrace extension makes it even easier to bring AWS Lambda metrics and traces into the Dynatrace platform for intelligent observability and automatic root cause detection. Get comprehensive, end-to-end observability with the flip of a switch and no code changes.
  • Epsagon helps you monitor, troubleshoot, and lower the cost of your Lambda functions. Epsagon’s extension reduces the overhead of sending traces to the Epsagon service, with minimal performance impact to your function.
  • HashiCorp Vault allows you to secure, store, and tightly control access to your application’s secrets and sensitive data. With the Vault extension, you can now authenticate and securely retrieve dynamic secrets before your Lambda function is invoked.
  • Honeycomb is a powerful observability tool that helps you debug your entire production app stack. Honeycomb’s extension decreases the overhead, latency, and cost of sending events to the Honeycomb service, while increasing reliability.
  • Instana Enterprise Observability Platform ingests performance metrics, traces requests, and profiles processes to make observability work for the enterprise. The Instana Lambda extension offers modification-free, low latency tracing of Lambda functions backed by their real-time Enterprise Observability Platform.
  • Imperva Serverless Protection protects organizations from vulnerabilities created by misconfigured apps and code-level security risks in serverless computing environments. The Imperva extension enables customers to easily embed additional security in their DevOps processes for serverless applications without requiring any code changes, leading to faster time to market.
  • Lumigo provides a monitoring and observability platform for serverless and microservices applications. The Lumigo extension enables the new Lumigo Lambda Profiler to see a breakdown of function resources, including CPU, memory, and network metrics. Use the extension to receive actionable insights to reduce Lambda runtime duration and cost, fix bottlenecks, and increase efficiency.
  • Check Point CloudGuard provides full lifecycle security for serverless applications. The CloudGuard extension enables Function Self Protection data aggregation as an out-of-process extension, providing detection and alerting on application layer attacks.
  • New Relic enables you to efficiently monitor, troubleshoot, and optimize your Lambda functions. New Relic’s extension allows you send your Lambda service platform logs directly to New Relic’s unified observability platform, allowing you to quickly visualize data with minimal latency and cost.
  • Thundra provides an application debugging, observability and security platform for serverless, container and virtual machine (VM) workloads. The Thundra extension adds asynchronous telemetry reporting functionality to the Thundra agents, getting rid of network latency.
  • Splunk offers an enterprise-grade cloud monitoring solution for real-time full-stack visibility at scale. The Splunk extension provides a simplified runtime-independent interface to collect high-resolution observability data with minimal overhead. Monitor, manage, and optimize the performance and cost of your serverless applications with Splunk Observability solutions.
  • Sentry’s extension enables developers to monitor code health. From error tracking to performance monitoring, developers can see issues more clearly, solve them quicker, and continuously stay informed about the health of their applications, all without making code changes.
  • Site24x7 provides a performance monitoring solution for DevOps and IT operations. The Site24x7 extension enables real-time observability into your Lambda functions. It enables you to monitor critical Lambda metrics and function executions logs and optimize execution time and performance.
  • The Sumo Logic extension enables you to get instant visibility into the health and performance of your mission-critical applications using AWS Lambda. With this extension and Sumo Logic’s continuous intelligence platform, you can now ensure that all your Lambda functions are running as expected by analyzing function, platform, and extension logs to quickly identify and remediate errors and exceptions.

Here are Lambda extensions from AWS services:

  • AWS AppConfig helps you manage, store, and safely deploy application configurations to your hosts at runtime. The AWS AppConfig extension integrates Lambda and AWS AppConfig seamlessly. Lambda functions have simple access to external configuration settings quickly and easily. Developers can now dynamically change their Lambda function’s configuration safely using robust validation features.
  • Amazon CodeGuru Profiler helps developers improve application performance and reduce costs by pinpointing an application’s most expensive line of code. It provides recommendations for improving code to save money. The Lambda integration removes the need to change any code or redeploy packages.
  • Amazon CloudWatch Lambda Insights enables you to efficiently monitor, troubleshoot, and optimize Lambda functions. The Lambda Insights extension simplifies the collection, visualization, and investigation of detailed compute performance metrics, errors, and logs. You can more easily isolate and correlate performance problems to optimize your Lambda environments.
  • AWS Distro for OpenTelemetry is a secure, production-ready, AWS-supported distribution of the OpenTelemetry project. The Lambda extension runs the OpenTelemetry collector and enables functions to send trace data to AWS monitoring services such as AWS X-Ray and to any destination such as Honeycomb and Lightstep that supports OpenTelemetry Protocol (OTLP) using the OTLP exporter.

To get started with Lambda extensions, use the links provided to install these extensions.

Things to Know
Here are a couple of things to keep in mind:

Pricing: Extensions share the same billing model as Lambda functions and you are charged for compute time used in all phases of the Lambda lifecycle. For function invocations, you pay for requests served and the compute time used to run your code and all extensions, together, in 1ms increments. To learn more about billing for extensions, visit the Lambda FAQs page.

Performance: Lambda extensions might impact the performance of your function because they share resources such as CPU, memory, and storage with the function, and because extensions are initialized before function code. For example, if an extension performs compute-intensive operations, you might see your function’s execution duration increase because the extension and your function code share the same CPU resources.

Because Lambda uses allocates proportional CPU power based on the memory setting, you might see increased execution and initialization duration at lower memory settings as more processes compete for the same CPU resources. You can use CloudWatch metrics such as PostRuntimeExecutionDuration to measure the extra time the extension takes after the function execution and MaxMemoryUsed to measure the increase in memory used.

Available Now
The performance improvements announced as part of GA are currently in US East (N. Virginia), Europe (Ireland), and Europe (Milan) Regions.

You can also build your own extensions. To learn how to build extensions, see the Lambda Extensions API in the AWS Lambda Developer Guide. You can send feedback through the AWS forum for AWS Lambda or through your usual AWS Support contacts.

Channy

Update. Watch a quick introductory video and a deep dive playlist about AWS Lambda Extensions for more information.