Beverage of Choice: Krating Daeng (Thai Red Bull) Industry Influencer he Admires: Casey John Ellis What did you want to be when you grew up? A physician and nearly did Hobbies (Present & Past): Motorcycling & Australian Football Bucket List: Continuing to discover new software Fun Fact: He currently has 2,000 tabs open “People keep …
San Jose, California, November 2022. We are delighted to announce that GC Security has signed a partnership agreement with Wazuh. GC Security is a worldwide cybersecurity solutions provider that aims to create safer digital environments to drive innovation, transformation, and value generation.
GC Security uses manual and automated inputs from its risk-centralizing platform to perform context and critical analysis using artificial intelligence, allowing a risk-based approach that employs the insights and tactics used by cybercriminals.
In addition to producing technical outputs, the analyses enable actions to be taken to mitigate risk, execute inputs to measure cybersecurity maturity and engage all levels of the company.
“GC Security has been part of the Wazuh community since the first months of its launch. We are very familiar with the tool and trust its capabilities: collecting, centralizing, and correlating logs to create rules while also being an excellent monitoring solution. As an organic user with a long history of using Wazuh, this partnership is a natural and motivating move for our company to partake in Wazuh’s ongoing growth in our market,” commented Rodrigo Gava, Head of Operations of GC Security.
GC Security works with different segments and company sizes, with numerous cases in industries such as telecommunications, financial institutions, urban mobility, retail, and technology.
“We are pleased to know that GC Security has been part of the Wazuh community for so long and that they rely on our capabilities to provide their customers with the best assistance. It is a great honor that a company with such global experience in cybersecurity teamed up with Wazuh,” remarked Alberto Gonzalez, COO at Wazuh.
If you want to learn more about GC Security, please visit its official website. For more information on Wazuh Partnerships, please visit our partners’ page.
Beverage of Choice: Krating Daeng (Thai Red Bull)
Industry Influencer he Admires: Casey John Ellis
What did you want to be when you grew up? A physician and nearly did
Hobbies (Present & Past): Motorcycling & Australian Football
Bucket List: Continuing to discover new software
Fun Fact: He currently has 2,000 tabs open
Unless otherwise indicated, the features below are fully launched or in the process of rolling out (rollouts should take no more than 15 business days to complete), launching to both Rapid and Scheduled Release at the same time (if not, each stage of rollout should take no more than 15 business days to complete), and available to all Google Workspace and G Suite customers.
Resizing Pivot Tables in Google Sheets
We’re excited to announce a requested feature that allows you to resize the pivot table editor side panel when creating or editing a pivot table. This functionality is especially useful when the names of columns or fields are too long and you want to see the text in its entirety. | Learn more.
Improved search results based on recent search activity in Gmail
Share Google Docs, Sheets, and Slides files in Google Meet chat
Earlier this year, we announced the ability to join or present to a Google Meet call from Google Docs, Sheets, or Slides. Now, if you are presenting or joining a meeting from a file, you can easily share that file with meeting attendees through in-meeting chat. With this update you’re able to grant access to a document, spreadsheet, or presentation to all or select meeting attendees, allowing everyone in the meeting to collaborate while having a conversation. | Learn more.
Docker has become a popular framework for application deployment since its development due to its benefits. For example, it makes it easier for organizations to enhance the portability of their applications and operational resilience. Docker is an open source technology used to package applications into containers. Docker containers are lightweight, standalone, and runnable instances of a Docker image that isolate software running in the container from the operating system environment. With these benefits, many organizations have adopted the technology to quickly package their software in standard units for development, shipment, and deployment.
The increased usage of containerized software has increased the attack surface for organizations. This provides an additional asset for cyber threat actors to target in their attacks. Therefore, it is crucial to continuously monitor containers to gain complete visibility of their environment and events during execution.
In this blog post, we demonstrate how to do the following:
Monitor Docker events such as pull, create, start, mount, connect, exec_start, detach, die, exec_create, exec_detach, etc.
Monitor Docker container resources such as CPU, memory, and network traffic utilization.
Detect when container CPU and memory usage exceed predefined thresholds.
Monitor the health status and uptime of Docker containers.
Infrastructure setup
The following setup is used to illustrate the capability of Wazuh to monitor Docker container events and their metrics:
A Centos 7 endpoint running the Wazuh 4.3.10. The Wazuh central components can be installed using this Quickstart installation guide.
An Ubuntu 22.04 endpoint running the Wazuh agent 4.3.10. This endpoint also hosts the Docker container infrastructure. This Wazuh guide is used to install the Wazuh agent.
Monitoring with Wazuh
Wazuh has the Docker listener and command monitoring modules that can be used to collect security and runtime events from Docker containers. The Docker listener module communicates with the Docker API to collect events related to Docker containers. The command monitoring module is used to monitor the output of specific commands and trigger alerts if they match a rule.
Ubuntu endpoint configuration
Follow these steps on the monitored endpoint:
Note
You need root user privileges to execute all the commands described below.
1. Install Python and pip:
# apt install python3 python3-pip
2. Install Docker and the Python Docker Library to run the containers:
# curl -sSL https://get.docker.com/ | sh
# pip3 install docker==4.2.0
3. Enable the Wazuh agent to receive remote commands from the Wazuh server. By default, remote commands are disabled in agents for security reasons.
4. Restart the Wazuh agent to apply the above changes:
# systemctl restart wazuh-agent
Wazuh server configuration
Follow these steps on the Wazuh server:
Note
You need root user privileges to execute all the commands described below.
1. Create a Wazuh agent group called container:
# /var/ossec/bin/agent_groups -a -g container -q
2. Obtain the ID of all Wazuh agents using the following command:
# /var/ossec/bin/manage_agents -l
3. Assign the Wazuh agent hosting the Docker containers to the container group. Multiple agents can be assigned to the group. This ensures all agents running Docker containers in your environment receive the same configuration.
Replace <AGENT_ID> with the agent’s ID of the endpoint hosting the Docker container.
# /var/ossec/bin/agent_groups -a -i <AGENT_ID> -g container -q
4. Add the following settings to the /var/ossec/etc/shared/container/agent.conf configuration file. This enables the Docker listener module and sets the commands to execute on the monitored endpoint for Docker container information gathering.
Nov 1 13:47:12 ubuntu-2204 docker-container-health: ossec: output: 'docker container ps': nginx nginx-container Up 48 minutes (healthy)
5. Create a decoders file docker_decoders.xml in the /var/ossec/etc/decoders/ directory and add the following decoders to decode the logs received from the Wazuh agent:
The custom decoder file docker_decoders.xml might be removed during an upgrade. Ensure to back up the file before you perform upgrades.
6. Create a rules file docker_rules.xml in the /var/ossec/etc/rules/ directory and add the following rules to alert the container information:
<group name="container,">
  <!-- Rule for container resources information. -->
  <rule id="100100" level="5">
    <decoded_as>docker-container-resource</decoded_as>
    <description>Docker: Container $(container_name) Resources</description>
    <group>container_resource,</group>
  </rule>

  <!-- Rule to trigger when container CPU and memory usage are above 80%. -->
  <rule id="100101" level="12">
    <if_sid>100100</if_sid>
    <field name="container_cpu_usage" type="pcre2">^(0*[8-9]d|0*[1-9]d{2,})</field>
    <field name="container_memory_perc" type="pcre2">^(0*[8-9]d|0*[1-9]d{2,})</field>
    <description>Docker: Container $(container_name) CPU usage ($(container_cpu_usage)) and memory usage ($(container_memory_perc)) is over 80%</description>
    <group>container_resource,</group>
  </rule>

  <!-- Rule to trigger when container CPU usage is above 80%. -->
  <rule id="100102" level="12">
    <if_sid>100100</if_sid>
    <field name="container_cpu_usage" type="pcre2">^(0*[8-9]d|0*[1-9]d{2,})</field>
    <description>Docker: Container $(container_name) CPU usage ($(container_cpu_usage)) is over 80%</description>
    <group>container_resource,</group>
  </rule>

  <!-- Rule to trigger when container memory usage is above 80%. -->
  <rule id="100103" level="12">
    <if_sid>100100</if_sid>
    <field name="container_memory_perc" type="pcre2">^(0*[8-9]d|0*[1-9]d{2,})</field>
    <description>Docker: Container $(container_name) memory usage ($(container_memory_perc)) is over 80%</description>
    <group>container_resource,</group>
  </rule>

  <!-- Rule for container health information. -->
  <rule id="100105" level="5">
    <decoded_as>docker-container-health</decoded_as>
    <description>Docker: Container $(container_name) is $(container_health_status)</description>
    <group>container_health,</group>
  </rule>

  <!-- Rule to trigger when a container is unhealthy. -->
  <rule id="100106" level="12">
    <if_sid>100105</if_sid>
    <field name="container_health_status">^unhealthy$</field>
    <description>Docker: Container $(container_name) is $(container_health_status)</description>
    <group>container_health,</group>
  </rule>
</group>
Note
The custom rules file docker_rules.xml might be removed during an upgrade. Ensure to back up the file before you perform upgrades.
7. Restart the Wazuh manager to apply the above changes:
# systemctl restart wazuh-manager
Testing the configuration
To showcase the use cases mentioned above, Nginx, Redis, and Postgres images are used to create a containerized environment on the monitored endpoint.
1. Create and switch into a project directory /container_env for the container environment using the following command:
$ mkdir container_env && cd $_
2. Create a Docker compose file docker-compose.yml and add the following configurations to it. The Docker compose file helps to manage multiple containers at once. The configuration performs the following Docker actions:
Pulls Nginx, Redis, and Postgres container images from Docker Hub.
Creates and starts nginx-container, redis-container, and postgres-container containers from the respective Docker images.
Creates and connects to a network called container_env_network.
Creates and mounts volumes container_env_db and container_env_cache.
Performs health checks on the created containers every three minutes.
3. Execute the following command in the path containing the docker-compose.yml file to create and start the containers:
$ sudo docker compose up -d
4. we use the stress-ng utility program to test for high CPU and memory utilization. Perform this test on one of the containers, for instance, the nginx-container.
Execute the following commands to enter the container shell and install the stress-ng utility:
Execute the following command to trigger a high-level alert when memory usage exceeds 80%. The command runs for 3 minutes.
# stress-ng -vm 1 --vm-bytes 500m -t 3m
Execute the following command to trigger a high-level alert when CPU usage exceeds 80%. The command runs for 3 minutes.
# stress-ng -c 1 -l 80 -t 3m
5. The health check for the nginx-container verifies whether the configuration file /etc/nginx/nginx.conf exists. While inside the container shell, delete the configuration file to trigger a high-level alert when the container becomes unhealthy:
# rm /etc/nginx/nginx.conf
Alert visualization
Visualize the triggered alerts by visiting the Wazuh dashboard.
Container actions alerts: Navigate to the Discover section and add the rule.groups: docker filter in the search bar to query the alerts.Also, use the Filter by type search field and apply the agent.name, data.docker.from, data.docker.Actor.Attributes.name, data.docker.Type, data.docker.Action, and rule.description, filters. Save the query as Docker Events.
Figure 1: Custom visualization with detected Docker events.
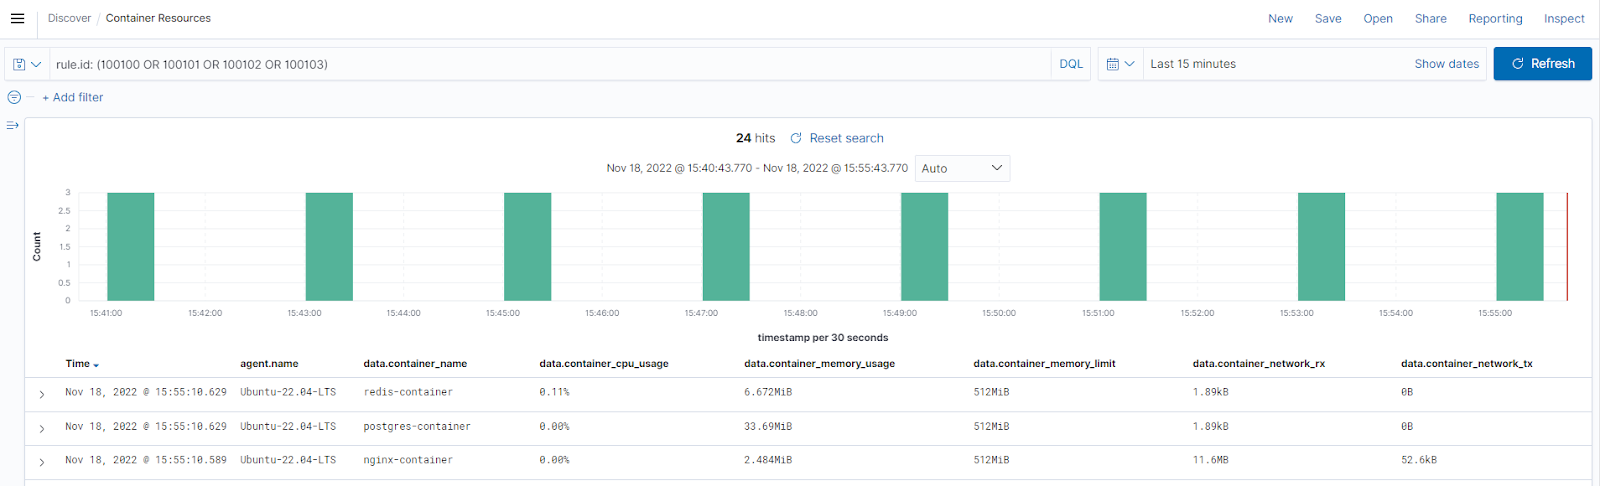
Container resources alerts: Navigate to the Discover section and add the rule.id: (100100 OR 100101 OR 100102 OR 100103) filter in the search bar to query the alerts. Also, use the Filter by type search field and apply the agent.name, data.container_name, data.container_cpu_usage, data.container_memory_usage, data.container_memory_limit, data.container_network_rx, and data.container_network_tx filters. Save the query as Container Resources.
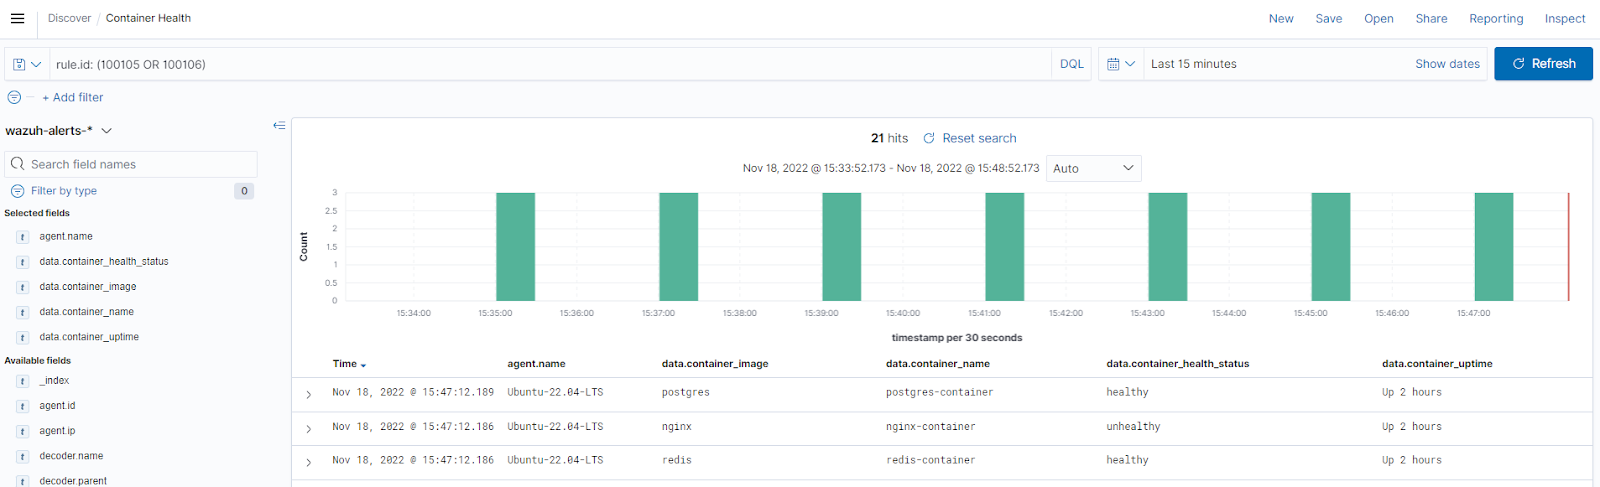
Container health alerts: Navigate to the Discover section and add the rule.id: (100105 OR 100106) filter in the search bar to query the alerts. Also, use the Filter by type search field and apply the agent.name, data.container_image, data.container_name, data.container_health_status, and data.container_uptime filters to show the status information. Save the query as Container Health.
Figure 3: Health status of containers on the custom visualization.
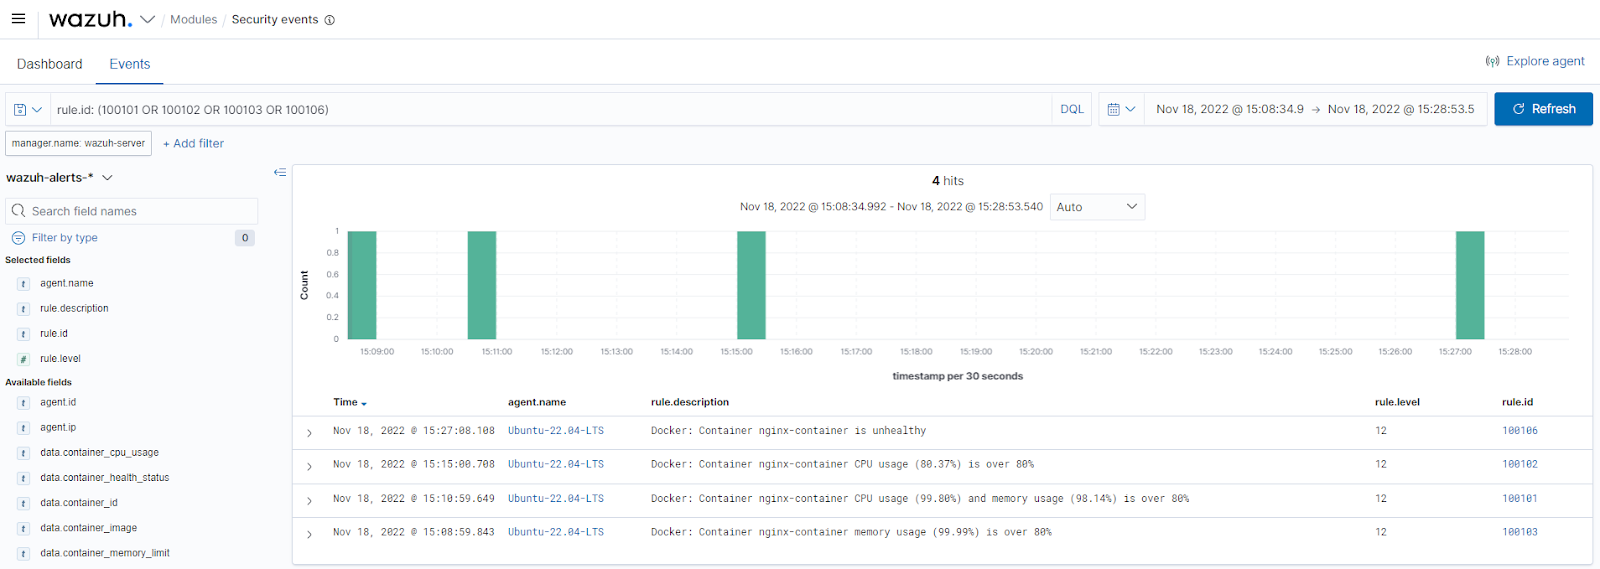
Container threshold events: Navigate to the Wazuh > Security events section and add the rule.id: (100101 OR 100102 OR 100103 OR 100106) filter in the search bar to query the alerts.
Figure 4: Container threshold events on the Wazuh dashboard.
To have a single display of the visualizations, create a custom dashboard with the above templates. Navigate to OpenSearch Dashboards > Dashboard > Create New Dashboard, then select Add an existing link and click the saved visualizations (Docker Events, Container Resources, and Container Health). This will add the visualizations to the new dashboard. Save the dashboard as Container-resource-health-events.
Figure 5: Custom dashboard displaying container resources, health, and events.
Conclusion
High visibility of containers in Dockerized environments allows you to maintain a secure and efficient environment. This way, organizations can quickly identify and respond to issues and minimize disruptions. With Wazuh, we can spot abnormalities in containers, get an overview of their resource utilization, and easily analyze their health.
In this blog post, we ensured complete coverage of our Dockerized environment by monitoring Docker container events, resource utilization, and health to improve overall security.
Use Azure REST Quota API to manage service limits (quotas), query current usage and quotas, and even update limits for your supported Azure resources, when required.
Azure IoT Hub now supports the ability to setup an Azure Cosmos DB account as a custom endpoint. This will help route device data from IoT Hub to Azure Cosmos DB directly.
Manage Cookie Consent
We use cookies to optimize our website and our service.
Functional
Always active
The technical storage or access is strictly necessary for the legitimate purpose of enabling the use of a specific service explicitly requested by the subscriber or user, or for the sole purpose of carrying out the transmission of a communication over an electronic communications network.
Preferences
The technical storage or access is necessary for the legitimate purpose of storing preferences that are not requested by the subscriber or user.
Statistics
The technical storage or access that is used exclusively for statistical purposes.The technical storage or access that is used exclusively for anonymous statistical purposes. Without a subpoena, voluntary compliance on the part of your Internet Service Provider, or additional records from a third party, information stored or retrieved for this purpose alone cannot usually be used to identify you.
Marketing
The technical storage or access is required to create user profiles to send advertising, or to track the user on a website or across several websites for similar marketing purposes.