UPDATE: Microsoft continues to work with partners and customers to expand our knowledge of the threat actor behind the nation-state cyberattacks that compromised the supply chain of SolarWinds and impacted multiple other organizations. Microsoft previously used ‘Solorigate’ as the primary designation for the actor, but moving forward, we want to place appropriate focus on the actors behind the sophisticated attacks, rather than one of the examples of malware used by the actors.
Customer Guidance on Recent Nation-State Cyber Attacks
Note: we are updating as the investigation continues. Revision history listed at the bottom.
This post contains technical details about the methods of the actor we believe was involved in Recent Nation-State Cyber Attacks, with the goal to enable the broader security community to hunt for activity in their networks and contribute to a shared defense against this sophisticated threat actor.
Security Update Guide: Let's keep the conversation going
Hi Folks,
We want to continue to highlight changes we’ve made to our Security Update Guide. We have received a lot of feedback, much of which has been very positive. We acknowledge there have been some stability problems and we are actively working through reports of older browsers not being able to run the new application.
新しいセキュリティ更新プログラム ガイド (Security Update Guide) を使ってみよう
新しいバージョンのセキュリティ更新プログラムについては下記の関連ブログもご覧ください。 「新しいセキュ
Detecting vulnerable software on Linux systems
The Wazuh security platform can identify if the software installed on your endpoints has flaws that may affect your infrastructure security, so it detects vulnerable software. In a previous post, we showed how to scan Windows systems to determine which vulnerabilities affect them, showcasing Wazuh integration with the National Vulnerability Database (NVD).
For this blog post we will focus on Wazuh support for Linux platforms, including distributions such as CentOS, Red Hat, Debian, or Ubuntu. Detecting vulnerabilities on these systems presents a challenge, since it requires integrations with different data feeds.
Vulnerabilities data sources
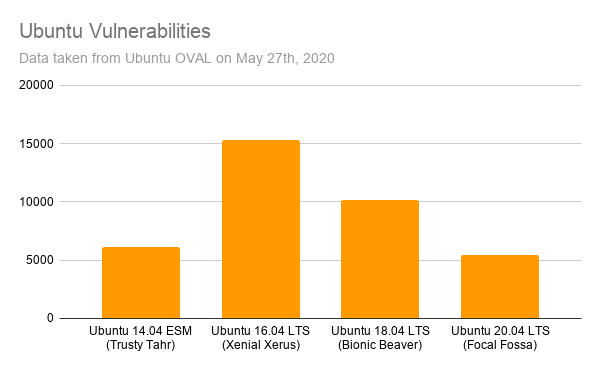
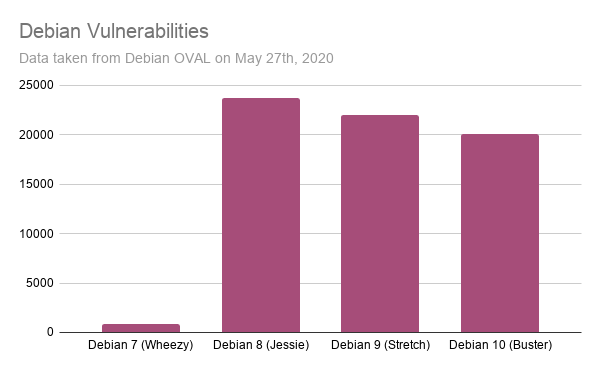
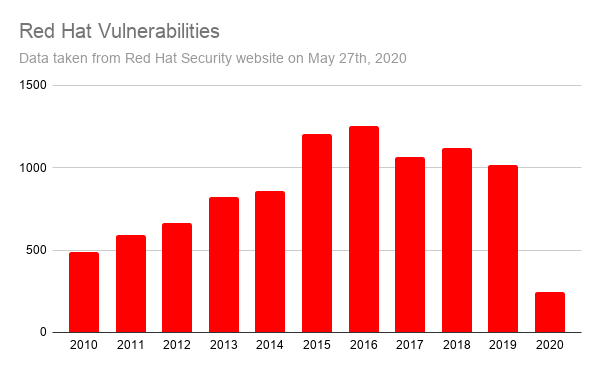
Wazuh retrieves information from different Linux vendors, which it uses to identify vulnerable software on the monitored endpoints. Here are some CVE (Common Vulnerabilities and Exposures) statistics from these vendors:
These charts expose the first challenge of vulnerability detection: data normalization. Wazuh not only pulls information from the different vendor feeds, but it processes the data so it can be used to identify vulnerabilities when scanning a list of applications.
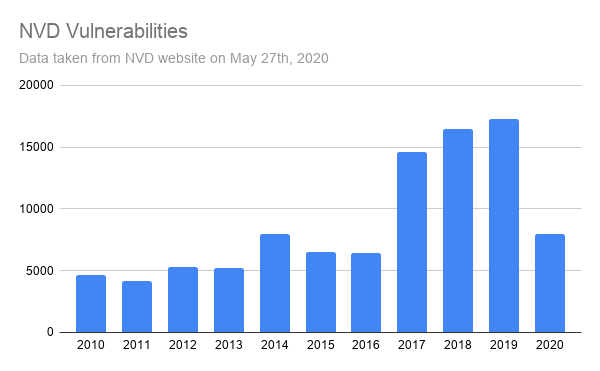
The second challenge is that the vendor feeds only provide information about the packages published in their repositories. So, what about third-party packages? Can we detect vulnerabilities in those cases? This is where the NVD (National Vulnerability Database) comes in handy. It aggregates vulnerability information from a large number of applications and operating systems. For comparison with the Linux vendor charts, here is the number of CVEs included in the NVD database.
To see how useful the NVD data is, let’s see an example.
CVE-2019-0122
According to the NVD, this vulnerability affects the Intel(R) SGX SDK for Linux. More specifically, it affects all its software packages up to version 2.2.
In this case, the vendor website claims that the vulnerable versions of the package (the ones before version 2.2) can be installed on Ubuntu 16.04 and RHEL 7. Unfortunately, the Ubuntu and RHEL vulnerability feeds do not include this CVE . The reason, as expected, is that their repositories do not provide this software package.
At this point we wonder if the NVD includes this vulnerability. Which data feed should we trust? The answer presents another challenge for proper vulnerability detection: data correlation.
Vulnerability Detector architecture and workflow
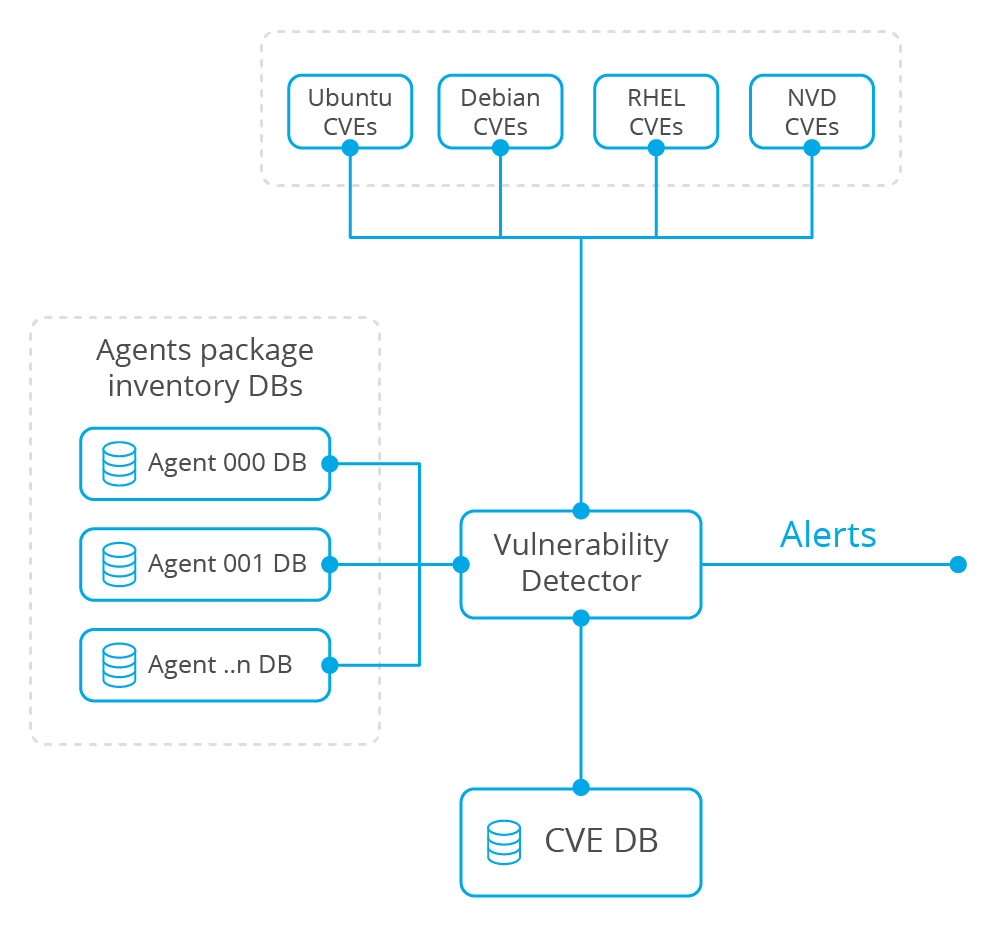
The next diagram depicts the Vulnerability Detector architecture. This Wazuh component has been designed to simplify the addition of new vulnerability data sources, so support for other platforms and vendors can be added in the future.
At first, the Vulnerability Detector module downloads and stores all vulnerabilities data from different sources. Then, it analyzes the list of software packages installed on each monitored endpoint, previously gathered by the Wazuh agent component. This analysis is done correlating information from the different data sources, generating alerts when a software package is identified as vulnerable.
Analysis workflow
To fully understand the process of data correlation, let’s see step by step what the Vulnerability Detector module is doing when analyzing a list of Linux packages.
- At first, it reads the list of packages installed on the monitored endpoint. This information is collected by the Wazuh agent.
- For each software package, using the Linux vendors and NVD feeds, it now looks for CVEs with the same package name.
- When the package name is affected, it now checks that the package version is also reported as vulnerable in the CVE report.
- When both software attributes, the package name and its version, are reported as vulnerable then correlation is done looking for false positives. Alerts are discarded when:
- For a CVE reported by the NVD, the Linux vendor states that the package is patched or not affected.
- For a CVE that requires multiple software packages present, one or more packages are missing.
- For a CVE reported by a Linux vendor, the NVD identifies the software as not affected.
- Finally, after the correlation is done, the Vulnerability Detector module alerts on vulnerable software when necessary.
Reviewing detected vulnerabilities in the UI
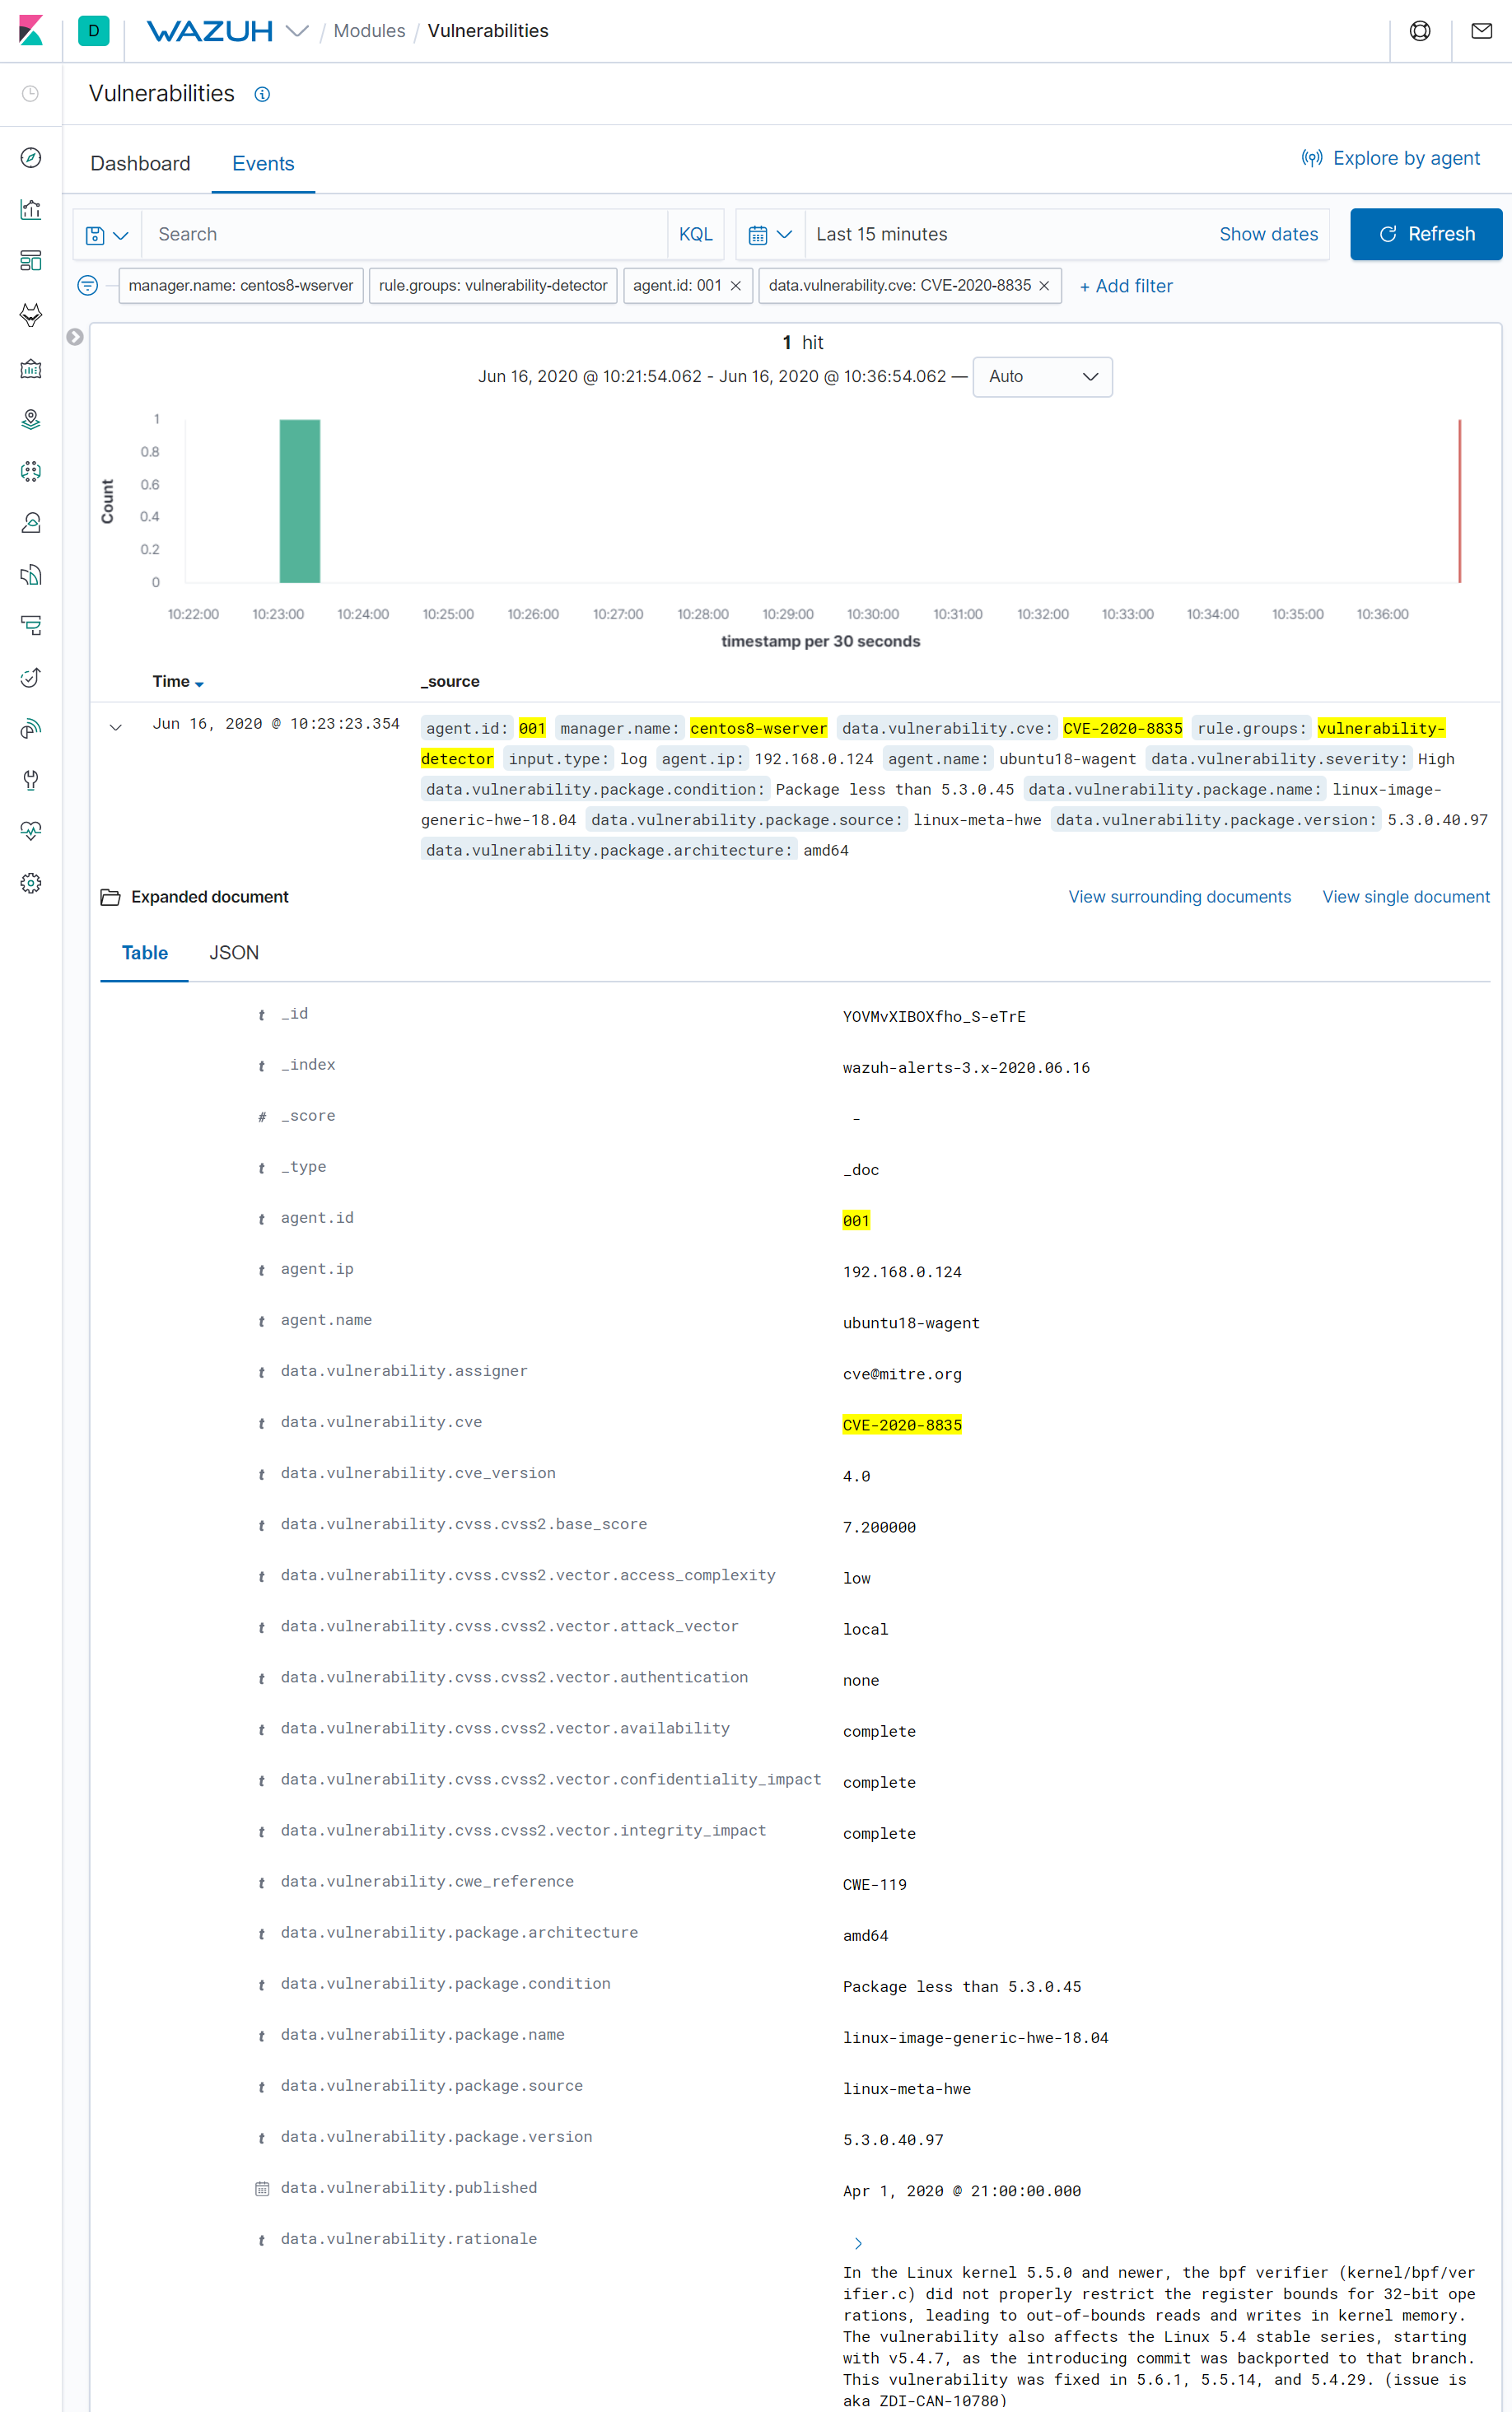
After the process mentioned above is completed, we can find the CVE alerts in the Wazuh User Interface. To see the details of these alerts, let’s take an interesting example: the CVE-2020-8835.
This is a Linux kernel vulnerability that affects the BPF (Berkeley Packet Filter) component and can be used to achieve local privilege escalation in Ubuntu systems. It was exploited during the recent Pwn2Own 2020 computer hacking contest, to go from a standard user to root.
Conclusion
The correlation of the vulnerability data, provided by each Linux vendor and NVD feeds, gives Wazuh the ability to report known CVEs for software packages that are not provided by the official Linux vendor repositories. Besides, it shortens the detection time to the fastest CVE publisher and helps discard false positives. Finally, it enriches the data provided by the alerts, giving users more context around the detected vulnerabilities.
References
- Ubuntu OVAL Data
- Debian OVAL Data
- Red Hat CVE Database
- NVD Vulnerabilities Database
- Zero Day Initiative – PWN2OWN 2020
- Zero Day Initiative – CVE-2020-8835: Linux kernel privilege escalation
If you have any questions about this, don’t hesitate to check out our documentation to learn more about Wazuh or join our community where our team and contributors will help you.
The post Detecting vulnerable software on Linux systems appeared first on Wazuh.
Wazuh 4.0 released
We are glad to announce that Wazuh 4.0.0 is released. Discover the new additions and improvements here! Wazuh is now better than ever.
New features and changes in Wazuh 4.0
The Wazuh API is now a part of the Wazuh manager package. Its performance has been improved, it incorporates role-based access control (RBAC) capabilities and it is easier to use and deploy.
The manager and agent’s default communication protocol is now TCP. This change guarantees a reliable delivery of the data collected by the agents, the pushing of centralized configuration settings in real-time and faster execution of active responses.
This version includes a new feature for agent auto-enrollment. Now agents automatically request a registration key when needed, preventing them from losing their connection with the Wazuh manager when keys are lost or corrupted.
API RBAC (Role-Based Access Control)
The Wazuh API now includes role-based access control. This feature manages the access to API endpoints, using policies and user roles. It also allows role and policy assignments to users that will fulfill different functions in the environment.
You can access the RBAC configuration menu on the Wazuh WUI on Wazuh > Security
This capability will, for example, allow the access restriction of a user to the FIM monitored files of a group of agents. You can read here more about how to add roles to users.
Agents auto-enrollment
There is no need to request a key using an external CLI because the agents can now request the key autonomously. When an agent has a manager IP defined on its ossec.conf it will automatically request the key to the manager if does not have a valid key at startup.
The auto-enrollment functionality also allows the agent to request a new key in case of losing the connection with the manager. If this happens, the agent will check if the manager is defined on theossec.conf and if it is, it will request a new key by default every 10 seconds up to 5 consecutive times. Both the number of request attempts and the frequency these keys are requested can be customized on the ossec.conf.
The agent enrollment can still be done using the agent-auth, but with the auto-enrollment, there is no need to request the key. It is worth mentioning that all the agents from previous versions are still 100 % compatible with the 4.x version.
FIM: Disk quota limitations
FIM implements a group of settings to control the module temporal files disk usage. This means that we can now choose the amount of disk space used by the report change utility. The diff option reports changes in the monitored files by creating a compressed copy of the file and checking if it changes. This method may use a lot of disk space depending on the number of files monitored, so this new setting will help prevent this situation by allowing the user to set limits. Wazuh 4.0 introduces new capabilities to limit the space used:
disk_quota: This field specifies the total amount of space thediffutility can use. By default, this value is set to 1GB.file_size: This option limits the file size which will reportdiffinformation. Files bigger than this limit will not reportdiffinformation. By default, this limit is set to 50MB.
Here is an example of how to use disk_quota and file_size:
    <diff>
        <disk_quota>
          <enabled>yes</enabled>
          <limit>1GB</limit>
        </disk_quota>
        <file_size>
          <enabled>yes</enabled>
          <limit>50MB</limit>
        </file_size>

        <nodiff>/etc/ssl/private.key</nodiff>
      </diff>
In addition, you can now monitor directories using environment variables. More information about how to set a list of directories to be monitored.
Wazuh Kibana plugin
The Wazuh Kibana plugin adds support for Open Distro for Elasticsearch v1.10.1 and Elastic Stack v7.9.1 and v7.9.2.
Apart from the RBAC support, this upgrade brings new configuration view settings for GCP integration and has expanded the supported deployment variables.
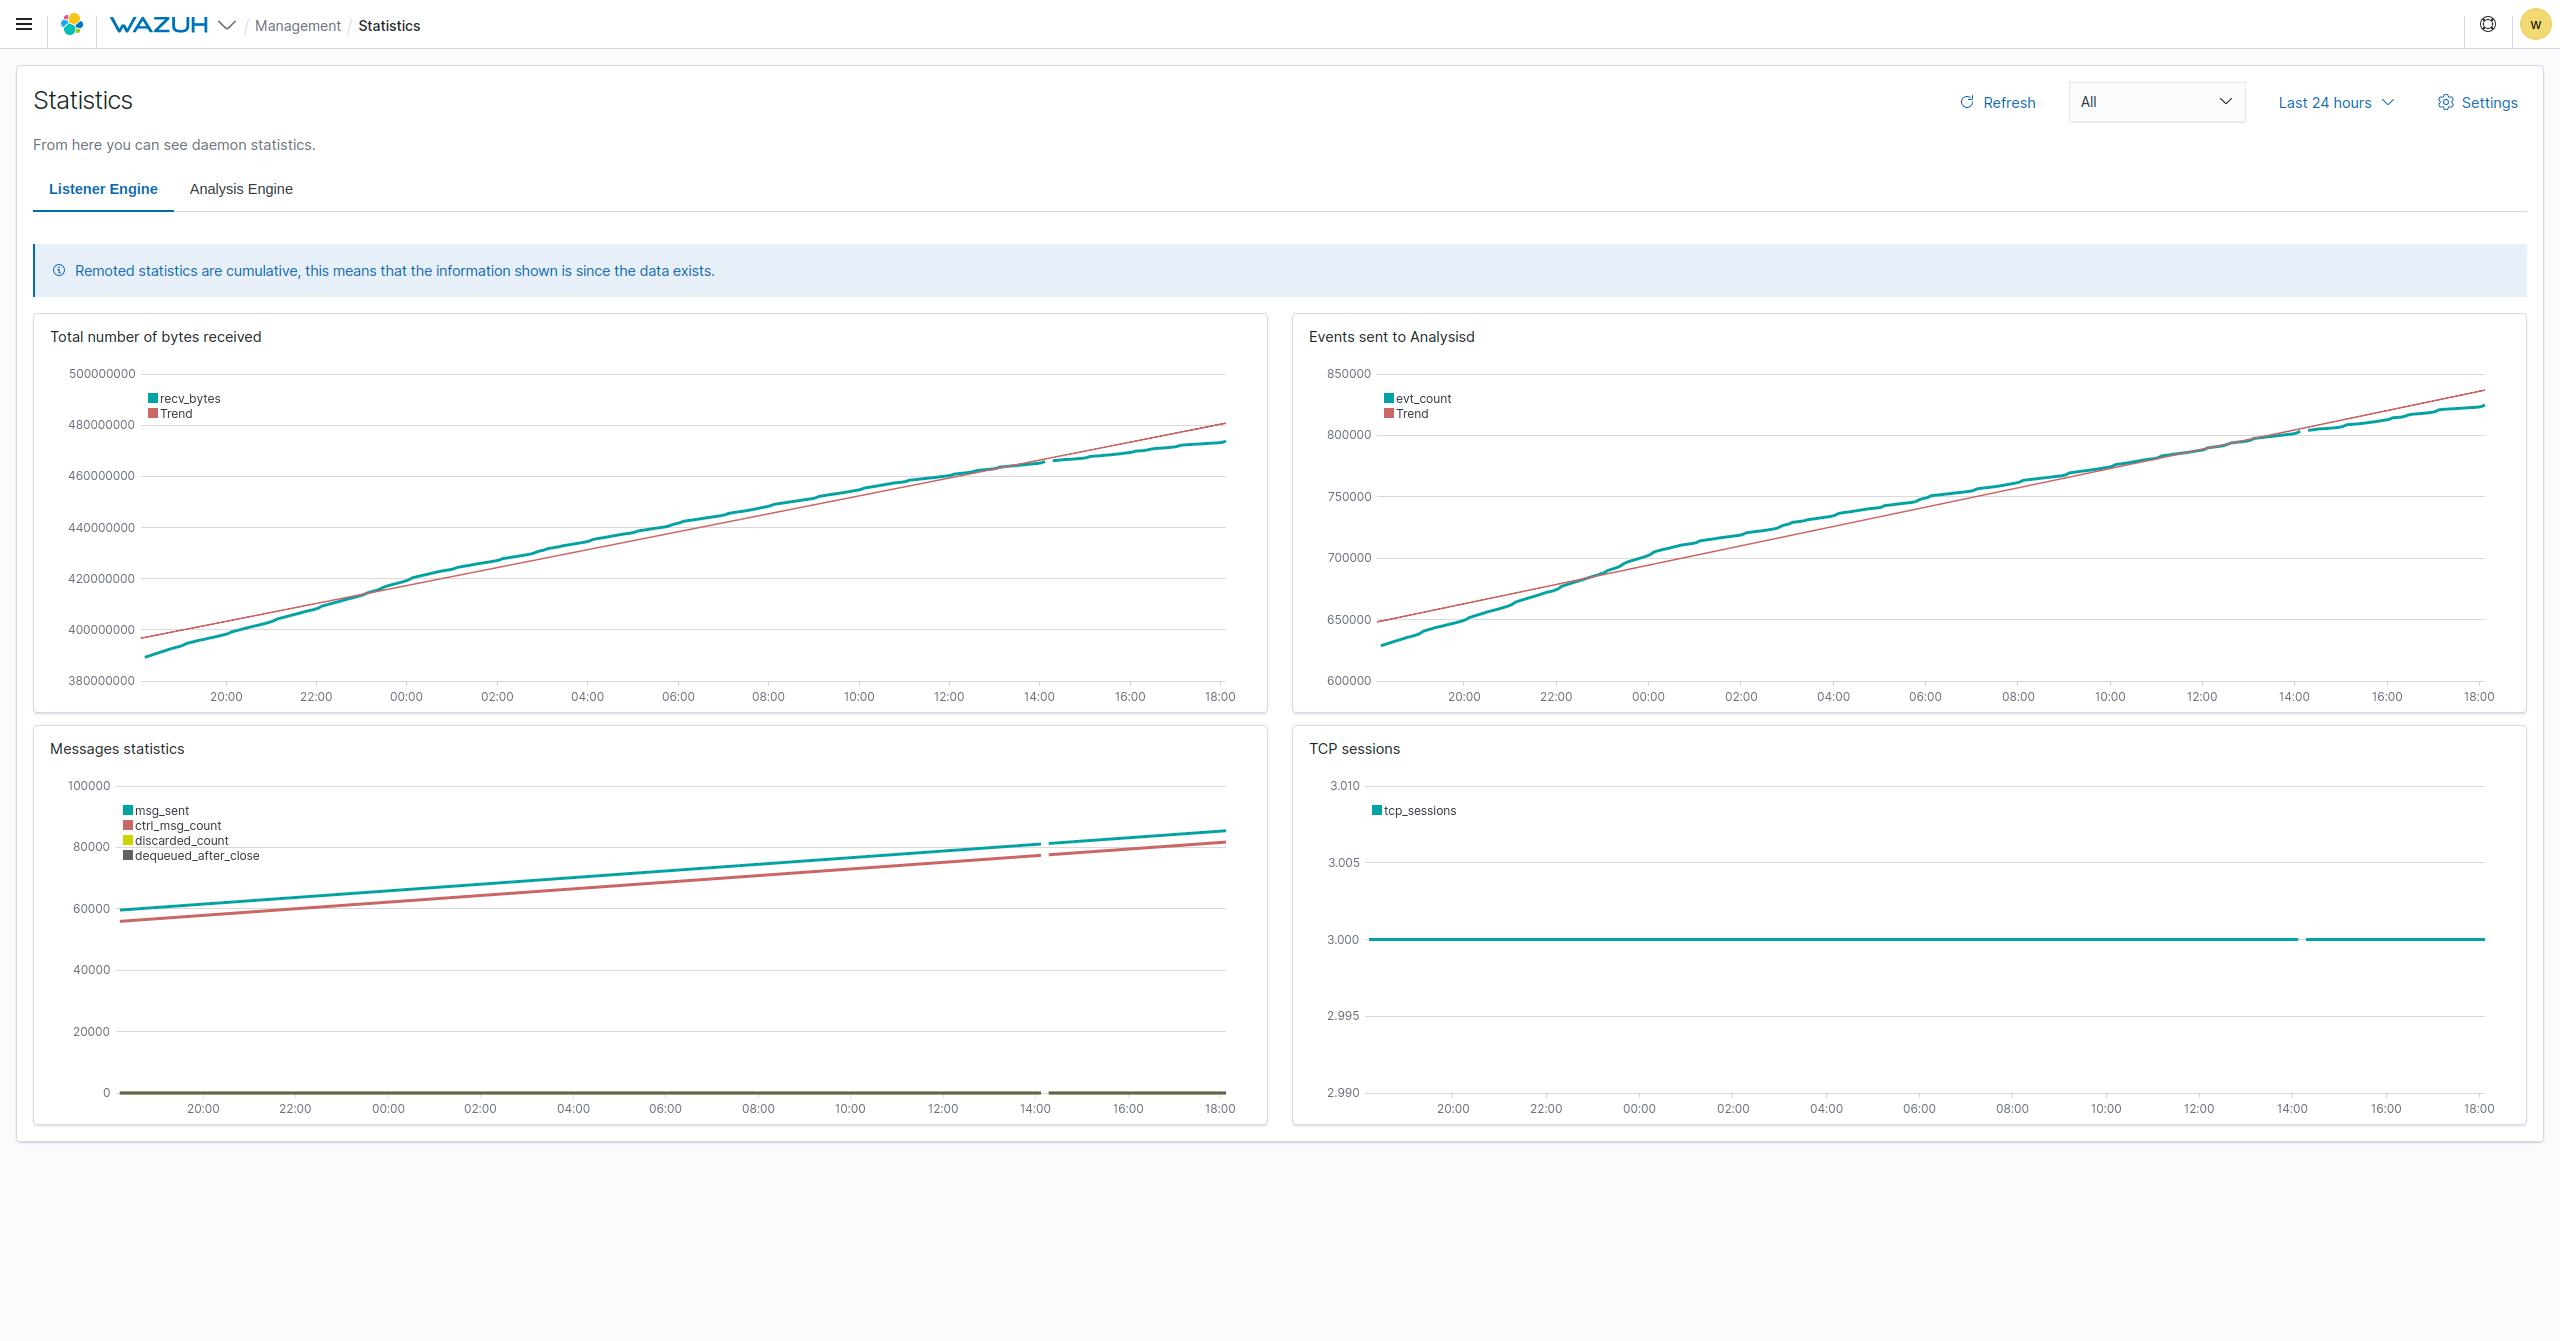
The Wazuh Kibana plugin also adds statistics for the listener engine:
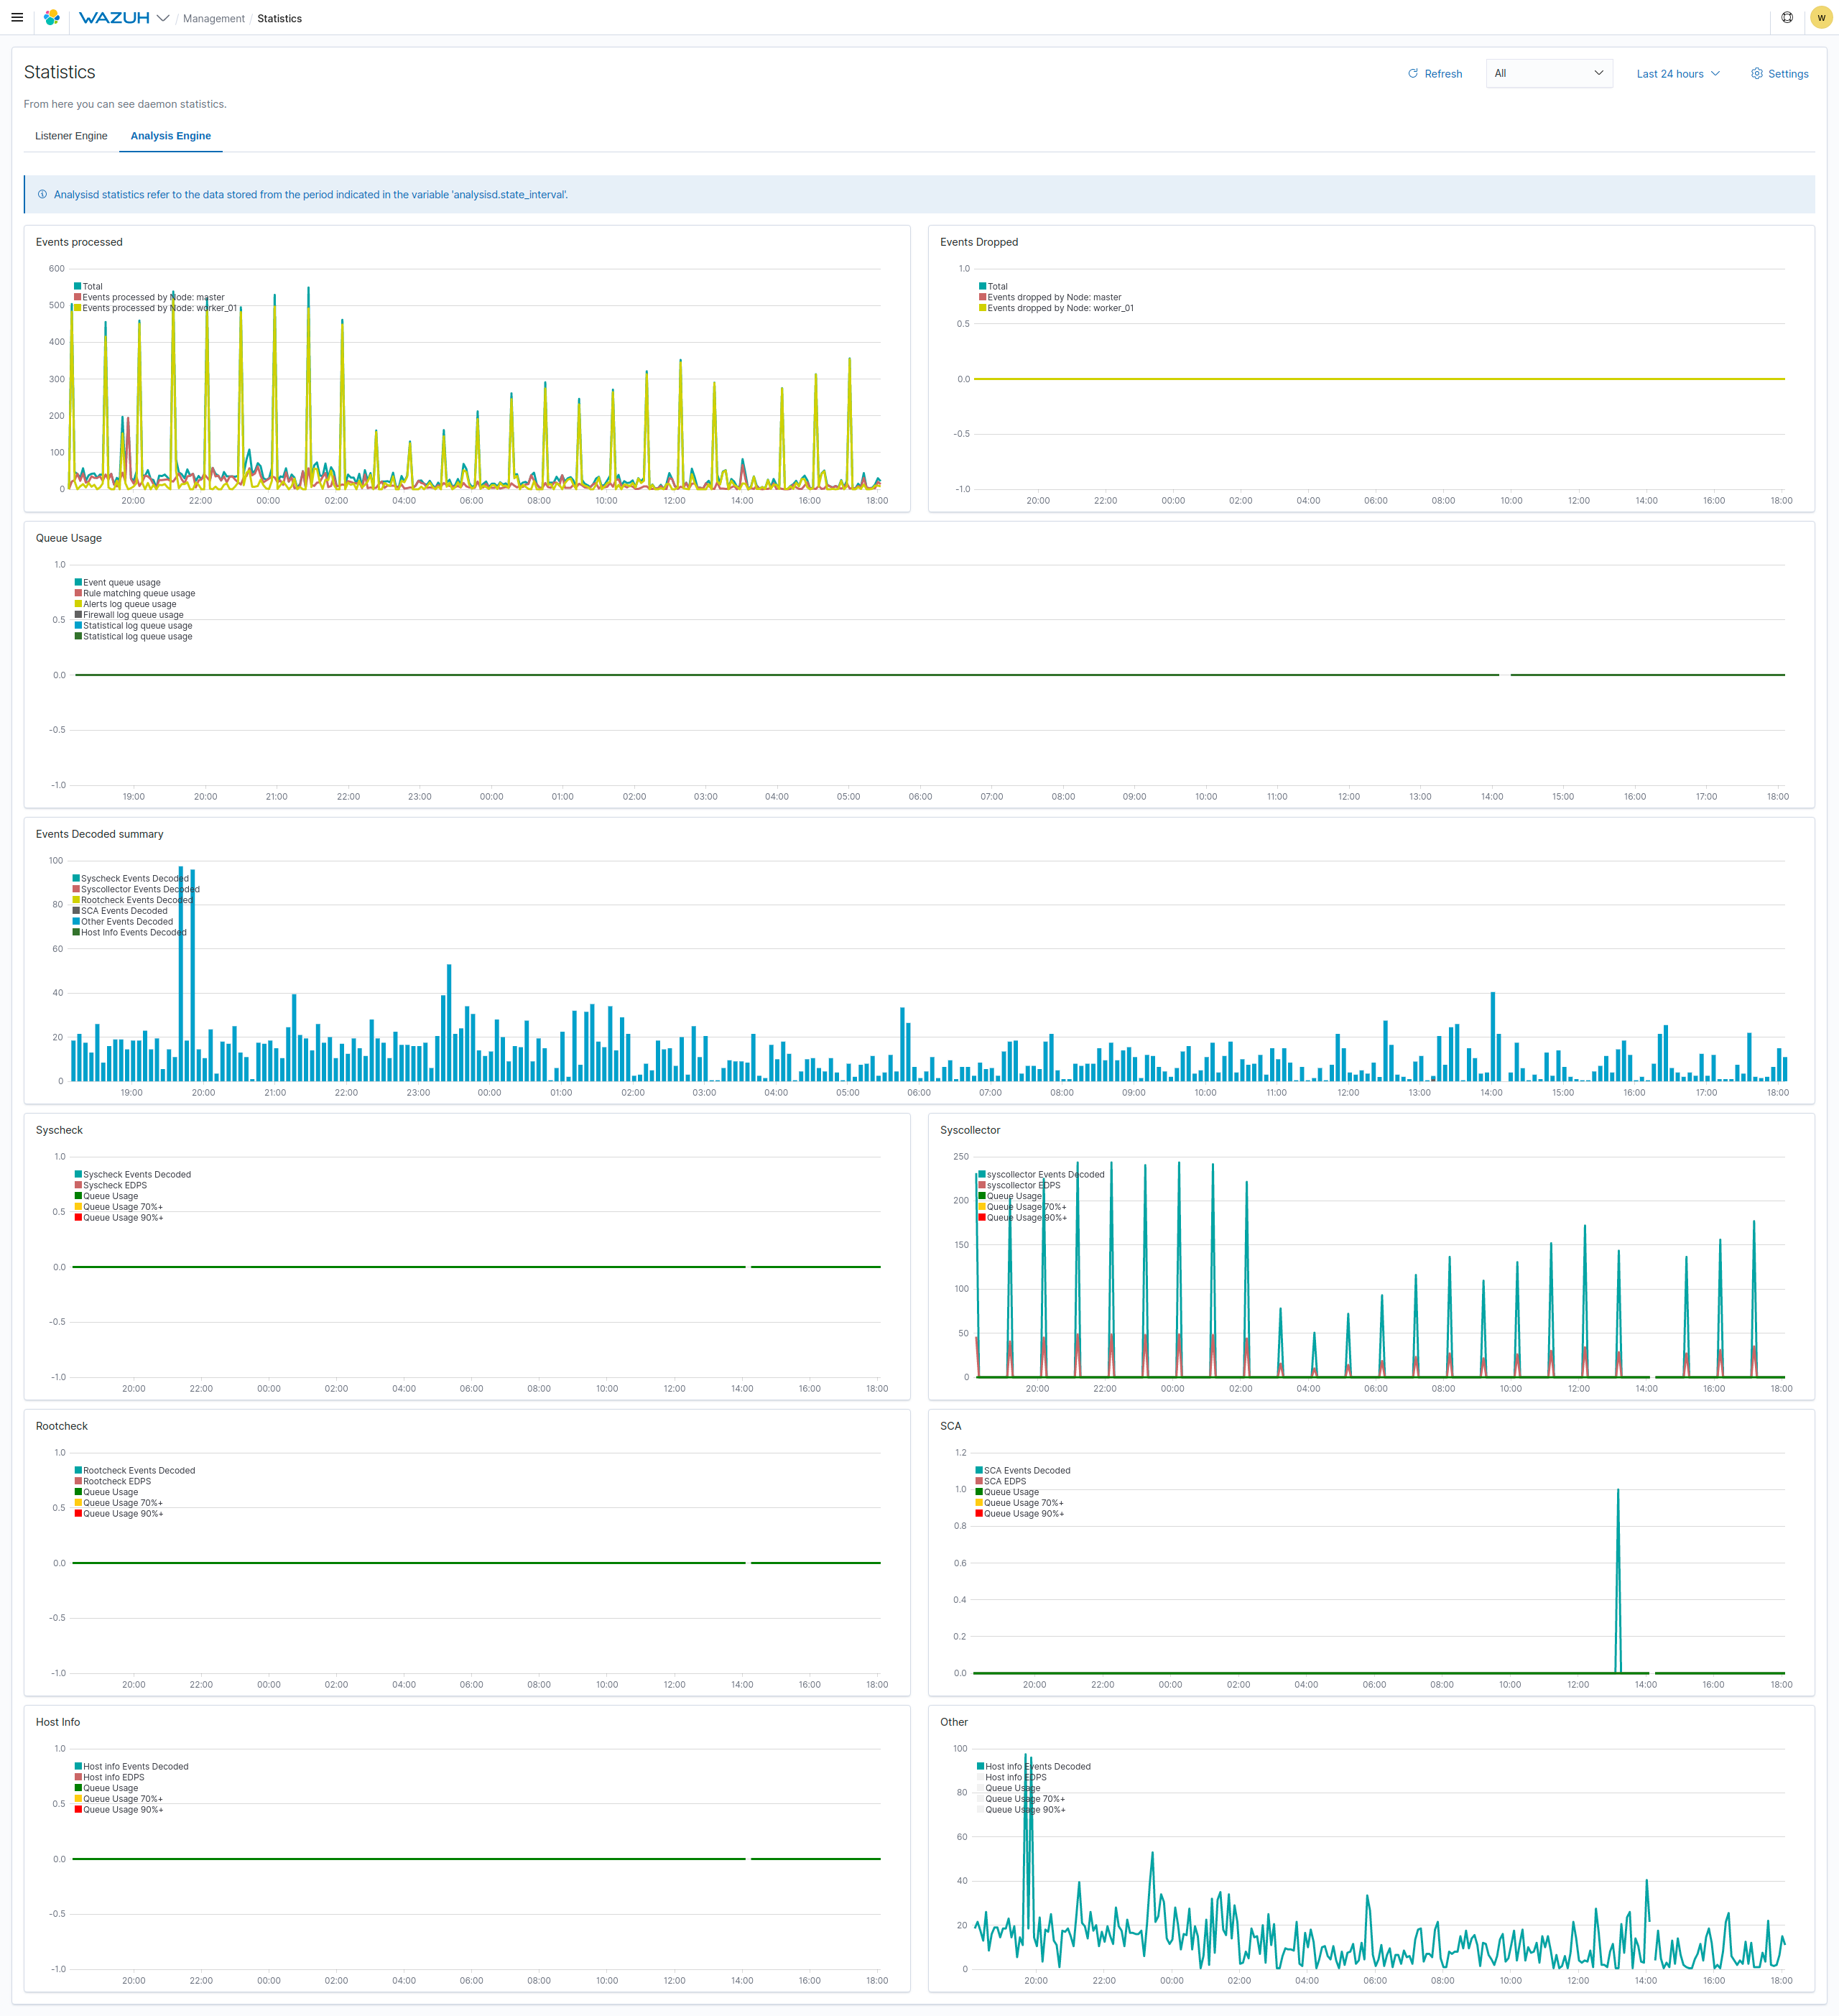
And the analysis engine:
To learn more about all the new features and changes in the Wazuh Kibana plugin, visit its repository.
More information and links about Wazuh 4.0
This release includes a lot more features, you can find more information in the following links:
If you have any questions about Wazuh 4.0, don’t hesitate to check out our documentation to learn more about Wazuh. You can also join our Slack and our mailing list where our team and other users will help you.
The post Wazuh 4.0 released appeared first on Wazuh.
Kerberos KDC の脆弱性 (CVE-2020-17049) に対応するためのガイダンス
マイクロソフトは、2020 年 11 月 10 日 (米国時間) に、Kerberos KDC (Key Distribution Center) に対する脆弱性情報 CVE-2020-17049 を公
Monitoring GKE audit logs
Kubernetes (K8s) is an open-source system for automating deployment, scaling, and managing containerized applications. Today, it is the most widely used container orchestration platform. This is why monitoring GKE audit logs on your Kubernetes infrastructure is vital for improving your security posture, detecting possible intrusions, and identifying unauthorized actions.
The first step to gain visibility into your Kubernetes deployment is to monitor its audit logs. They provide a security-relevant chronological set of records, documenting the sequence of activities that have taken place in the system.
Depending on your Kubernetes infrastructure, you can use one of these two different options to monitor your audit logs:
- Self managed infrastructure. In this case you have full access to the Kubernetes cluster and you control the configuration of all of its components. In this scenario, to monitor your audit logs, please follow this previous Auditing Kubernetes blog post.
- Provider managed infrastructure. In this case, the service provider handles the Kubernetes control plane for you. This is usually the case when using cloud services (e.g. Amazon AWS, Microsoft Azure, Google Cloud). Below, I will show you how to monitor Kubernetes audit logs when running Google Cloud GKE service.
Google Cloud configuration
This diagram illustrates the flow of information between the different Google Cloud components and Wazuh:
The rest of this section assumes that you have a GKE cluster running in your environment. If you don’t have one, and want to set up a lab environment, you can follow this quickstart.
Google Kubernetes Engine
Google Kubernetes Engine (GKE) provides a mechanism for deploying, managing, and scaling your containerized applications using Google infrastructure. Its main benefits are:
- Google Cloud load-balancing for Compute Engine instances.
- Node pools to run the same configuration in a subset of nodes.
- Automatic scaling of your cluster node instance count.
- Automatic upgrades for your cluster node software.
- Node auto-repair to maintain node health and availability.
- Logging and monitoring with Google Operations suite for visibility into your cluster.
Google Operations suite, formerly Stackdriver, is a central repository that receives logs, metrics, and application traces from Google Cloud resources. One of the tools included in this suite, the Google Audit Logs, maintains audit trails to help answer the questions of “who did what, where, and when?” within your GKE infrastructure.
Audit logs, the same as other logs, are automatically sent to the Cloud Logging API where they pass through the Logs Router. The Logs Router checks each log entry against existing rules to determine which log entries to ingest (store), which log entries to include in exports, and which log entries to discard.
Exporting audit logs involves writing a filter that selects the log entries that you want to export, and choosing one of the following destinations for them:
- Cloud Storage. Allows world-wide storage and retrieval of any amount of data at any time.
- BigQuery. Fully managed analytics data warehouse that enables you to run analytics over vast amounts of data in near real-time.
- Cloud Logging. Allows you to store, search, analyze, monitor, and alert on logging data.
- Pub/Sub. Fully-managed real-time messaging service that allows you to send and receive messages between independent applications.
Wazuh uses Pub/Sub to retrieve information from different services, including GKE audit logs.
Pub/Sub
Pub/Sub is an asynchronous messaging tool that decouples services that produce events from services that process events. You can use it as messaging-oriented middleware or event ingestion and delivery for streaming analytics pipelines.
The main concepts that you need to know are:
- Topic. A named resource to which messages are sent by publishers.
- Subscription. A named resource representing the stream of messages from a single, specific topic, to be delivered to the subscribing application.
- Message. The combination of data and (optional) attributes that a publisher sends to a topic and is eventually delivered to subscribers.
Topic
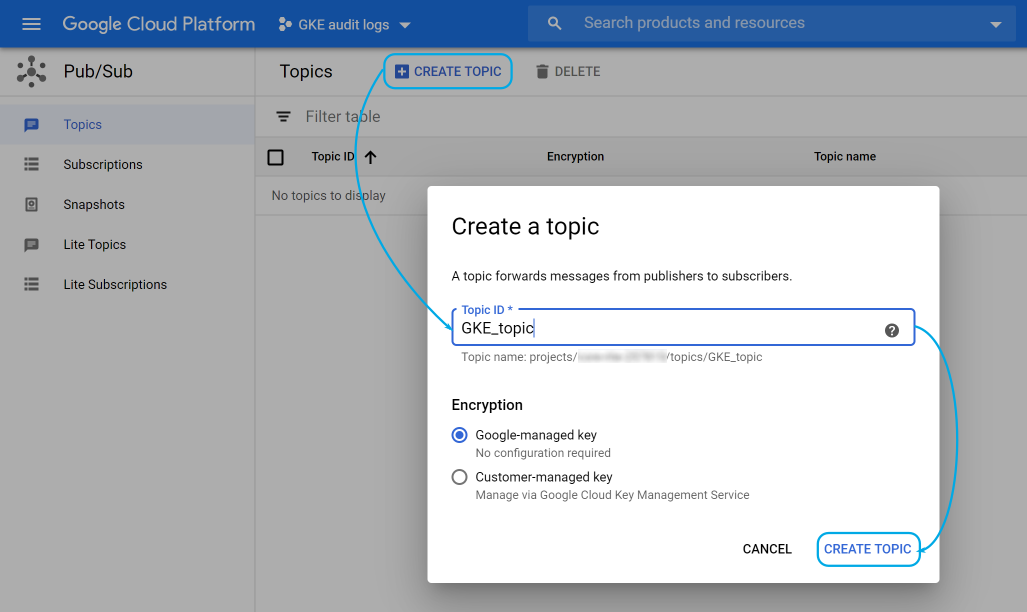
Before a publisher sends events to Pub/Sub you need to create a topic that will gather the information.
For this, go to the Pub/Sub > Topics section and click on Create topic, then give it a name:
Subscription
The subscription will then be used by the Wazuh module to read GKE audit logs.
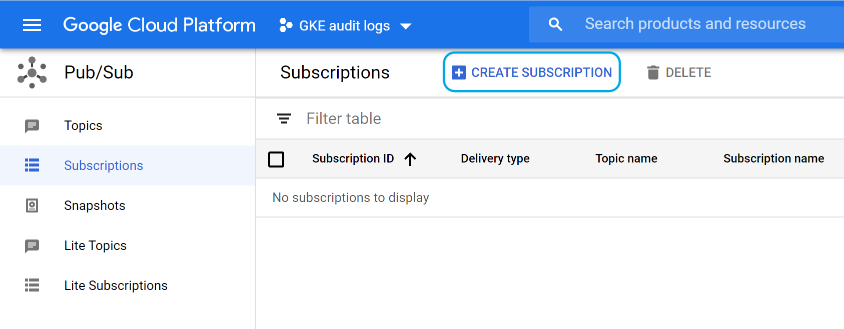
Navigate to the Pub/Sub > Subscriptions section and click on Create subscription:
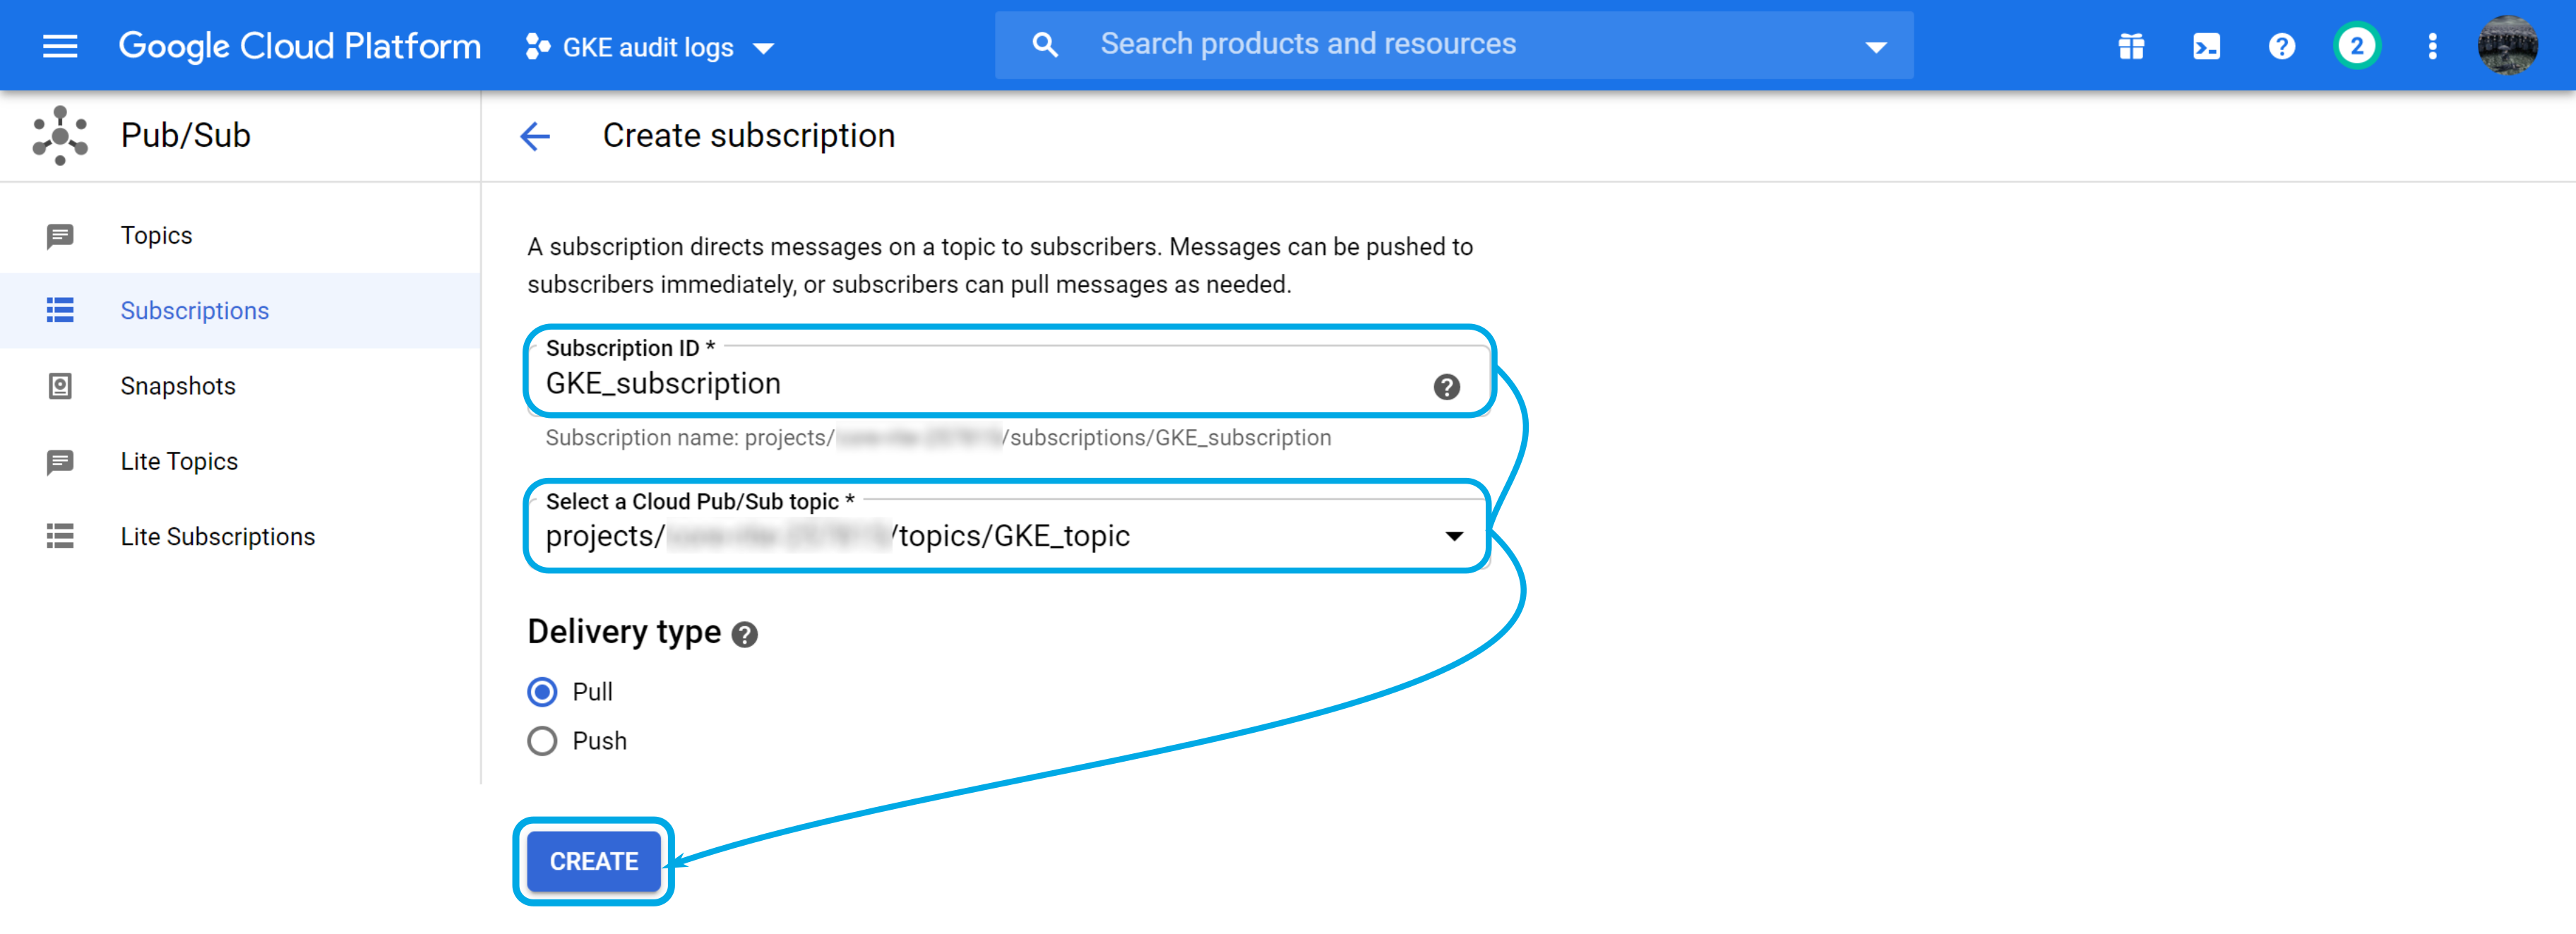
Next, fill in the Subscription ID, select the topic that you previously created, make sure that the delivery type is Pull, and click on Create:
Service account
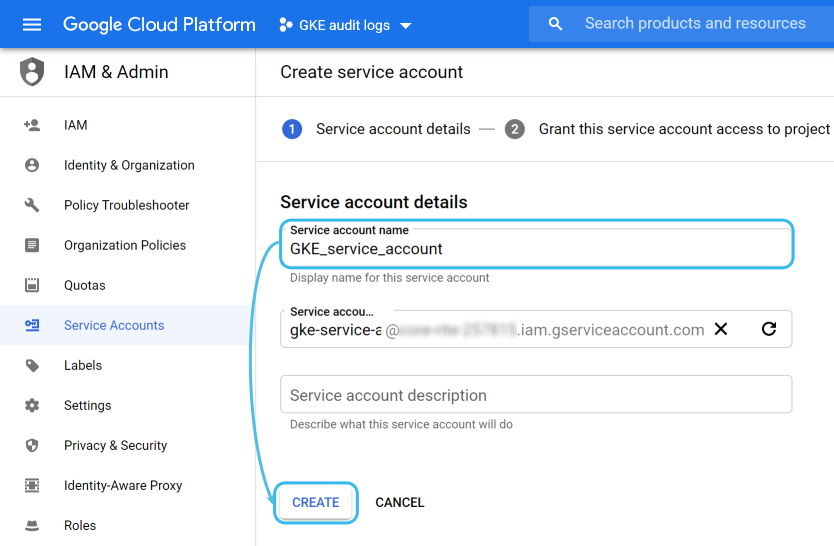
Google Cloud uses service accounts to delegate permissions to applications instead of persons. In this case, you will create one for the Wazuh module to access the previous subscription.
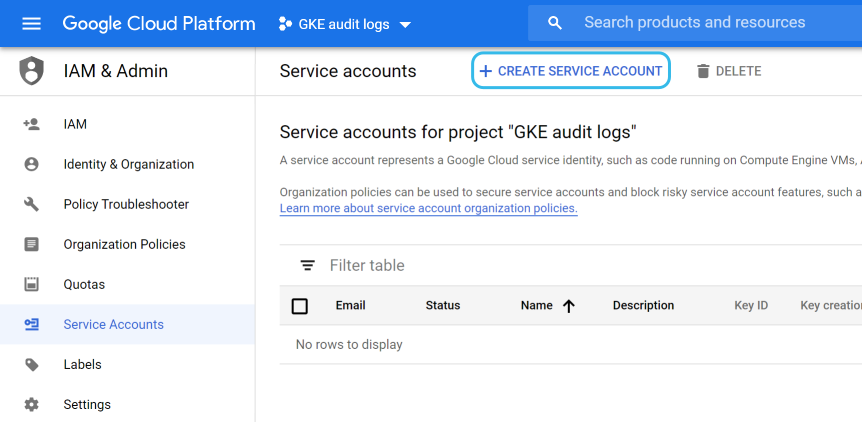
Go to IAM & Admin > Service accounts and click on Create service account:
Provide a name for it and optionally add a description:
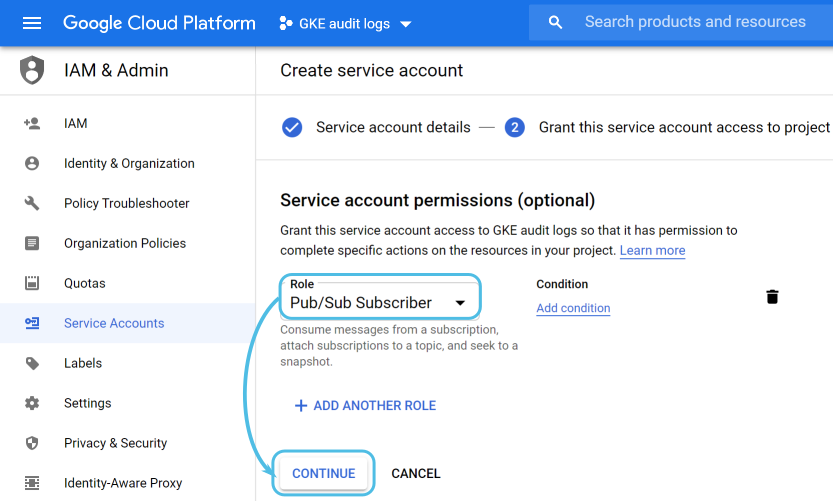
The next screen is used to add specific roles to the service account. For this use case, you want to choose the Pub/Sub Subscriber role:
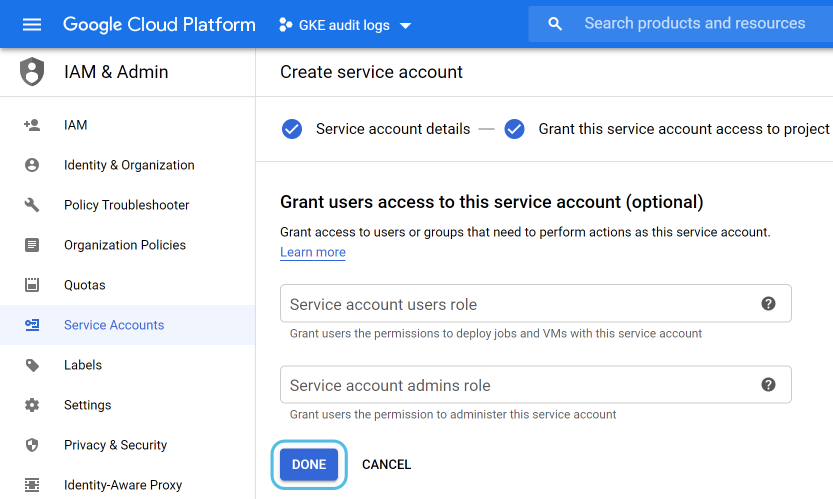
The last menu lets you grant users access to this service account if you consider it necessary:
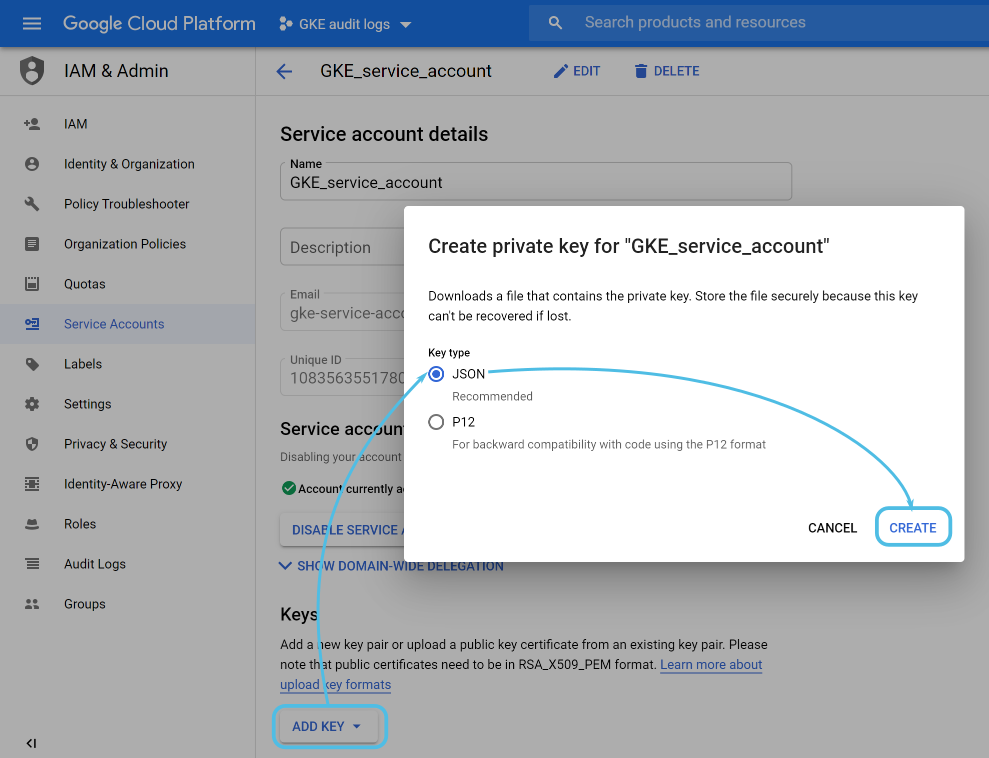
Once the service account is created you need to generate a key for the Wazuh module to use.
You can do this from IAM & Admin > Service accounts. Select the one that you just created, then click on Add key, and make sure that you select a JSON key type:
The Google cloud interface will automatically download a JSON file containing the credentials to your computer. You will use it later on when configuring the Wazuh module.
Log routing
Now that the Pub/Sub configuration is ready you need to publish the GKE audit logs to the Pub/Sub topic defined above.
Before you do that, it is worth mentioning that Google Cloud uses three types of audit logs for each of your projects:
- Admin activity. Contains log entries for API calls or other administrative actions that modify the configuration or metadata of resources.
- Data access. Contains API calls that read the configuration or metadata of resources, as well as user-driven API calls that create, modify, or read user-provided resource data.
- System event. Contains log entries for Google Cloud administrative actions that modify the configuration of resources. Not relevant to this use case.
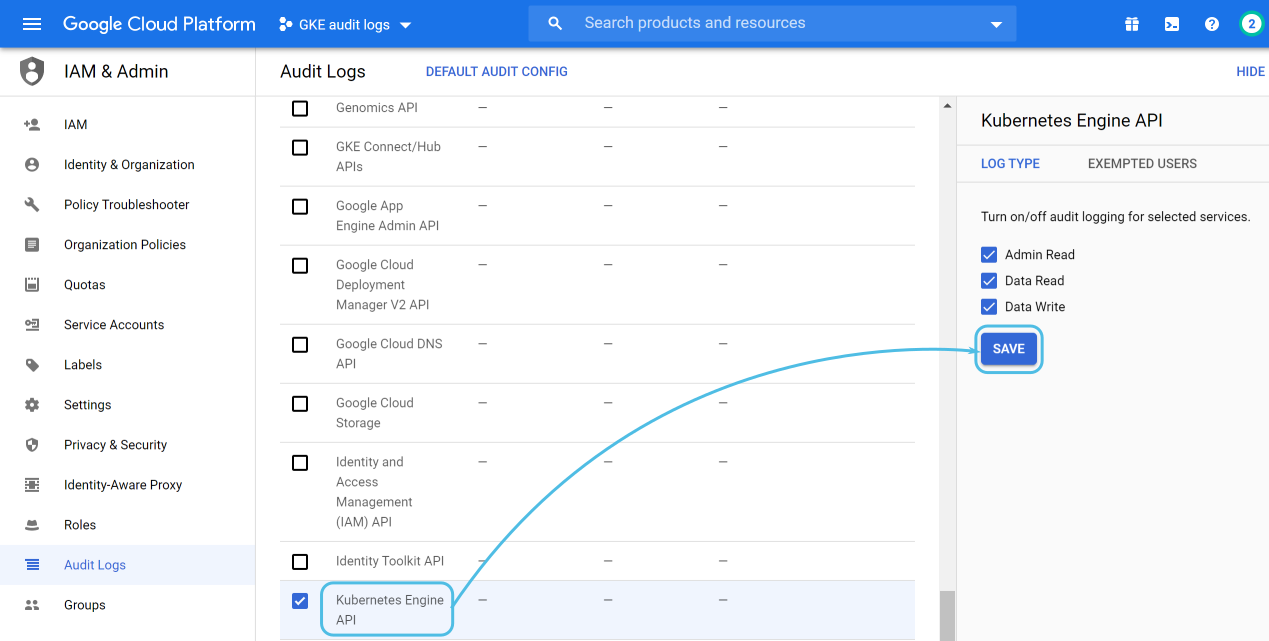
Admin activity logging is enabled by default, but if you want to enable data access logging there are additional steps to consider.
Go to IAM & Admin > Audit Logs and select Kubernetes Engine API, then turn on the log types that you wish to get information from and click on Save:
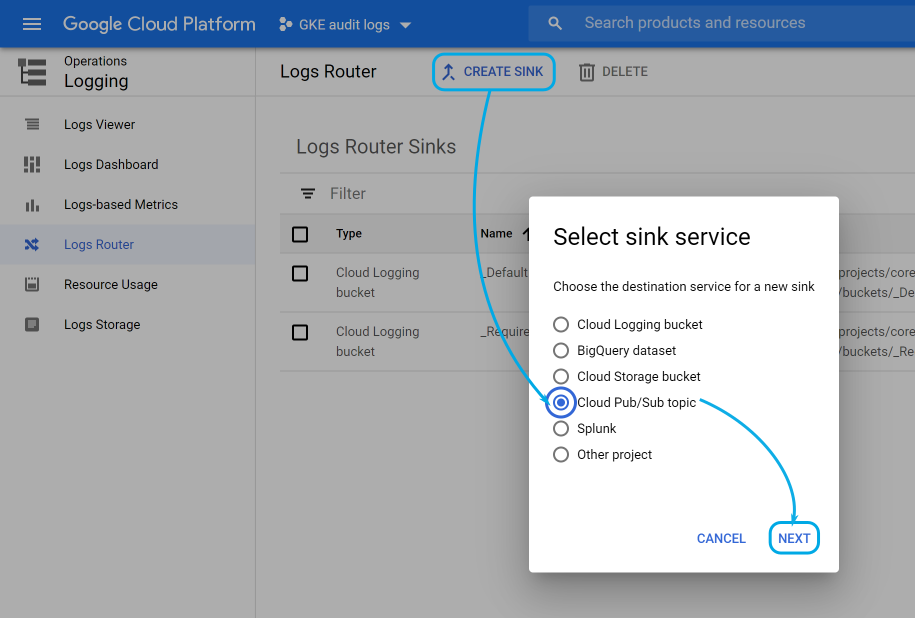
Now, for the log routing configuration, navigate to Logging > Logs Router and click on Create sink, choosing Cloud Pub/Sub topic as its destination:
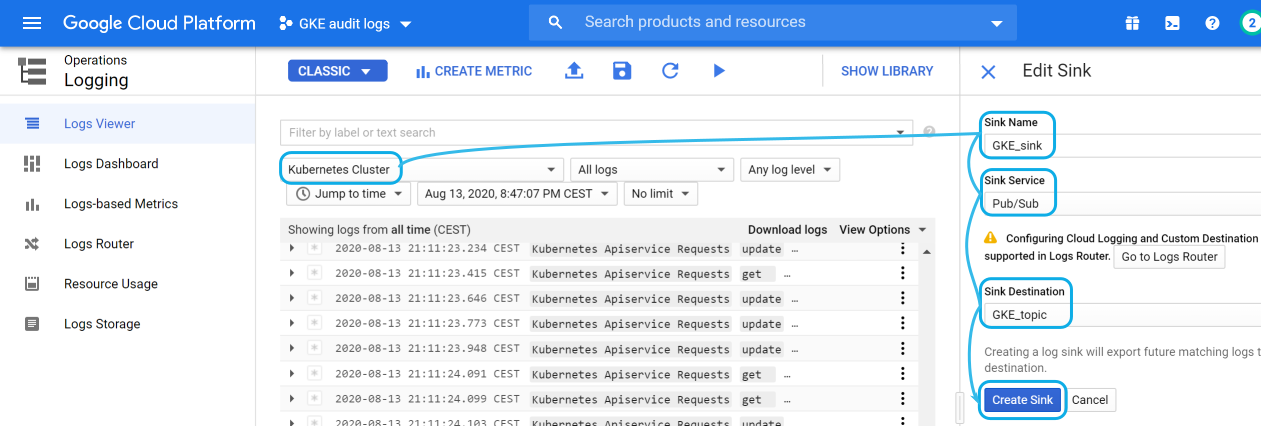
In the next menu, choose the logs filtered by the sink from a dropdown that lets you select different resources within your Google cloud project. Look for the Kubernetes Cluster resource type.
Finally, provide a name for the sink and, for the Sink Destination, select the topic that you previously created:
Wazuh configuration
The Wazuh module for Google Cloud monitoring can be configured in both the Wazuh manager and agent, depending on where you want to fetch the information from.
The Wazuh manager already includes all the necessary dependencies to run it. On the other hand, if you wish to run it on a Wazuh agent you will need:
- Python 3.6 or superior compatibility.
- Pip. Standard package-management system for Python.
- google-cloud-pubsub. Official python library to manage Google Cloud Pub/Sub resources.
Note: More information can be found at our GDP module dependencies documentation.
Keep in mind that, when using a Wazuh agent, there are two ways to add the configuration:
- Locally. Use the agent configuration file located at
/var/ossec/etc/ossec.conf. - Remotely. Use a configuration group defined on the Wazuh manager side. Learn more at our centralized configuration documentation.
On the other hand, if you decide to fetch GKE audit logs directly from the Wazuh manager, you can just add the GCP module configuration settings to its /var/ossec/etc/ossec.conf file.
The configuration settings for the Google Cloud module look like this:
<gcp-pubsub>
    <pull_on_start>yes</pull_on_start>
    <interval>1m</interval>
    <project_id>your_google_cloud_project_id</project_id>
    <subscription_name>GKE_subscription</subscription_name>
    <max_messages>1000</max_messages>
    <credentials_file>path_to_your_credentials.json</credentials_file>
</gcp-pubsub>
This is a breakdown of the settings:
pull_on_start. Start pulling data when the Wazuh manager or agent starts.interval. Interval between pulling.project_id. It references your Google Cloud project ID.subscription_name. The name of the subscription to read from.max_messages. Number of maximum messages pulled in each iteration.credentials_file. Specifies the path to the Google Cloud credentials file. This is the file generated when you added the key to the service account.
You can read about these settings in the GCP module reference section of our documentation.
After adding these changes don’t forget to restart your Wazuh manager or agent.
Use cases
This section assumes that you have some basic knowledge about Wazuh rules. For more information please refer to:
Also, because GKE audit logs use the JSON format, you don’t need to take care of decoding the event fields. This is because Wazuh provides a JSON decoder out of the box.
Monitoring API calls
The most basic use case is monitoring the API calls performed in your GKE cluster. Add the following rule to your Wazuh environment:
<group name="gke,k8s,">
  <rule id="400001" level="5">
    <if_sid>65000</if_sid>
    <field name="gcp.resource.type">k8s_cluster</field>
    <description>GKE $(gcp.protoPayload.methodName) operation.</description>
    <options>no_full_log</options>
  </rule>
</group>
Note: Restart your Wazuh manager after adding it.
This is the matching criteria for this rule:
- The parent rule for all Google Cloud rules, ID number
65000, has been matched. You can take a look at this rule in our GitHub repository. - The value in the
gcp.resource.typefield isk8s_cluster.
We will use this rule as the parent rule for every other GKE audit log.
As mentioned, Wazuh will automatically decode all of the fields in the original GKE audit log. The most important ones are:
methodName. Kubernetes API endpoint that was executed.resourceName. Name of the resource related to the request.principalEmail. User used in the request.callerIP. The request origin IP .receivedTimestamp. Time when the GKE cluster received the request.
Sample alerts:
{
	"timestamp": "2020-08-13T22:28:00.212+0000",
	"rule": {
		"level": 5,
		"description": "GKE io.k8s.core.v1.pods.list operation.",
		"id": "400001",
		"firedtimes": 123173,
		"mail": false,
		"groups": ["gke", "k8s"]
	},
	"agent": {
		"id": "000",
		"name": "wazuh-manager-master"
	},
	"manager": {
		"name": "wazuh-manager-master"
	},
	"id": "1597357680.1153205561",
	"cluster": {
		"name": "wazuh",
		"node": "master"
	},
	"decoder": {
		"name": "json"
	},
	"data": {
		"integration": "gcp",
		"gcp": {
			"insertId": "sanitized",
			"labels": {
				"authorization": {
					"k8s": {
						"io/decision": "allow"
					}
				}
			},
			"logName": "projects/sanitized/logs/cloudaudit.googleapis.com%2Fdata_access",
			"operation": {
				"first": "true",
				"id": "sanitized",
				"last": "true",
				"producer": "k8s.io"
			},
			"protoPayload": {
				"@type": "type.googleapis.com/google.cloud.audit.AuditLog",
				"authenticationInfo": {
					"principalEmail": "[email protected]"
				},
				"authorizationInfo": [{
					"granted": true,
					"permission": "io.k8s.core.v1.pods.list",
					"resource": "core/v1/namespaces/default/pods"
				}],
				"methodName": "io.k8s.core.v1.pods.list",
				"requestMetadata": {
					"callerIp": "sanitized",
					"callerSuppliedUserAgent": "GoogleCloudConsole"
				},
				"resourceName": "core/v1/namespaces/default/pods",
				"serviceName": "k8s.io"
			},
			"receiveTimestamp": "2020-08-13T22:27:54.003292831Z",
			"resource": {
				"labels": {
					"cluster_name": "wazuh",
					"location": "us-central1-c",
					"project_id": "sanitized"
				},
				"type": "k8s_cluster"
			},
			"timestamp": "2020-08-13T22:27:50.611239Z"
		}
	},
	"location": "Wazuh-GCloud"
}
{
	"timestamp": "2020-08-13T22:35:46.446+0000",
	"rule": {
		"level": 5,
		"description": "GKE io.k8s.apps.v1.deployments.create operation.",
		"id": "400001",
		"firedtimes": 156937,
		"mail": false,
		"groups": ["gke", "k8s"]
	},
	"agent": {
		"id": "000",
		"name": "wazuh-manager-master"
	},
	"manager": {
		"name": "wazuh-manager-master"
	},
	"id": "1597358146.1262997707",
	"cluster": {
		"name": "wazuh",
		"node": "master"
	},
	"decoder": {
		"name": "json"
	},
	"data": {
		"integration": "gcp",
		"gcp": {
			"insertId": "sanitized",
			"labels": {
				"authorization": {
					"k8s": {
						"io/decision": "allow"
					}
				}
			},
			"logName": "projects/sanitized/logs/cloudaudit.googleapis.com%2Factivity",
			"operation": {
				"first": "true",
				"id": "sanitized",
				"last": "true",
				"producer": "k8s.io"
			},
			"protoPayload": {
				"@type": "type.googleapis.com/google.cloud.audit.AuditLog",
				"authenticationInfo": {
					"principalEmail": "[email protected]"
				},
				"authorizationInfo": [{
					"granted": true,
					"permission": "io.k8s.apps.v1.deployments.create",
					"resource": "apps/v1/namespaces/default/deployments/nginx-1"
				}],
				"methodName": "io.k8s.apps.v1.deployments.create",
				"request": {
					"@type": "apps.k8s.io/v1.Deployment",
					"apiVersion": "apps/v1",
					"kind": "Deployment",
					"metadata": {
						"annotations": {
							"deployment": {
								"kubernetes": {
									"io/revision": "1"
								}
							},
							"kubectl": {
								"kubernetes": {
									"io/last-applied-configuration": "{"apiVersion":"apps/v1","kind":"Deployment","metadata":{"annotations":{"deployment.kubernetes.io/revision":"1"},"creationTimestamp":"2020-08-05T19:29:29Z","generation":1,"labels":{"app":"nginx-1"},"name":"nginx-1","namespace":"default","resourceVersion":"3312201","selfLink":"/apis/apps/v1/namespaces/default/deployments/nginx-1","uid":"sanitized"},"spec":{"progressDeadlineSeconds":600,"replicas":3,"revisionHistoryLimit":10,"selector":{"matchLabels":{"app":"nginx-1"}},"strategy":{"rollingUpdate":{"maxSurge":"25%","maxUnavailable":"25%"},"type":"RollingUpdate"},"template":{"metadata":{"creationTimestamp":null,"labels":{"app":"nginx-1"}},"spec":{"containers":[{"image":"nginx:latest","imagePullPolicy":"Always","name":"nginx-1","resources":{},"terminationMessagePath":"/dev/termination-log","terminationMessagePolicy":"File"}],"dnsPolicy":"ClusterFirst","restartPolicy":"Always","schedulerName":"default-scheduler","securityContext":{},"terminationGracePeriodSeconds":30}}},"status":{"availableReplicas":3,"conditions":[{"lastTransitionTime":"2020-08-05T19:29:32Z","lastUpdateTime":"2020-08-05T19:29:32Z","message":"Deployment has minimum availability.","reason":"MinimumReplicasAvailable","status":"True","type":"Available"},{"lastTransitionTime":"2020-08-05T19:29:29Z","lastUpdateTime":"2020-08-05T19:29:32Z","message":"ReplicaSet \"nginx-1-9c9488bdb\" has successfully progressed.","reason":"NewReplicaSetAvailable","status":"True","type":"Progressing"}],"observedGeneration":1,"readyReplicas":3,"replicas":3,"updatedReplicas":3}}n"
								}
							}
						},
						"creationTimestamp": "2020-08-05T19:29:29Z",
						"generation": "1",
						"labels": {
							"app": "nginx-1"
						},
						"name": "nginx-1",
						"namespace": "default",
						"selfLink": "/apis/apps/v1/namespaces/default/deployments/nginx-1",
						"uid": "sanitized"
					},
					"spec": {
						"progressDeadlineSeconds": "600",
						"replicas": "3",
						"revisionHistoryLimit": "10",
						"selector": {
							"matchLabels": {
								"app": "nginx-1"
							}
						},
						"strategy": {
							"rollingUpdate": {
								"maxSurge": "25%",
								"maxUnavailable": "25%"
							},
							"type": "RollingUpdate"
						},
						"template": {
							"metadata": {
								"creationTimestamp": "null",
								"labels": {
									"app": "nginx-1"
								}
							},
							"spec": {
								"containers": [{
									"image": "nginx:latest",
									"imagePullPolicy": "Always",
									"name": "nginx-1",
									"resources": {},
									"terminationMessagePath": "/dev/termination-log",
									"terminationMessagePolicy": "File"
								}],
								"dnsPolicy": "ClusterFirst",
								"restartPolicy": "Always",
								"schedulerName": "default-scheduler",
								"terminationGracePeriodSeconds": "30"
							}
						}
					},
					"status": {
						"availableReplicas": "3",
						"conditions": [{
							"lastTransitionTime": "2020-08-05T19:29:32Z",
							"lastUpdateTime": "2020-08-05T19:29:32Z",
							"message": "Deployment has minimum availability.",
							"reason": "MinimumReplicasAvailable",
							"status": "True",
							"type": "Available"
						}, {
							"lastTransitionTime": "2020-08-05T19:29:29Z",
							"lastUpdateTime": "2020-08-05T19:29:32Z",
							"message": "ReplicaSet "nginx-1-9c9488bdb" has successfully progressed.",
							"reason": "NewReplicaSetAvailable",
							"status": "True",
							"type": "Progressing"
						}],
						"observedGeneration": "1",
						"readyReplicas": "3",
						"replicas": "3",
						"updatedReplicas": "3"
					}
				},
				"requestMetadata": {
					"callerIp": "sanitized",
					"callerSuppliedUserAgent": "kubectl/v1.18.6 (linux/amd64) kubernetes/dff82dc"
				},
				"resourceName": "apps/v1/namespaces/default/deployments/nginx-1",
				"response": {
					"@type": "apps.k8s.io/v1.Deployment",
					"apiVersion": "apps/v1",
					"kind": "Deployment",
					"metadata": {
						"annotations": {
							"deployment": {
								"kubernetes": {
									"io/revision": "1"
								}
							},
							"kubectl": {
								"kubernetes": {
									"io/last-applied-configuration": "{"apiVersion":"apps/v1","kind":"Deployment","metadata":{"annotations":{"deployment.kubernetes.io/revision":"1"},"creationTimestamp":"2020-08-05T19:29:29Z","generation":1,"labels":{"app":"nginx-1"},"name":"nginx-1","namespace":"default","resourceVersion":"3312201","selfLink":"/apis/apps/v1/namespaces/default/deployments/nginx-1","uid":"sanitized"},"spec":{"progressDeadlineSeconds":600,"replicas":3,"revisionHistoryLimit":10,"selector":{"matchLabels":{"app":"nginx-1"}},"strategy":{"rollingUpdate":{"maxSurge":"25%","maxUnavailable":"25%"},"type":"RollingUpdate"},"template":{"metadata":{"creationTimestamp":null,"labels":{"app":"nginx-1"}},"spec":{"containers":[{"image":"nginx:latest","imagePullPolicy":"Always","name":"nginx-1","resources":{},"terminationMessagePath":"/dev/termination-log","terminationMessagePolicy":"File"}],"dnsPolicy":"ClusterFirst","restartPolicy":"Always","schedulerName":"default-scheduler","securityContext":{},"terminationGracePeriodSeconds":30}}},"status":{"availableReplicas":3,"conditions":[{"lastTransitionTime":"2020-08-05T19:29:32Z","lastUpdateTime":"2020-08-05T19:29:32Z","message":"Deployment has minimum availability.","reason":"MinimumReplicasAvailable","status":"True","type":"Available"},{"lastTransitionTime":"2020-08-05T19:29:29Z","lastUpdateTime":"2020-08-05T19:29:32Z","message":"ReplicaSet \"nginx-1-9c9488bdb\" has successfully progressed.","reason":"NewReplicaSetAvailable","status":"True","type":"Progressing"}],"observedGeneration":1,"readyReplicas":3,"replicas":3,"updatedReplicas":3}}n"
								}
							}
						},
						"creationTimestamp": "2020-08-13T22:30:03Z",
						"generation": "1",
						"labels": {
							"app": "nginx-1"
						},
						"name": "nginx-1",
						"namespace": "default",
						"resourceVersion": "7321553",
						"selfLink": "/apis/apps/v1/namespaces/default/deployments/nginx-1",
						"uid": "sanitized"
					},
					"spec": {
						"progressDeadlineSeconds": "600",
						"replicas": "3",
						"revisionHistoryLimit": "10",
						"selector": {
							"matchLabels": {
								"app": "nginx-1"
							}
						},
						"strategy": {
							"rollingUpdate": {
								"maxSurge": "25%",
								"maxUnavailable": "25%"
							},
							"type": "RollingUpdate"
						},
						"template": {
							"metadata": {
								"creationTimestamp": "null",
								"labels": {
									"app": "nginx-1"
								}
							},
							"spec": {
								"containers": [{
									"image": "nginx:latest",
									"imagePullPolicy": "Always",
									"name": "nginx-1",
									"resources": {},
									"terminationMessagePath": "/dev/termination-log",
									"terminationMessagePolicy": "File"
								}],
								"dnsPolicy": "ClusterFirst",
								"restartPolicy": "Always",
								"schedulerName": "default-scheduler",
								"terminationGracePeriodSeconds": "30"
							}
						}
					}
				},
				"serviceName": "k8s.io"
			},
			"receiveTimestamp": "2020-08-13T22:30:11.0687738Z",
			"resource": {
				"labels": {
					"cluster_name": "wazuh",
					"location": "us-central1-c",
					"project_id": "sanitized"
				},
				"type": "k8s_cluster"
			},
			"timestamp": "2020-08-13T22:30:03.273929Z"
		}
	},
	"location": "Wazuh-GCloud"
}
{
	"timestamp": "2020-08-13T22:35:43.388+0000",
	"rule": {
		"level": 5,
		"description": "GKE io.k8s.apps.v1.deployments.delete operation.",
		"id": "400001",
		"firedtimes": 156691,
		"mail": false,
		"groups": ["gke", "k8s"]
	},
	"agent": {
		"id": "000",
		"name": "wazuh-manager-master"
	},
	"manager": {
		"name": "wazuh-manager-master"
	},
	"id": "1597358143.1262245503",
	"cluster": {
		"name": "wazuh",
		"node": "master"
	},
	"decoder": {
		"name": "json"
	},
	"data": {
		"integration": "gcp",
		"gcp": {
			"insertId": "sanitized",
			"labels": {
				"authorization": {
					"k8s": {
						"io/decision": "allow"
					}
				}
			},
			"logName": "projects/sanitized/logs/cloudaudit.googleapis.com%2Factivity",
			"operation": {
				"first": "true",
				"id": "sanitized",
				"last": "true",
				"producer": "k8s.io"
			},
			"protoPayload": {
				"@type": "type.googleapis.com/google.cloud.audit.AuditLog",
				"authenticationInfo": {
					"principalEmail": "[email protected]"
				},
				"authorizationInfo": [{
					"granted": true,
					"permission": "io.k8s.apps.v1.deployments.delete",
					"resource": "apps/v1/namespaces/default/deployments/nginx-1"
				}],
				"methodName": "io.k8s.apps.v1.deployments.delete",
				"request": {
					"@type": "apps.k8s.io/v1.DeleteOptions",
					"apiVersion": "apps/v1",
					"kind": "DeleteOptions",
					"propagationPolicy": "Background"
				},
				"requestMetadata": {
					"callerIp": "sanitized",
					"callerSuppliedUserAgent": "kubectl/v1.18.6 (linux/amd64) kubernetes/dff82dc"
				},
				"resourceName": "apps/v1/namespaces/default/deployments/nginx-1",
				"response": {
					"@type": "core.k8s.io/v1.Status",
					"apiVersion": "v1",
					"details": {
						"group": "apps",
						"kind": "deployments",
						"name": "nginx-1",
						"uid": "sanitized"
					},
					"kind": "Status",
					"status": "Success"
				},
				"serviceName": "k8s.io"
			},
			"receiveTimestamp": "2020-08-13T22:29:41.400971862Z",
			"resource": {
				"labels": {
					"cluster_name": "wazuh",
					"location": "us-central1-c",
					"project_id": "sanitized"
				},
				"type": "k8s_cluster"
			},
			"timestamp": "2020-08-13T22:29:31.727777Z"
		}
	},
	"location": "Wazuh-GCloud"
}
Detecting forbidden API calls
Kubernetes audit logs include information about the decision made by the authorization realm for every request. This can be used to generate specific, and more severe alerts:
<group name="gke,k8s,">
  <rule id="400002" level="10">
    <if_sid>400001</if_sid>
    <field name="gcp.labels.authorization.k8s.io/decision">forbid</field>
    <description>GKE forbidden $(gcp.protoPayload.methodName) operation.</description>
    <options>no_full_log</options>
    <group>authentication_failure</group>
  </rule>
</group>
Note: Restart your Wazuh manager after adding the new rule.
As you can see, this is a child rule of the previous one, but now Wazuh will look for the value forbid within the gcp.labels.authorization.k8s.io/decision field in the GKE audit log.
Sample alert:
{
	"timestamp": "2020-08-17T17:37:24.766+0000",
	"rule": {
		"level": 10,
		"description": "GKE forbidden io.k8s.core.v1.namespaces.get operation.",
		"id": "400002",
		"firedtimes": 34,
		"mail": false,
		"groups": ["gke", "k8s", "authentication_failure"]
	},
	"agent": {
		"id": "000",
		"name": "wazuh-manager-master"
	},
	"manager": {
		"name": "wazuh-manager-master"
	},
	"id": "1597685844.137642087",
	"cluster": {
		"name": "wazuh",
		"node": "master"
	},
	"decoder": {
		"name": "json"
	},
	"data": {
		"integration": "gcp",
		"gcp": {
			"insertId": "sanitized",
			"labels": {
				"authorization": {
					"k8s": {
						"io/decision": "forbid"
					}
				}
			},
			"logName": "projects/gke-audit-logs/logs/cloudaudit.googleapis.com%2Fdata_access",
			"operation": {
				"first": "true",
				"id": "sanitized",
				"last": "true",
				"producer": "k8s.io"
			},
			"protoPayload": {
				"@type": "type.googleapis.com/google.cloud.audit.AuditLog",
				"authorizationInfo": [{
					"permission": "io.k8s.core.v1.namespaces.get",
					"resource": "core/v1/namespaces/kube-system",
					"resourceAttributes": {}
				}],
				"methodName": "io.k8s.core.v1.namespaces.get",
				"requestMetadata": {
					"callerIp": "sanitized",
					"callerSuppliedUserAgent": "kubectl/v1.14.1 (linux/amd64) kubernetes/b739410"
				},
				"resourceName": "core/v1/namespaces/kube-system",
				"serviceName": "k8s.io",
				"status": {
					"code": "7",
					"message": "PERMISSION_DENIED"
				}
			},
			"receiveTimestamp": "2020-08-17T17:37:21.457664025Z",
			"resource": {
				"labels": {
					"cluster_name": "wazuh",
					"location": "us-central1-c",
					"project_id": "sanitized"
				},
				"type": "k8s_cluster"
			},
			"timestamp": "2020-08-17T17:37:06.693205Z"
		}
	},
	"location": "Wazuh-GCloud"
}
Detecting a malicious actor
You can integrate Wazuh with threat intelligence sources, such as the OTX IP addresses reputation database, to detect if the origin of a request to your GKE cluster is a well-known malicious actor.
For instance, Wazuh can check if an event field is contained within a CDB list (constant database).
For this use case, please follow the CDB lists blog post as it will guide you to set up the OTX IP reputation list in your Wazuh environment.
Then add the following rule:
<group name="gke,k8s,">
  <rule id="400003" level="10">
    <if_group>gke</if_group>
    <list field="gcp.protoPayload.requestMetadata.callerIp" lookup="address_match_key">etc/lists/blacklist-alienvault</list>
    <description>GKE request originated from malicious actor.</description>
    <options>no_full_log</options>
    <group>attack</group>
  </rule>
</group>
Note: Restart your Wazuh manager to load the new rule.
This rule will trigger when:
- A rule from the
gkerule group triggers. - The field
gcp.protoPayload.requestMetadata.callerIP, which stores the origin IP for the GKE request, is contained within the CDB list.
Sample alert:
{
	"timestamp": "2020-08-17T17:09:25.832+0000",
	"rule": {
		"level": 10,
		"description": "GKE request originated from malicious source IP.",
		"id": "400003",
		"firedtimes": 45,
		"mail": false,
		"groups": ["gke", "k8s", "attack"]
	},
	"agent": {
		"id": "000",
		"name": "wazuh-manager-master"
	},
	"manager": {
		"name": "wazuh-manager-master"
	},
	"id": "1597684165.132232891",
	"cluster": {
		"name": "wazuh",
		"node": "master"
	},
	"decoder": {
		"name": "json"
	},
	"data": {
		"integration": "gcp",
		"gcp": {
			"insertId": "sanitized",
			"labels": {
				"authorization": {
					"k8s": {
						"io/decision": "allow"
					}
				}
			},
			"logName": "projects/gke-audit-logs/logs/cloudaudit.googleapis.com%2Fdata_access",
			"operation": {
				"first": "true",
				"id": "sanitized",
				"last": "true",
				"producer": "k8s.io"
			},
			"protoPayload": {
				"@type": "type.googleapis.com/google.cloud.audit.AuditLog",
				"authenticationInfo": {
					"principalEmail": "[email protected]"
				},
				"authorizationInfo": [{
					"granted": true,
					"permission": "io.k8s.core.v1.pods.list",
					"resource": "core/v1/namespaces/default/pods"
				}],
				"methodName": "io.k8s.core.v1.pods.list",
				"requestMetadata": {
					"callerIp": "sanitized",
					"callerSuppliedUserAgent": "kubectl/v1.18.6 (linux/amd64) kubernetes/dff82dc"
				},
				"resourceName": "core/v1/namespaces/default/pods",
				"serviceName": "k8s.io"
			},
			"receiveTimestamp": "2020-08-17T17:09:19.068723691Z",
			"resource": {
				"labels": {
					"cluster_name": "wazuh",
					"location": "us-central1-c",
					"project_id": "sanitized"
				},
				"type": "k8s_cluster"
			},
			"timestamp": "2020-08-17T17:09:05.043988Z"
		}
	},
	"location": "Wazuh-GCloud"
}
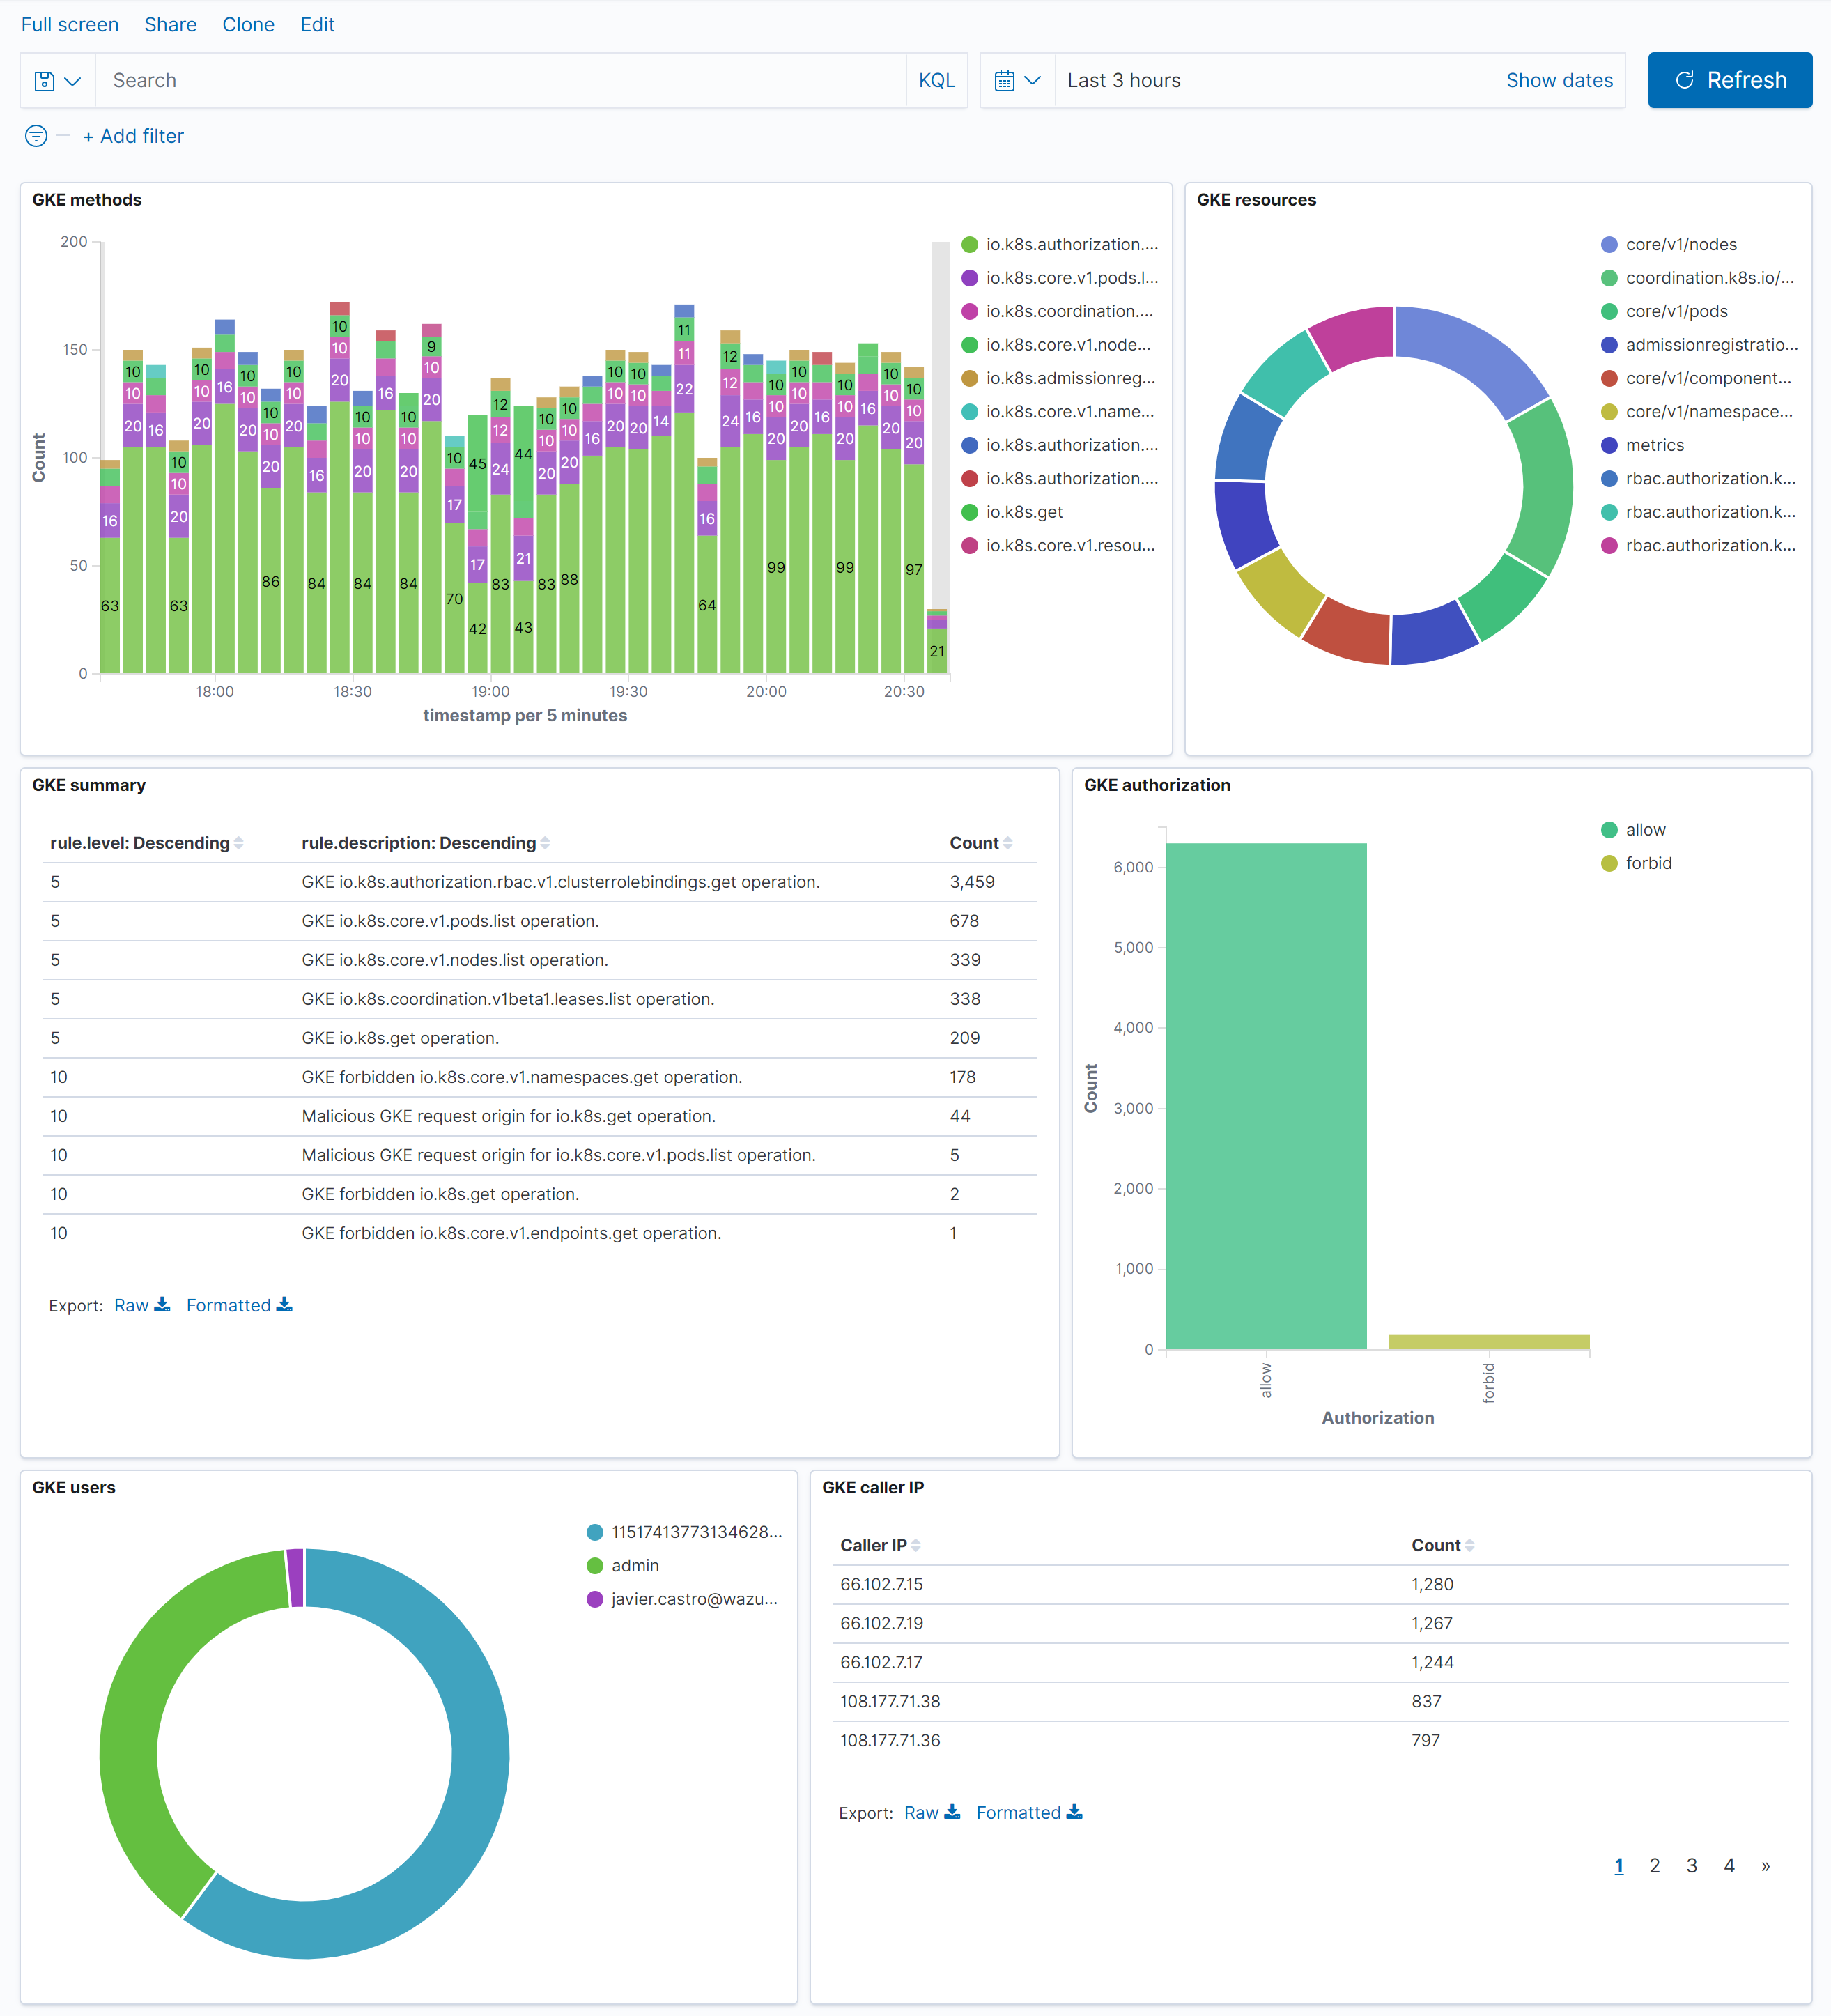
Custom dashboards
You can also create custom dashboards from GKE audit logs to easily query and address this information:
Refer in the following link for more information about custom dashboards.
References
- Kubernetes audit logs with Wazuh.
- Kubernetes audit logs.
- Google Kubernetes Engine.
- Google Cloud Pub/Sub.
- Google Cloud audit logs.
- Wazuh Google Cloud module.
The post Monitoring GKE audit logs appeared first on Wazuh.


