Month: <span>May 2020</span>

Integrating Amazon Macie in Wazuh

Amazon offers many tools to monitor the status of its services. A good example is Amazon Macie, aimed at the surveillance of stored data. This is a resource of enormous relevance in recent times and therefore it requires its correct treatment and protection.

There is no doubt that in order to protect the data, we must have a properly guarded system that is free from intruders and security breaches which could lead to improper access. Wazuh and its wide community provide the necessary tools in this regard.

If we have to access a different dashboard for each service we use (Amazon CloudTrail, Macie, GuardDuty, File Integrity Monitoring, etc.), the task becomes more difficult to carry out. Therefore, this time we are going to undertake the integration of Amazon Macie alerts in Kibana thanks to Wazuh, centralizing all the security information that we have in a single point.

Amazon Macie

Amazon Macie is a service responsible for detecting and classifying suspicious activities, intellectual property and unprotected personal or confidential data within S3 buckets. It uses machine learning to carry out those tasks and generates alerts that help the administrator to discover possible problems; Problems which could lead to exposure of data or even the loss of it.

The Amazon Macie activation process is fairly straightforward. You just have to follow a few steps that you can find detailed in its official guide.

Please note that in order to integrate events into Wazuh, they must be accessible from an S3 bucket. Macie by itself does not offer the possibility of storing the logs generated within it. In consequence, it is necessary to activate Amazon Kinesis, a tool that makes it easy to collect and save those logs in a bucket. Once this is done, Wazuh will read them and display the data in Kibana. You can find a detailed guide on how to activate Amazon Kinesis in our documentation.

Sending logs to Wazuh

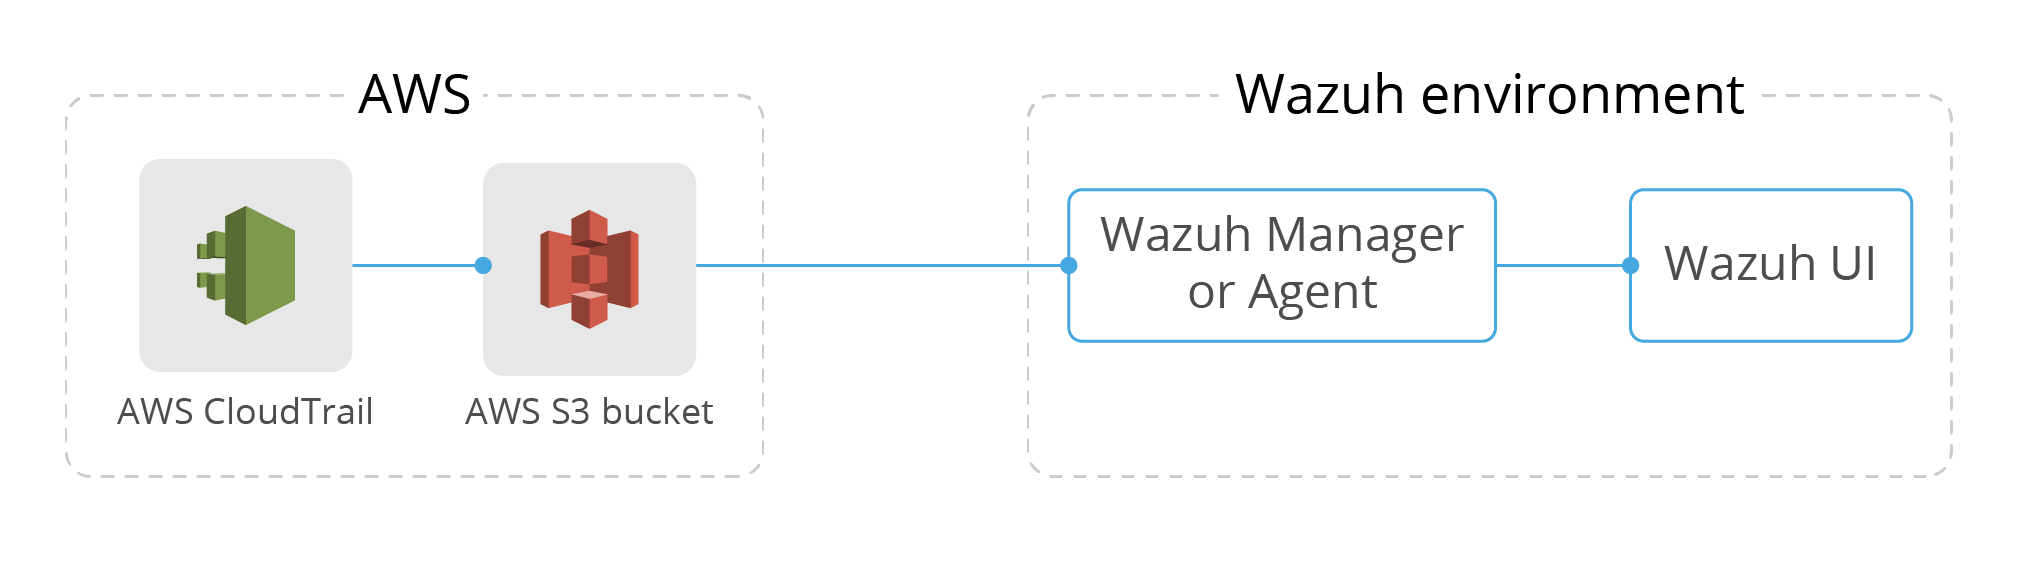
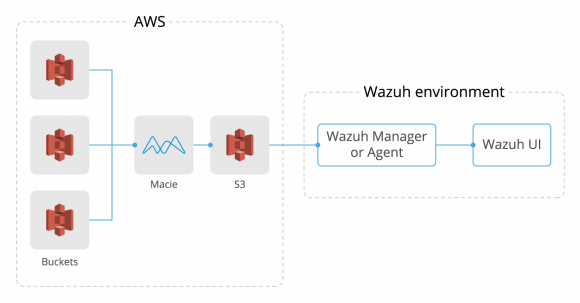
The workflow from the moment Amazon Macie generates events until they are displayed in the Wazuh UI is quite simple. First, Macie analyzes each configured bucket and generates the events based on the problems it finds, it then stores those events in a different bucket. Secondly, Wazuh will access that bucket to collect all the information stored there. The Wazuh AWS module saves in a database which logs have already been read, thus avoiding downloading the same event several times. At this point, if we add custom rules, alerts will be generated based on criteria that we ourselves establish.

We can also automate the execution of any action with integratord. For example, if we use it together with Boto3, it can automatically block any IP that is trying to access our S3 without permission. To configure this behaviour we can follow the example described in our post Monitoring AWS environments with Wazuh.

Finally, we can access the Wazuh UI to query those alerts. The following diagram represents, in summary, the flow that we have just described.

Diagram of the workflow between Amazon Macie and Wazuh.

Setting up Wazuh AWS module

Once Macie logs are stored in a bucket, it’s time to set up the AWS module in the Wazuh configuration file in order to collect them. Access the Wazuh agent (or manager) that will be in charge of this task, edit the configuration file <WAZUH_HOME>/etc/ossec.conf and add the following code block:

<wodle name="aws-s3">
  <disabled>no</disabled>
  <interval>10m</interval>
  <run_on_start>yes</run_on_start>
  <skip_on_error>yes</skip_on_error>
  <bucket type="custom">
    <name>wazuh-aws-wodle</name>
    <path>macie</path>
    <aws_profile>default</aws_profile>
  </bucket>
</wodle>

Remember that, as we already explained in our post Using CloudTrail to monitor AWS activity and in the documentation, you will need to add the AWS access credentials in a file located at ~/.aws/credentials. You can also find more detailed information about each AWS module configuration parameter in our documentation.

Note: It is possible to specify the credentials within the wodle configuration in ossec.conf. However, we do not recommend this option.

Now you only need to restart Wazuh and it will start reading the logs from Macie.

Checking if it works

Possibly, the easiest way to check that Macie alerts are being collected and processed correctly in Wazuh is to look them up in the Wazuh UI. However, we can find more detailed information and any related errors in the logs. If everything works fine, after restarting Wazuh we should find inside <WAZUH_HOME>/logs/ossec.log something similar to this:

2020/04/28 11:00:12 wazuh-modulesd:aws-s3: INFO: Module AWS started
2020/04/28 11:00:12 wazuh-modulesd:aws-s3: INFO: Starting fetching of logs.
2020/04/28 11:00:12 wazuh-modulesd:aws-s3: INFO: Executing Bucket Analysis: (Bucket: wazuh-aws-wodle, Path: macie, Type: custom, Profile: default)
2020/04/28 11:00:15 wazuh-modulesd:aws-s3: INFO: Fetching logs finished.

If there is an issue, for example if the credentials file is not found, you will get logs like these:

2020/04/28 10:45:13 wazuh-modulesd:aws-s3: INFO: Module AWS started
2020/04/28 10:45:13 wazuh-modulesd:aws-s3: INFO: Starting fetching of logs.
2020/04/28 10:45:13 wazuh-modulesd:aws-s3: INFO: Executing Bucket Analysis: (Bucket: wazuh-aws-wodle, Path: macie, Type: custom, Profile: default)
2020/04/28 10:45:14 wazuh-modulesd:aws-s3: WARNING: Bucket:  -  Returned exit code 12
2020/04/28 10:45:14 wazuh-modulesd:aws-s3: WARNING: Bucket:  -  The config profile (default) could not be found
2020/04/28 10:45:14 wazuh-modulesd:aws-s3: INFO: Fetching logs finished.

In this case you should make sure that the credentials are located in the path mentioned above, as well as that the format is correct. Keep in mind that errors are usually quite descriptive, allowing you to find the source of most problems.

If you need a higher level of verbosity, you can modify the file <WAZUH_HOME>/etc/local_internal_options.conf and add wazuh_modules.debug=2. After that, restart Wazuh again and check the ossec.log file.

Viewing AWS alerts in Kibana

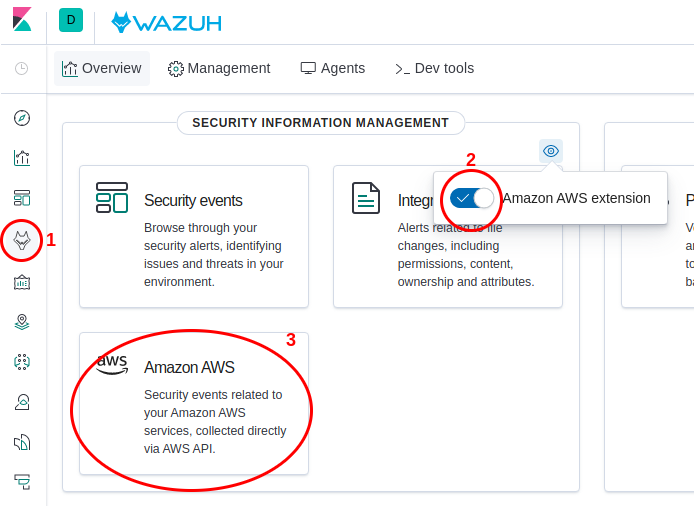
After you have successfully configured Wazuh to display Amazon Macie alerts, it’s time to open Wazuh UI in Kibana to view them. It is recommended to activate the Amazon AWS extension as seen in the image below. Thereby, you will have direct access to a summary of all your AWS activity. Enabling AWS Extension in Wazuh APP

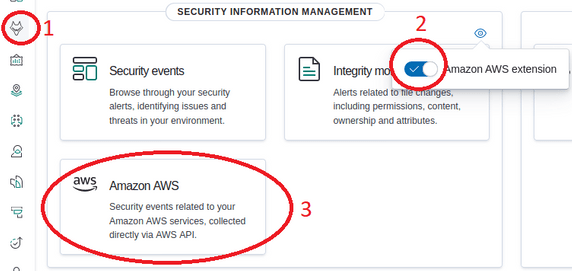
When accessing the panel of the Amazon AWS extension, we will find something similar to what is seen in the following image. At a glance, we will find graphs showing the sources of all alerts, the accounts to which they belong, the name of each bucket in which the logs are being stored and also graphs of events per second based on different criteria, among others things.
AWS dashboard in Wazuh App

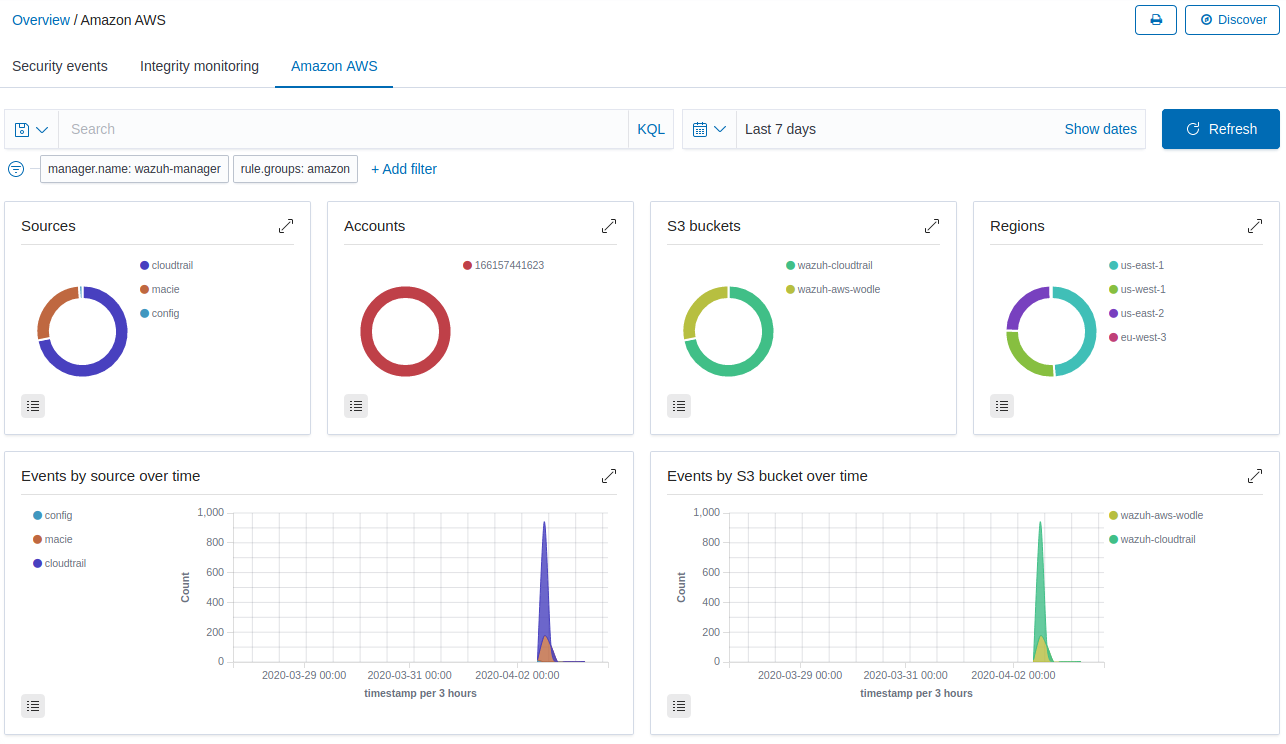
If we click on the section of the graph that corresponds to Macie, a filter will be added showing only those alerts whose source is Amazon Macie. After scrolling, we find a panel with alerts classified based on their occurrence. We can also access detailed information of each alert. To do it, just click on the button Discover in the upper right corner.

Use case: Denied role creation

There are many suspicious activities that Amazon Macie manages to identify and classify thanks to the use of machine learning, so these use cases are only a small set of interesting examples.

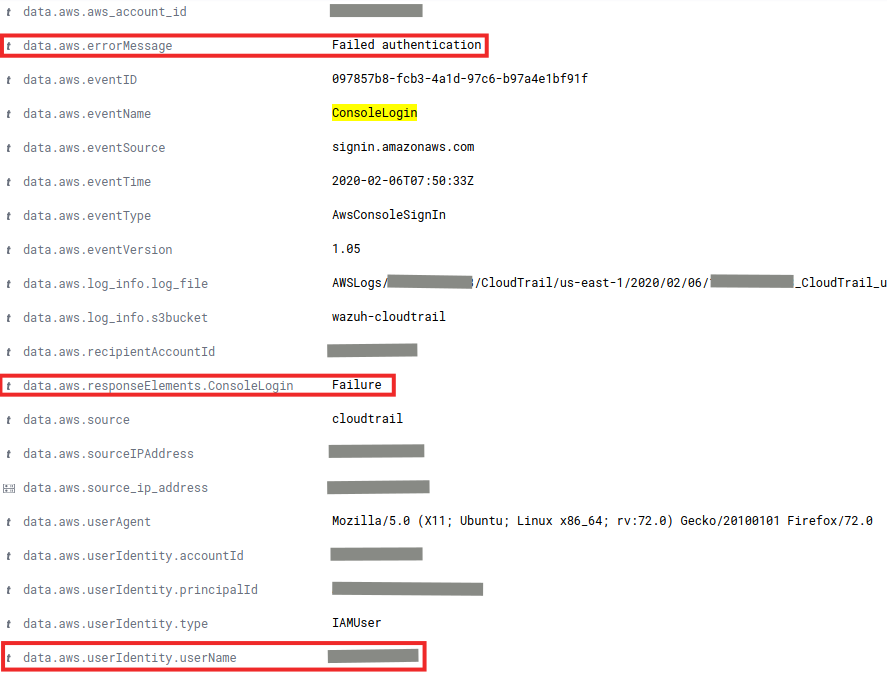
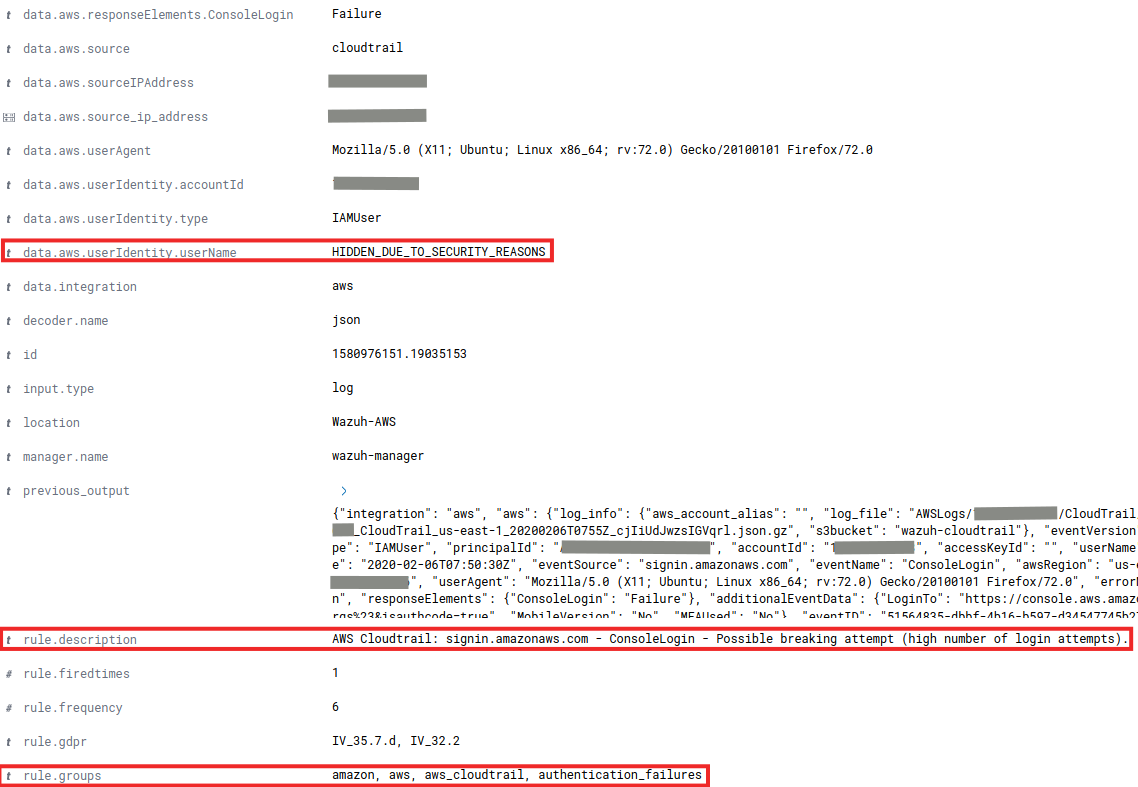
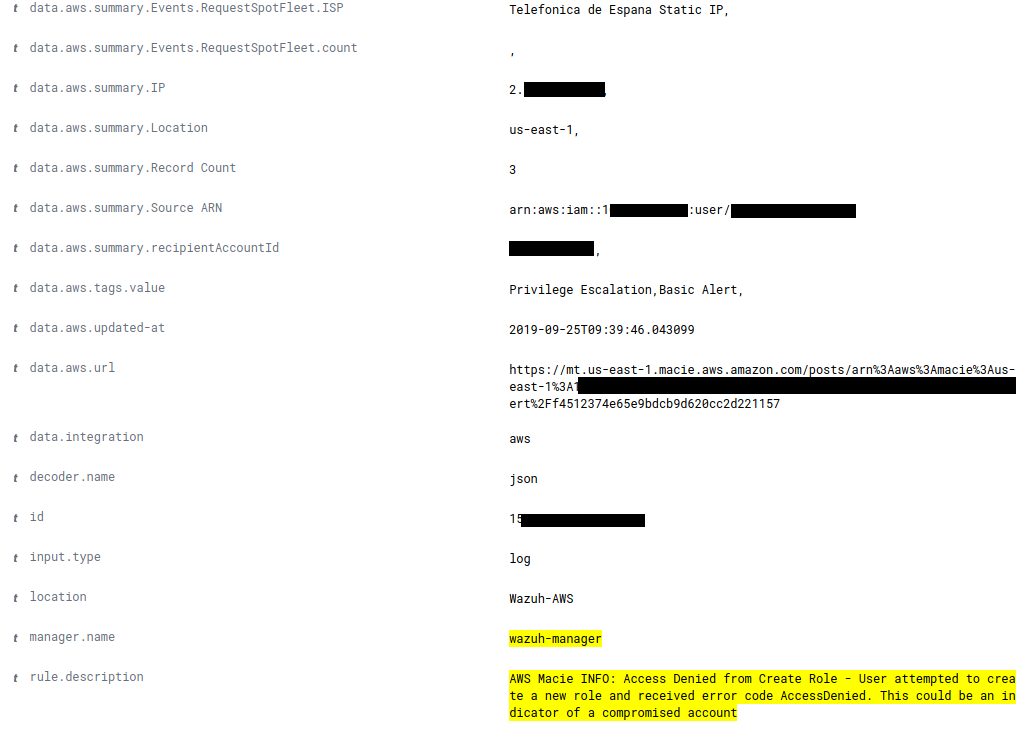
It is recommended to review all generated events (which is easier with the integration in Wazuh) to identify suspicious behavior such as the following, in which the creation of a new role has been denied. Modifying and creating roles is critically important as they define what actions a user can take. A new role could compromise the security of the data hosted on S3.
Event generated after trying to create a roleEvent generated after trying to create a role

Use case: Increased number of accesses to S3

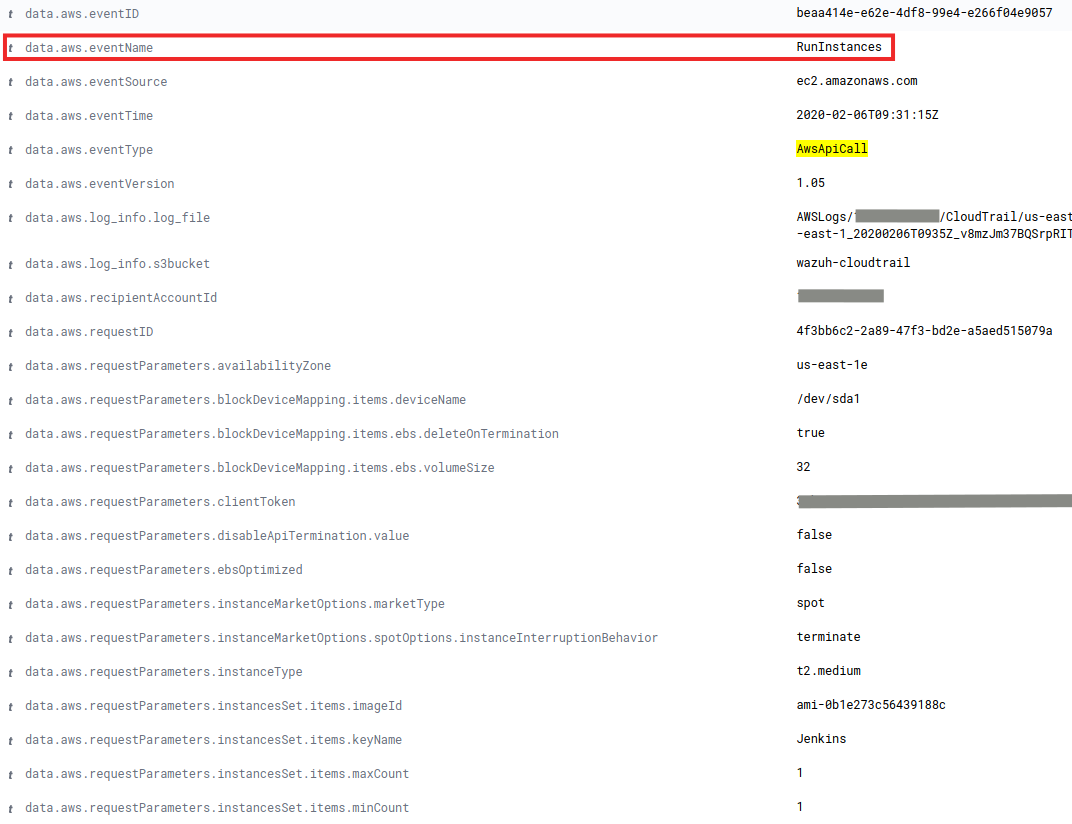
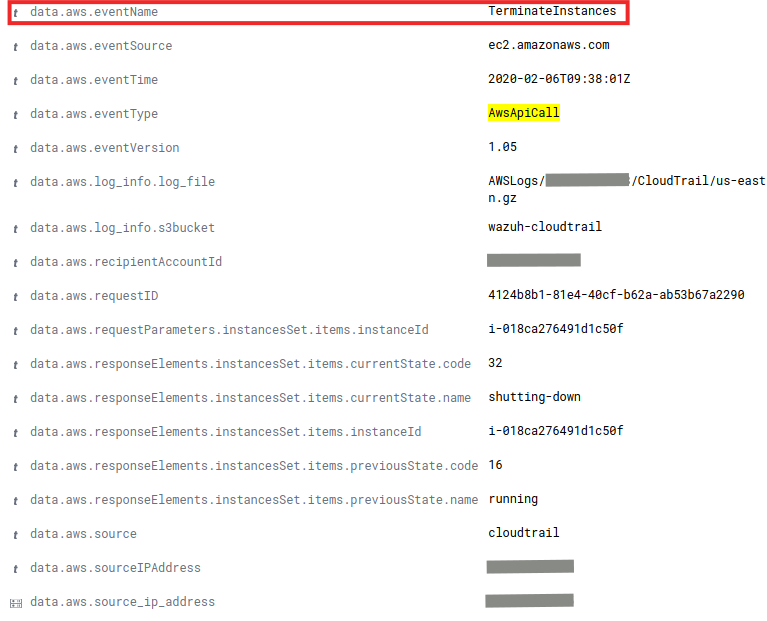
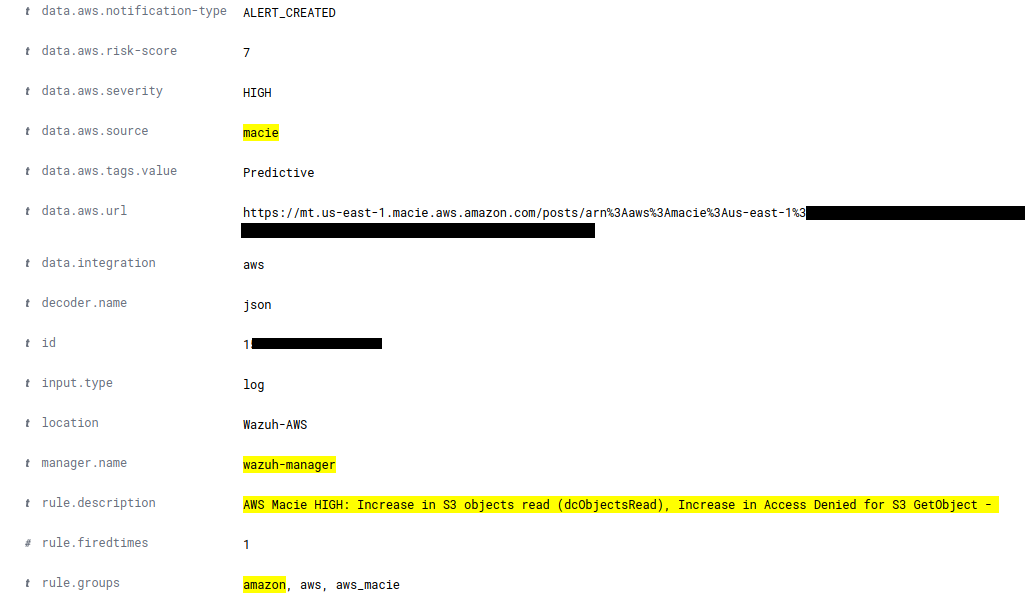
Macie also generates events when the pattern of access to buckets changes. These events are really useful since they could help us to identify early exposure of the stored data. And of course, to solve it in time.

It happens for example when a user who does not usually download anything, begins to download many files from the bucket, and also when the number of times that a bucket is read increases. This is the case of the following event:
Event generated in Macie after bucket has higher read requests

Conclusion

Having secure systems in which to store the information we generate is incredibly important nowadays. The leakage of personal or any other data can result not only in the loss of credibility of a company but also in significant financial penalties. Therefore, all efforts are justified when it comes to monitoring the correct processing of data.

We have seen that integrating Amazon Macie into Wazuh is really easy. After doing so, this and many other services will be centralized in one place, the Wazuh UI. Unified access to all the information gives us many advantages, such as a fast overview of everything that is happening (especially critical information), greater agility to find security risks, personalization of alerts and even automation of actions which may save us from a future headache.

References

If you have any questions about this, don’t hesitate to check out our documentation to learn more about Wazuh. You can also join our Slack #community channel and our mailing list where our team and other users will help you with your questions.

The post Integrating Amazon Macie in Wazuh appeared first on Wazuh.

Integrating AWS CloudTrail in Wazuh

This post focuses on setting up Wazuh to collect events delivered by AWS CloudTrail which provides useful information about the AWS infrastructure, such as the instance configuration, unauthorized behavior, API usage and more.

What is AWS CloudTrail

AWS CloudTrail is a service that enables governance, compliance, operational and risk auditing of your AWS infrastructure. It provides event history of your AWS account activity, including actions taken through the AWS Management Console, AWS SDKs, command-line tools, and other AWS services.

How it works

CloudTrail typically delivers log files within 15 minutes of account activity by using trails. A trail is a configuration that enables the delivery of events to a specified Amazon S3 bucket to record changes in AWS resources. Log file objects are stored by trails in the S3 bucket in the following name format:

bucket_name/prefix_name/AWSLogs/Account ID/CloudTrail/region/YYYY/MM/DD/file_name.json.gz

This name format includes the following elements:

  • The bucket name specified when creating the trail.
  • The prefix specified when creating the trail. This is optional.
  • The string AWSLogs.
  • The account ID.
  • The string CloudTrail.
  • A region identifier such as us-west-1.
  • The year the log file was published in YYYY format.
  • The month the log file was published in MM format.
  • The day the log file was published in DD format.
  • A random alphanumeric string to differentiate files from the same time period.

More information about CloudTrail concepts can be found here.

Setting it up

The following diagram shows what we plan to accomplish:

Monitor AWS activity with AWS Cloudtrail and Wazuh

Note: If you already have a Trail set up for saving CloudTrail logs you can skip Step 1.

Step 1: Enable AWS CloudTrail

To enable CloudTrail we need to define a bucket for saving the logs. To do so, log in to the AWS Management Console and look for “CloudTrail” using the  “Find Services” search option. Click on “Trails” on the left panel, and then click on “Create trail” button, as shown in the following screenshot:

Monitor AWS activity. Click on create trails

Lastly, provide the name for the new S3 bucket that will be created and used to store CloudTrail logs:


Setup CloudTrail S3 bucket for logs

Step 2: Create AWS credentials

Once we have created a trail, we need to set up credentials so that Wazuh is able to connect and extract the logs from the S3 bucket. We recommend doing this instead of hardcoding the user and password for the AWS account in the ossec.conf. More information about how to configure AWS credentials can be found in the Wazuh documentation.

For testing purposes, we are going to create a file located at ~/.aws/credentials with the following content to grant us access to the previously created S3 Bucket:

[default]
aws_access_key_id=<YOUR_AWS_ACCESS_KEY>
aws_secret_access_key=<YOUR_AWS_SECRET_KEY>

This way we will be able to connect to our AWS account if we specify default as our AWS profile in the next step.

Step 3: Configure Wazuh

The only thing left to do is to indicate in our <WAZUH_HOME>/etc/ossec.conf file that we want to collect logs from CloudTrail by adding the following module. This step is performed on the Wazuh Manager or Agent. For this example we are going to configure it on a Wazuh Manager:

<wodle name="aws-s3">
  <disabled>no</disabled>
  <interval>10m</interval>
  <run_on_start>yes</run_on_start>
  <skip_on_error>yes</skip_on_error>
  <bucket type="cloudtrail">
    <name>wazuh-cloudtrail</name>
    <aws_profile>default</aws_profile>
  </bucket>
</wodle>

From this module two options stand out:

  • name: The name of the bucket where CloudTrail is saving the logs, previously defined. In our case, we named it “wazuh-cloudtrail”.
  • aws_profile: The name of the profile defined for granting Wazuh access to the bucket. This allows us to log in with our AWS account. It must match with the profile specified in the credentials file created in step 2.

Note: To monitor logs for multiple AWS accounts, you must configure multiple options within the aws-s3 module. Bucket tags must have a type attribute which depends on the service being monitored. More information here.

Finally, restart Wazuh to apply the changes, and the CloudTrail alerts will start to appear on the Wazuh UI.

Other useful options for AWS-S3 module

The AWS-S3 module has several options available aside from the ones shown in the previous example. Here are some configuration options that can be useful when the S3 bucket contains a long history of logs. They will filter which logs will be read by Wazuh:

  • only_logs_after: Allows filtering of logs produced after a given date. The date format must be YYYY-MMM-DD. For example, 2020-JUN-01 would filter logs produced after the 1st of June 2020, not including that day. It requires the directory structure to be organized by dates.
  • aws_account_id: If you have logs from multiple accounts, you can filter which ones will be read by Wazuh. You can specify multiple IDs by separating them with commas.
  • regions: If you have logs from multiple regions, you can filter which ones will be read by Wazuh. You can specify multiple regions separating them with commas.
  • path: If you have your logs stored in a given path, it can be specified using this option. This must match with the prefix_name of the log object files to be read.

Usage examples of those available options can be found in our official documentation.

Note: The AWS-S3 Wazuh module only looks for new logs based upon the key for the last processed log object which includes the date timestamp. If older logs are loaded into the S3 bucket or the only_logs_after option date is set to a date/time earlier than previous executions of the module, the older log files will be ignored and not ingested into Wazuh.

Step 4: Ensure everything is running fine

After restarting you can ensure everything is fine by checking the <WAZUH_HOME>/logs/ossec.log. If the following message appears in the log and there are no warnings related to AWS then everything is ready:

INFO: Module AWS started
INFO: Starting fetching of logs.
INFO: Executing Bucket Analysis: (Bucket: wazuh-cloudtrail, Type: cloudtrail, Profile: default)

You can also verify the integration is working as expected by accessing the Wazuh App. The AWS CloudTrail dashboard can be found here:

AWS CloudTrail dashboard Kibana

Troubleshooting

This section covers possible errors that may occur if we have made any mistakes during the configuration process. Those errors will be found in the <WAZUH_HOME>/logs/ossec.log.

To increase the verbosity of the messages found in ossec.log debug mode for the AWS module can be enabled by adding the line wazuh_modules.debug=2 to the <WAZUH_HOME>/etc/local_internal_options.conf file and restarting Wazuh.

The config profile could not be found

INFO: Module AWS started
INFO: Starting fetching of logs.
INFO: Executing Bucket Analysis: (Bucket: wazuh-cloudtrail, Type: cloudtrail, Profile: default)
WARNING: Bucket: - Returned exit code 12
WARNING: Bucket: - The config profile (default) could not be found
INFO: Fetching logs finished.

If the AWS credentials cannot be found you will receive this error. Make sure the AWS credentials have been correctly set up as indicated in Step 2: Configure AWS credentials.

Access error: Forbidden

INFO: Module AWS started
INFO: Starting fetching of logs.
INFO: Executing Bucket Analysis: (Bucket: wazuh-cloudtrail, Type: cloudtrail, Profile: default)
WARNING: Bucket: - Returned exit code 3
WARNING: Bucket: - Access error: An error occurred (403) when calling the HeadBucket operation: Forbidden

This error means the credentials specified during the Step 2: Configure AWS credentials are wrong and they don’t grant access to AWS. Ensure you are using the right credentials.

Access error: Not Found

INFO: Module AWS started
INFO: Starting fetching of logs.
INFO: Executing Bucket Analysis: (Bucket: wazuh-cloudnottrail, Type: cloudtrail, Profile: default)
WARNING: Bucket: - Returned exit code 3
WARNING: Bucket: - Access error: An error occurred (404) when calling the HeadBucket operation: Not Found
INFO: Fetching logs finished.

This error appear when a wrong S3 Bucket name is specified. Ensure the same bucket name defined in Step 1: Enable AWS CloudTrail is used in <WAZUH_HOME>/etc/ossec.conf when following the instructions of Step 3: Configure Wazuh.

Use case: Detecting intrusion attempts

One of the most common use cases for the CloudTrail integration with Wazuh is to monitor intrusion attempts into our cloud infrastructure. Every time a user tries to log in, an event will be generated regardless if it was successful or not.

In addition, it’s possible to configure Wazuh to send email alerts when this kind of behavior is detected, making it possible to immediately perform the necessary actions to avoid the effects of these attacks. You could also enable Amazon SNS to send SMS notifications.

As an example, the following alert will be shown in the Wazuh UI if a user tries to log in with an invalid password:

Detecting intrusion attempts. Failed login

When more than 4 authentication failures occur in a 360 second time window, an alert will be raised:

Breaking attempt alert

Use Case: Monitoring API Calls

Another useful example of what we can achieve by integrating CloudTrail with Wazuh is through monitoring any API calls. Any time an API call is performed, a log will be created by AWS and collected by Wazuh. It will be visible in the Wazuh UI and provide useful information. Some of the fields that the alert will have are:

  • Caller’s identity (user, country, ip…)
  • API call’s timestamp
  • Requested parameters and the resulting response

Here is an example of an event raised when someone tried to run a EC2 instance:

API Call Run Instances Example

And here is another example of an event when a user tries to terminate an EC2 instance:

API Call Terminate Instance Example

Conclusion

Thanks to CloudTrail and Wazuh, we can be aware of misconfigurations, attempted and/or successful malicious activities, policy violations and a variety of other security and operational issues. We can also be notified when some of those alerts are triggered.

Wazuh is ready to analyze AWS events of high relevance making it a powerful visualization tool to keep track of everything that happens in your AWS infrastructure.

References

If you have any questions about this, don’t hesitate to check out our documentation to learn more about Wazuh. You can also join our Slack #community channel and our mailing list where our team and other users will help you with your questions.

The post Integrating AWS CloudTrail in Wazuh appeared first on Wazuh.

Solving Uninitialized Stack Memory on Windows

This blog post outlines the work that Microsoft is doing to eliminate uninitialized stack memory vulnerabilities from Windows and why we’re on this path.
This blog post will be broken down into a few parts that folks can jump to:
Uninitialized Memory Background Potential Solutions to Uninitialized Memory Vulnerabilities InitAll – Automatic Initialization Interesting Findings with InitAll Performance Optimizations Impact for Customers Forward Looking Plans None of this work would have been possible without close partnership between the Visual Studio organization, the Windows organization, and MSRC.

Azure Sphere Security Research Challenge Now Open

The Azure Sphere Security Research Challenge is an expansion of Azure Security Lab, announced at Black Hat in August 2019. At that time, a select group of talented researchers was invited to come and do their worst, emulating criminal hackers in a customer-safe cloud environment.
This new research challenge aims to spark new high impact security research in Azure Sphere, a comprehensive IoT security solution delivering end to end security across hardware, OS and the cloud.