Quick Summary
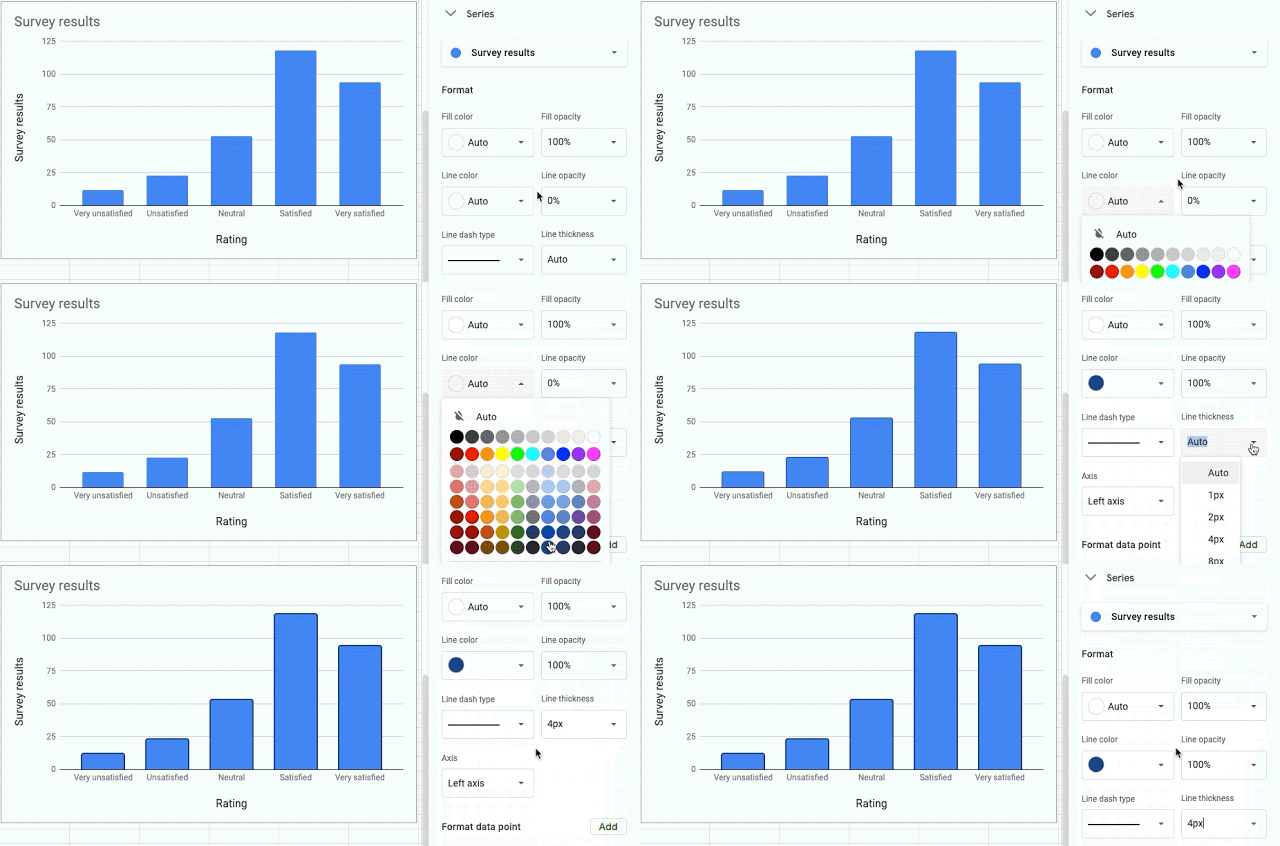
We’ve added more for line and fill customization options for series and series items. You can now modify:
- Color
- Opacity
- Line dash styles
- Line thickness
For column-shaped series, we’ve added the ability to add and style borders, a highly requested feature.
Note: these new options are not available for pie charts, however the ability to change pie slice colors and add borders is already available.
We hope these new options help you best display important data and create more impactful reports with Sheets.
Getting started
- Admins: There is no admin control for this feature.
- End users: Visit the Help Center to learn more about adding and editing a chart in Google Sheets.
Rollout pace
- Rapid and Scheduled Release domains: Extended rollout (potentially longer than 15 days for feature visibility) starting on May 7, 2021
Availability
- Available to all Google Workspace customers, as well as G Suite Basic and Business customers
Resources
![]()


