Kubernetes is an open source platform that helps in managing the automation of container applications. Kubernetes deploys and manages applications in multiple nodes that run in a cluster for scalability. It has a high degree of control over applications and services that run in its clusters. This makes the clusters targets of cyber attacks. Therefore, it is important to log and audit Kubernetes cluster events.
In this blog post, we show how to audit Kubernetes events with Wazuh. To achieve this, we take the following steps:
- Create a webhook listener on the Wazuh server to receive logs from the Kubernetes cluster.
- Enable auditing on the Kubernetes cluster and configure it to forward audit logs to the Wazuh webhook listener.
- Create rules on the Wazuh server to alert about audit events received from Kubernetes.
Requirements
- A Wazuh server 4.3.10: You can use the pre-built ready-to-use Wazuh OVA. Follow this guide to set up the virtual machine.
- A self-managed Kubernetes cluster: To test this, we deploy a local Minikube cluster on a CentOS 8 endpoint. The bash script
minikubesetup.shbelow installs Minikube and all necessary dependencies on the endpoint.
#!/bin/bash

# Disable SELinux
setenforce 0
sed -i --follow-symlinks 's/SELINUX=enforcing/SELINUX=disabled/g' /etc/sysconfig/selinux

# Install Docker
yum install yum-utils -y
yum-config-manager --add-repo https://download.docker.com/linux/centos/docker-ce.repo
yum install docker-ce docker-ce-cli containerd.io docker-compose-plugin -y --allowerasing
systemctl start docker
systemctl enable docker

# Install conntrack
yum install conntrack -y

# Install Kubectl
curl -LO https://storage.googleapis.com/kubernetes-release/release/`curl -s https://storage.googleapis.com/kubernetes-release/release/stable.txt`/bin/linux/amd64/kubectl
chmod +x kubectl
mv kubectl /usr/bin/

# Install Minikube
curl -Lo minikube https://storage.googleapis.com/minikube/releases/latest/minikube-linux-amd64
chmod +x minikube
mv minikube /usr/bin/

# Install crictl
VERSION="v1.25.0"
wget https://github.com/kubernetes-sigs/cri-tools/releases/download/$VERSION/crictl-$VERSION-linux-amd64.tar.gz
tar zxvf crictl-$VERSION-linux-amd64.tar.gz -C /usr/bin/
rm -f crictl-$VERSION-linux-amd64.tar.gz

# Install cricd
wget https://github.com/Mirantis/cri-dockerd/releases/download/v0.2.6/cri-dockerd-0.2.6-3.el8.x86_64.rpm
rpm -i cri-dockerd-0.2.6-3.el8.x86_64.rpm
rm cri-dockerd-0.2.6-3.el8.x86_64.rpm

# Start Minikube
minikube start --driver=none
Create a file minikubesetup.sh and paste the script above into it. Execute the script with root privileges to set up Minikube:
# bash minikubesetup.sh
Configure the Wazuh server
We create a webhook listener on the Wazuh server to receive the Kubernetes audit logs. To do this, we first create certificates for encrypted communication between the Wazuh server and the Kubernetes cluster. We then create the webhook listener that listens on port 8080 and forwards the logs received to the Wazuh server for analysis. Additionally, we create a systemd service to run the webhook listener, and enable the service to run on system reboot.
Create certificates for communication between the Wazuh server and Kubernetes
1. Create the directory to contain the certificates:
# mkdir /var/ossec/integrations/kubernetes-webhook/
2. Create a certificate configuration file /var/ossec/integrations/kubernetes-webhook/csr.conf and add the following. Replace <wazuh_server_ip> with your Wazuh server IP address:
[ req ]
prompt = no
default_bits = 2048
default_md = sha256
distinguished_name = req_distinguished_name
x509_extensions = v3_req
[req_distinguished_name]
C = US
ST = California
L = San Jose
O = Wazuh
OU = Research and development
emailAddress = [email protected]
CN = <wazuh_server_ip>
[ v3_req ]
authorityKeyIdentifier=keyid,issuer
basicConstraints = CA:FALSE
keyUsage = digitalSignature, nonRepudiation, keyEncipherment, dataEncipherment
subjectAltName = @alt_names
[alt_names]
IP.1 = <wazuh_server_ip>
3. Create the root CA public and private keys:
# openssl req -x509 -new -nodes -newkey rsa:2048 -keyout /var/ossec/integrations/kubernetes-webhook/rootCA.key -out /var/ossec/integrations/kubernetes-webhook/rootCA.pem -batch -subj "/C=US/ST=California/L=San Jose/O=Wazuh"
4. Create the certificate signing request (csr) and the server private key:
# openssl req -new -nodes -newkey rsa:2048 -keyout /var/ossec/integrations/kubernetes-webhook/server.key -out /var/ossec/integrations/kubernetes-webhook/server.csr -config /var/ossec/integrations/kubernetes-webhook/csr.conf
5. Generate the server certificate:
# openssl x509 -req -in /var/ossec/integrations/kubernetes-webhook/server.csr -CA /var/ossec/integrations/kubernetes-webhook/rootCA.pem -CAkey /var/ossec/integrations/kubernetes-webhook/rootCA.key -CAcreateserial -out /var/ossec/integrations/kubernetes-webhook/server.crt -extfile /var/ossec/integrations/kubernetes-webhook/csr.conf -extensions v3_req
Create the webhook listener
1. Install the Python flask module with pip. This module is used to create the webhook listener and to receive JSON POST requests:
# /var/ossec/framework/python/bin/pip3 install flask
2. Create the Python webhook listener /var/ossec/integrations/custom-webhook.py. Replace <wazuh_server_ip> with your Wazuh server IP address:
#!/var/ossec/framework/python/bin/python3

import json
from socket import socket, AF_UNIX, SOCK_DGRAM
from flask import Flask, request

# CONFIG
PORT     = 8080
CERT     = '/var/ossec/integrations/kubernetes-webhook/server.crt'
CERT_KEY = '/var/ossec/integrations/kubernetes-webhook/server.key'

# Analysisd socket address
socket_addr = '/var/ossec/queue/sockets/queue'

def send_event(msg):
    string = '1:k8s:{0}'.format(json.dumps(msg))
    sock = socket(AF_UNIX, SOCK_DGRAM)
    sock.connect(socket_addr)
    sock.send(string.encode())
    sock.close()
    return True

app = Flask(__name__)
context = (CERT, CERT_KEY)

@app.route('/', methods=['POST'])
def webhook():
    if request.method == 'POST':
        if send_event(request.json):
            print("Request sent to Wazuh")
        else:
            print("Failed to send request to Wazuh")
    return "Webhook received!"

if __name__ == '__main__':
    app.run(host='<wazuh_server_ip>', port=PORT, ssl_context=context)
3. Create a systemd service at /lib/systemd/system/wazuh-webhook.service:
[Unit]
Description=Wazuh webhook
Wants=network-online.target
After=network.target network-online.target

[Service]
ExecStart=/var/ossec/framework/python/bin/python3 /var/ossec/integrations/custom-webhook.py
Restart=on-failure

[Install]
WantedBy=multi-user.target
4. Reload systemd, enable and start the webhook service:
# systemctl daemon-reload
# systemctl enable wazuh-webhook.service
# systemctl start wazuh-webhook.service
5. Check the status of the webhook service to verify that it is running:
# systemctl status wazuh-webhook.service
6. Enable access to port 8080 if the firewall on the Wazuh server is running.
# firewall-cmd --permanent --add-port=8080/tcp
# firewall-cmd --reload
Configure Kubernetes audit logging on the master node
To configure Kubernetes audit logging, we create an audit policy file to define events that the cluster will log. The policy also defines the amount of information that should be logged for each type of event. We proceed to create a webhook configuration file that specifies the webhook address where the audit events will be sent to. Finally, we apply the newly created audit policy and the webhook configuration to the cluster by modifying the Kubernetes API server configuration file.
The Kubernetes API server runs the Kubernetes API, which serves as the front end through which users interact with the Kubernetes cluster. We log all user requests to the Kubernetes API by adding the audit policy and webhook configuration to the API server.
1. Create a policy file /etc/kubernetes/audit-policy.yaml to log the events:
apiVersion: audit.k8s.io/v1
kind: Policy
rules:
    # Don’t log requests to the following API endpoints
    - level: None
      nonResourceURLs:
          - '/healthz*'
          - '/logs'
          - '/metrics'
          - '/swagger*'
          - '/version'

    # Limit requests containing tokens to Metadata level so the token is not included in the log
    - level: Metadata
      omitStages:
          - RequestReceived
      resources:
          - group: authentication.k8s.io
            resources:
                - tokenreviews

    # Extended audit of auth delegation
    - level: RequestResponse
      omitStages:
          - RequestReceived
      resources:
          - group: authorization.k8s.io
            resources:
                - subjectaccessreviews

    # Log changes to pods at RequestResponse level
    - level: RequestResponse
      omitStages:
          - RequestReceived
      resources:
          # core API group; add third-party API services and your API services if needed
          - group: ''
            resources: ['pods']
            verbs: ['create', 'patch', 'update', 'delete']

    # Log everything else at Metadata level
    - level: Metadata
      omitStages:
          - RequestReceived
2. Create a webhook configuration file /etc/kubernetes/audit-webhook.yaml. Replace <wazuh_server_ip> with the IP address of your Wazuh server:
apiVersion: v1
kind: Config
preferences: {}
clusters:
  - name: wazuh-webhook
    cluster:
      insecure-skip-tls-verify: true
      server: https://<wazuh_server_ip>:8080

# kubeconfig files require a context. Provide one for the API server.
current-context: webhook
contexts:
- context:
    cluster: wazuh-webhook
    user: kube-apiserver # Replace with name of API server if it’s different
  name: webhook
3. Edit the Kubernetes API server configuration file /etc/kubernetes/manifests/kube-apiserver.yaml and add the highlighted lines under the relevant sections :
...
spec:
  containers:
  - command:
    - kube-apiserver
    - --audit-policy-file=/etc/kubernetes/audit-policy.yaml
    - --audit-webhook-config-file=/etc/kubernetes/audit-webhook.yaml
    - --audit-webhook-batch-max-size=1

...

    volumeMounts:
    - mountPath: /etc/kubernetes/audit-policy.yaml
      name: audit
      readOnly: true
    - mountPath: /etc/kubernetes/audit-webhook.yaml
      name: audit-webhook
      readOnly: true

...

  volumes:
  - hostPath:
      path: /etc/kubernetes/audit-policy.yaml
      type: File
    name: audit
  - hostPath:
      path: /etc/kubernetes/audit-webhook.yaml
      type: File
    name: audit-webhook
4. Restart Kubelet to apply the changes:
# systemctl restart kubelet
Create detection rules on the Wazuh server
We create a base rule 110002 that matches all Kubernetes audit events received via the webhook listener. Rule 110003 alerts Kubernetes “create” events, while rule 110004 alerts Kubernetes “delete” events.
1. Add the following rules to the Wazuh server at /var/ossec/etc/rules/local_rules.xml:
<group name="k8s_audit,">
  <rule id="110002" level="0">
    <location>k8s</location>
    <field name="apiVersion">audit</field>
    <description>Kubernetes audit log.</description>
  </rule>

  <rule id="110003" level="5">
    <if_sid>110002</if_sid>
    <regex type="pcre2">requestURI":.+", "verb": "create</regex>
    <description>Kubernetes request to create resource</description>
  </rule>

  <rule id="110004" level="5">
    <if_sid>110002</if_sid>
    <regex type="pcre2">requestURI":.+", "verb": "delete</regex>
    <description>Kubernetes request to delete resource</description>
  </rule>
</group>
2. Restart the Wazuh manager to apply the rules:
# systemctl restart wazuh-manager
Test the configuration
Test the rules by creating and deleting a deployment on the Kubernetes cluster.
1. Run the following command on the Kubernetes master node to create a new deployment:
# kubectl create deployment hello-minikube --image=k8s.gcr.io/echoserver:1.4
2. Run the following command to delete the deployment:
# kubectl delete deployment hello-minikube
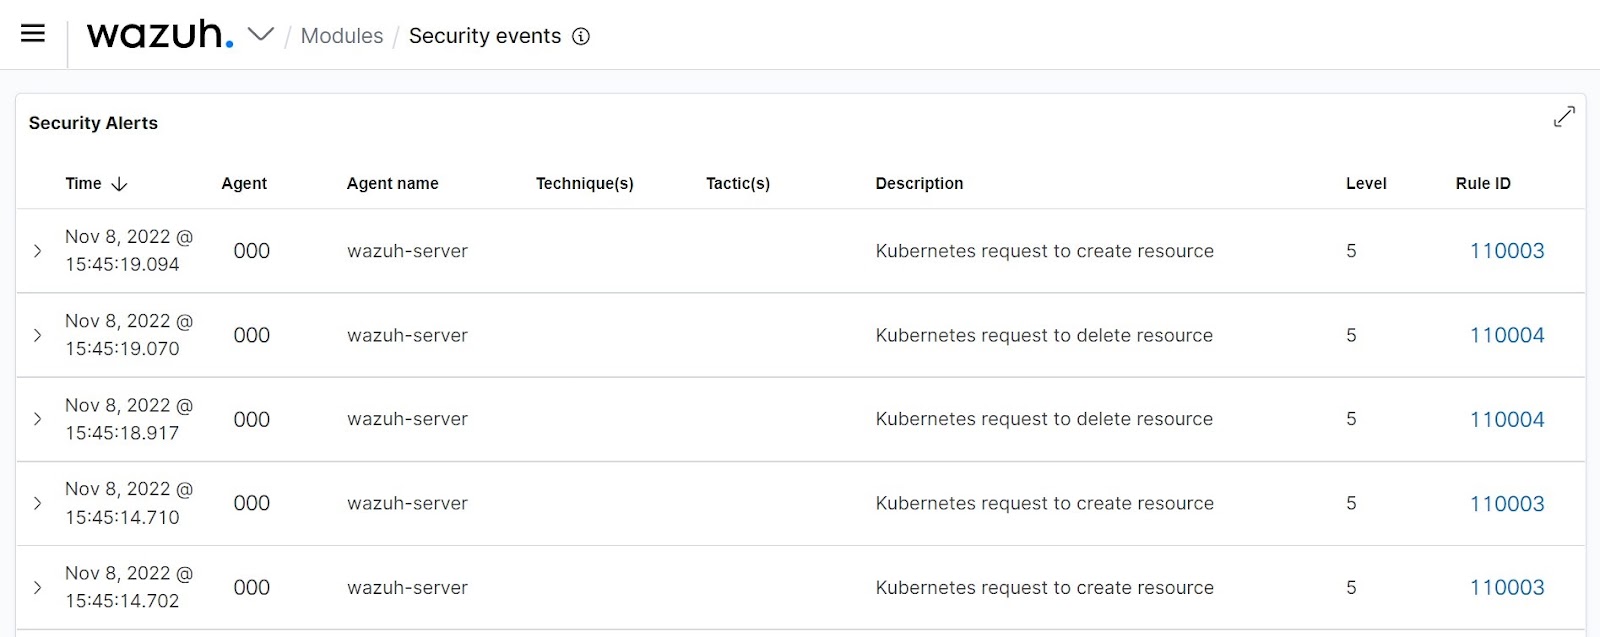
You get alerts similar to the following on the Wazuh dashboard when resources are created or deleted in the monitored Kubernetes cluster.

One of the logs is shown below:
{
  "kind": "EventList",
  "apiVersion": "audit.k8s.io/v1",
  "metadata": {},
  "items": [
    {
      "level": "Metadata",
      "auditID": "6ae321a6-0735-41a6-a9d9-050f9a75644c",
      "stage": "ResponseComplete",
      "requestURI": "/apis/apps/v1/namespaces/default/deployments?fieldManager=kubectl-create&fieldValidation=Strict",
      "verb": "create",
      "user": {
        "username": "minikube-user",
        "groups": [
          "system:masters",
          "system:authenticated"
        ]
      },
      "sourceIPs": [
        "192.168.132.137"
      ],
      "userAgent": "kubectl/v1.25.3 (linux/amd64) kubernetes/434bfd8",
      "objectRef": {
        "resource": "deployments",
        "namespace": "default",
        "name": "hello-minikube",
        "apiGroup": "apps",
        "apiVersion": "v1"
      },
      "responseStatus": {
        "metadata": {},
        "code": 201
      },
      "requestReceivedTimestamp": "2022-11-08T15:45:13.929428Z",
      "stageTimestamp": "2022-11-08T15:45:13.946284Z",
      "annotations": {
        "authorization.k8s.io/decision": "allow",
        "authorization.k8s.io/reason": ""
      }
    }
  ]
}
Additional rules can be added to alert Kubernetes “update” and “patch” events. Please note that alerting these events will generate huge volumes of alerts. Alternatively, if you wish to log all Kubernetes events without alerting them, you can save all the logs to the archive.
Save all Kubernetes logs to the Wazuh archive
Please be aware that using the Wazuh archive to save all incoming logs consumes a significant amount of storage space depending on the number of events received per second.
1. To save all logs to the archive, edit the Wazuh server configuration file /var/ossec/etc/ossec.conf and set the value of logall_json to yes. An example is shown below:
<ossec_config>
  <global>
    <jsonout_output>yes</jsonout_output>
    <alerts_log>yes</alerts_log>
    <logall>no</logall>
    <logall_json>yes</logall_json>
    ...
</ossec_config>
2. Restart the Wazuh manager to apply the change:
# systemctl restart wazuh-manager
3. To display archive logs on the Wazuh dashboard, modify the Filebeat configuration file /etc/filebeat/filebeat.yml and enable archives:
...
filebeat.modules:
  - module: wazuh
    alerts:
      enabled: true
    archives:
      enabled: true
...
4. Restart filebeat to apply the change:
# systemctl restart filebeat
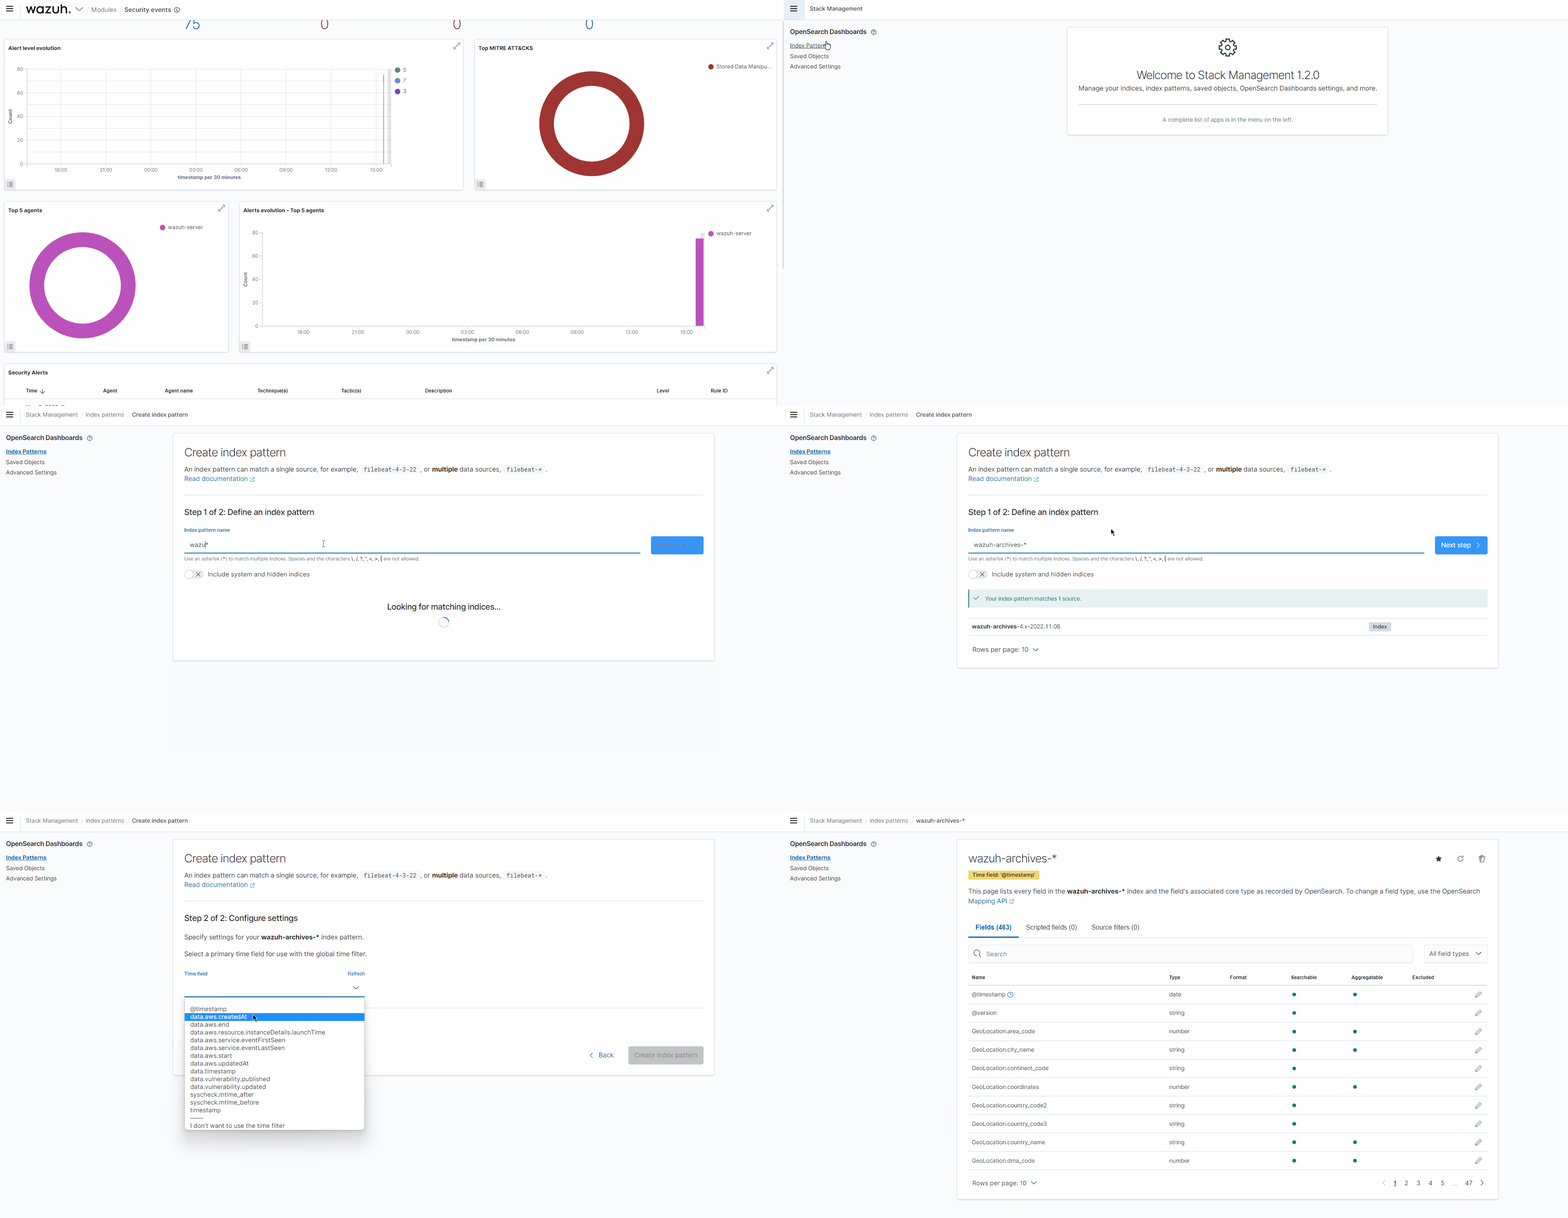
5. On the Wazuh dashboard, click the upper-left menu icon and navigate to Stack management -> Index patterns -> Create index pattern. Use wazuh-archives-* as the index pattern name, and set @timestamp in the Time field. The GIF below shows how to create the index pattern:

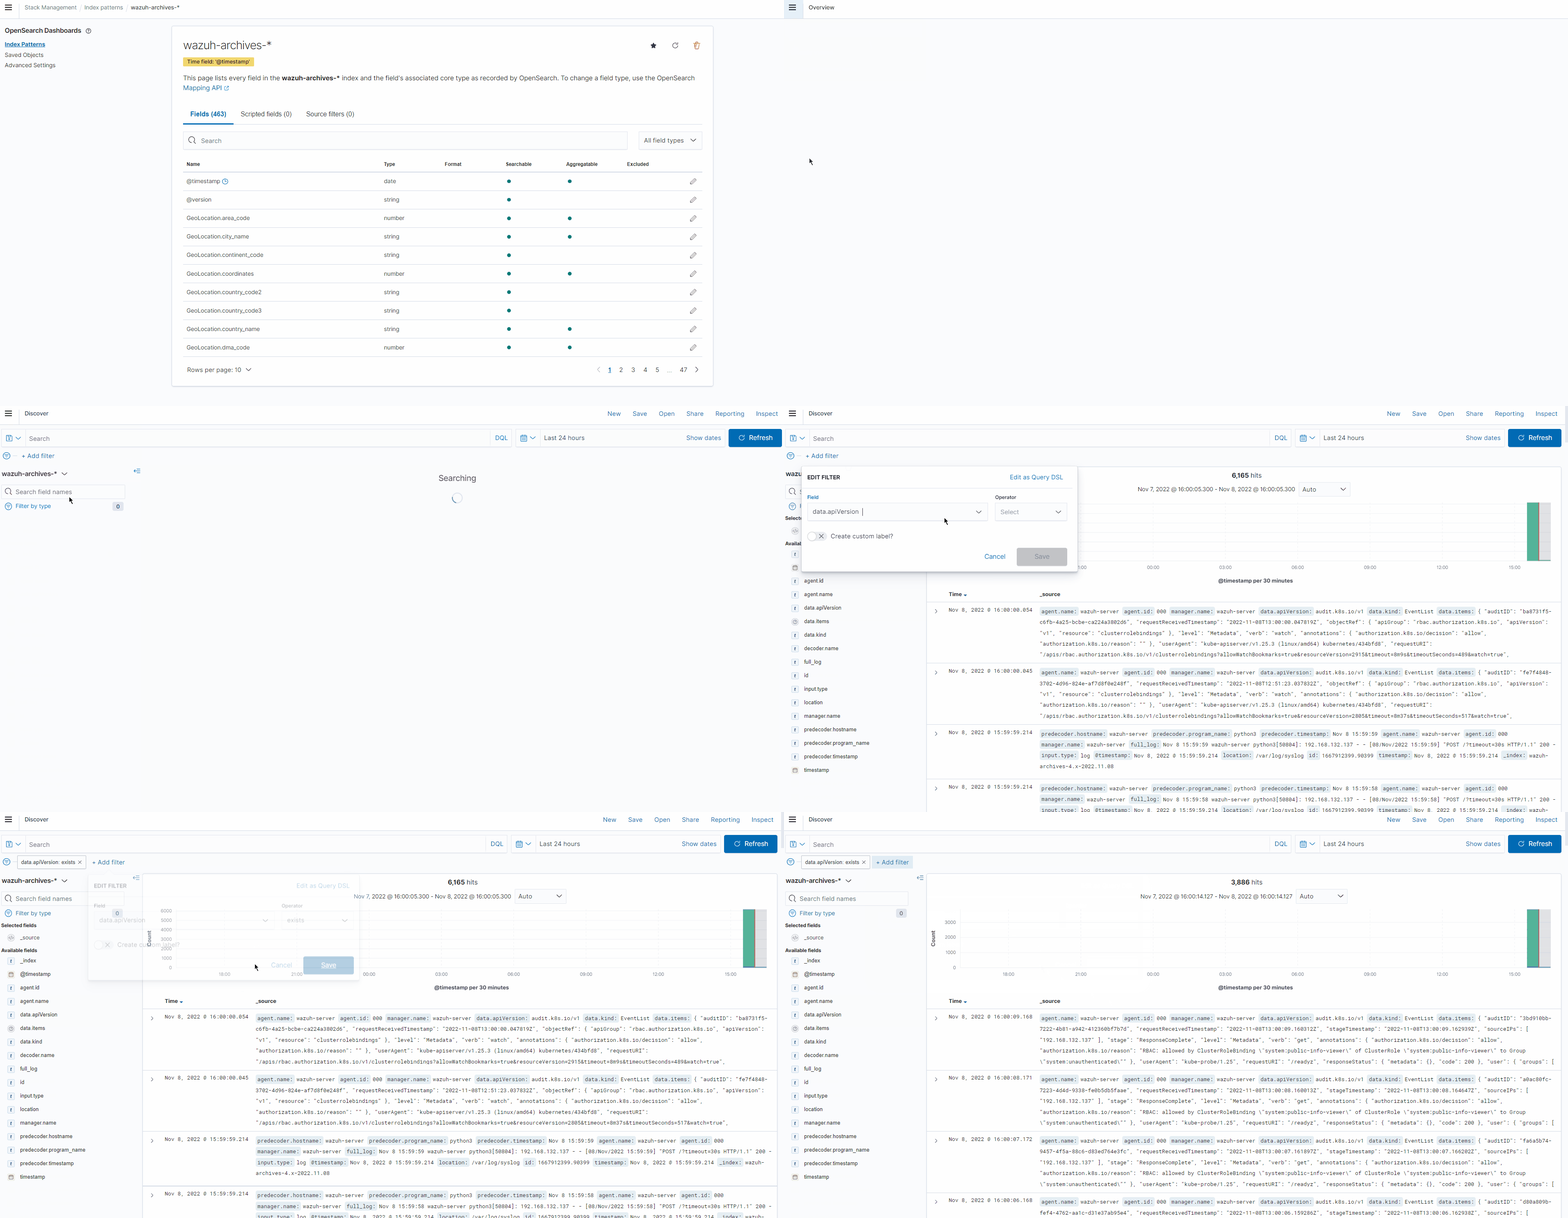
6. To view the events on the dashboard, click the upper-left menu icon and navigate to Discover. Change the index pattern to wazuh-archives-* and then add the filter data.apiVersion: exists to view all Kubernetes events. The GIF below shows how to view the archive events on the Wazuh dashboard:

References
The post Auditing Kubernetes with Wazuh appeared first on Wazuh.

