
At AWS re:Invent 2022 we announced the availability of step-by-step guides for Amazon Connect agent workspace in preview. My colleagues who collaborated to write the announcement post wrote about some of the challenges that contact centers face with training new agents to get up to speed with their agent desktop. They also mentioned that until agents become proficient, it takes them longer to address customer needs effectively, resulting in customer dissatisfaction.
Amazon Connect agent workspace was announced in 2021 and is a single, intuitive application that provides contact center agents with the tools that are required to onboard an agent quickly, resolve issues efficiently, and improve the customer experience. With Amazon Connect agent workspace, the agent is provided with all the tools on one screen. To think of the agent workspace, imagine the agent accepting a call, a chat, or a task and being given the necessary information about the customer and the case, plus real-time recommendations, all in one place without the need to switch between applications.
Step-by-step guides enable organizations to provide customizable experiences for their agents within the workspace, enabling them to deliver exceptional service from their first day on the job by surfacing relevant information and actions that the agent requires in order to resolve customer issues faster. This is because the step-by-step experience guides agents by identifying customer issues and then recommending subsequent actions, ensuring that the agent never has to guess or rely on past experience to know what comes next. This is helpful for both new and experienced agents. New agents can learn the system and get acquainted with their job and experienced agents can keep to the organization’s standard operating procedures instead of diverging in how they handle the same type of customer request.
Because of this intuitive experience, onboarding time for agents can be reduced by up to 50 percent, time to proficiency for the agent can be reduced by up to 40 percent, and contact handle time is reduced by up to 35 percent ultimately resulting in an improved and consistent customer experience.
A High-Level Overview of Step-by-Step Guides
During the announcement of step-by-step guides in preview, I was fascinated to learn that the experience was researched and developed in the context of Amazon Customer Service. However, step-by-step guides can also be generalized to apply to other types of organizations and use cases including the following:
- Retail – You can customize guides to suit your retail organization, for example, guides for returning a purchase by a customer.
- Financial Services – An example would be adding an authorized user to a credit card. Using guides, the agent can help the customer capture new user information and handle approvals through a single workflow that is consolidated within the guides.
- Hospitality – A great example here would be creating a new reservation at a hotel by consolidating all the processes involved into a single workflow.
- Embed as a Widget – With this, you can embed guides as a widget in your existing CRM or use APIs to bring guides to a custom workspace that you are already using in your organization.
The preview announcement post provides a deep dive into how to get started with step-by-step guides. It also shows how to deploy a sample guided experience and demonstrates how to customize guides to meet business needs. In this post we look at a high-level overview of what the agent, and the manager, can expect from step-by-step guides.
Agent experience
Step-by-step guides help with onboarding and ramping up of new agents and making them proficient faster by surfacing contextually relevant information and actions needed by agents. The intuitive experience of step-by-step guides provides agents with clear instructions of what they should be doing at any point in time when handling a particular customer case and supports agents in managing complex cases more accurately by automatically identifying issues.
As an example, when a customer calls, the agent workspace automatically presents the agent with the likely issue based on the customer’s history or current context (for instance, making a flight reservation). Then, the step-by-step experience guides the agent through the actions needed to resolve the issue quickly (such as booking a hotel after the flight reservation has been completed).
The following screenshot provides a visual image of how this might look.

In the UI, the agent is provided with a sequence of simple UI pages to let them focus on one thing at a time, whether that’s an input field or a question to ask the customer. They can go step by step, getting the right information that they need to help the customer’s issue. Along the way, the agent receives scripting that they can read to the customer upon successful completion of the process.
The agent can always escape out of this workflow if it turns out that the workspace surfaced the wrong one, and they can find other workflows by searching for the correct one. This allows them to self-serve and find the right solution in case what was predicted by the step-by-step guides based on the context of the contact wasn’t perfectly aligned to what they needed.
Manager experience
Amazon Connect already has a low-code, no-code builder known as Amazon Connect Flows. Flows provide a drag-and-drop experience for building IVRs, chatbots and routing logic for customers. To enable the same low-code, no-code configuration of step-by-step guides, managers are now provided with a new block within Flows known as the Show View block. The drag-and-drop experience of configuring step-by-step guides ensures that the manager no longer needs to have developers write code to build the custom workflows for the agent. Managers also no longer need to rely on static and difficult-to-follow instructions to use later to train agents.
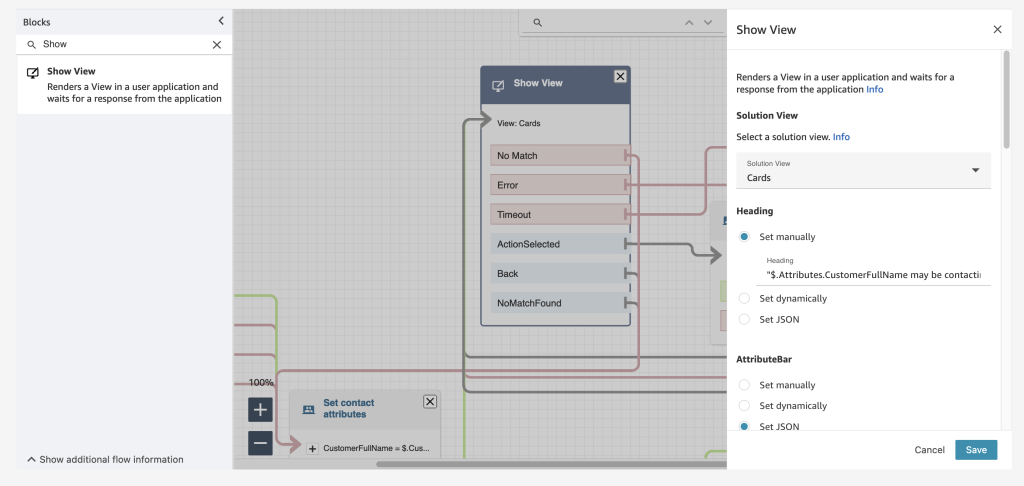
Example of the Show View block within the Contact Flow editor
Step-by-step guides are quickly created within the show view block with the help of five pre-configured views. Views are UI templates that can be used to customize the agent’s workspace, and each view is configurable. For example, you can use views to display contact attributes to an agent, provide forms for entering disposition codes, provide call notes, and present UI pages for walking agents through step-by-step guides.
The following example shows a view that we can use to create a guide for an agent that needs to book a round-trip flight for a customer. Booking this trip requires scheduling a flight to and from the destination, collecting traveler information, and asking about additional add-ons. With the form view, agents don’t have to recall all these specific steps; they can follow the wizard in their agent workspace. For each step, the agent is given form fields to fill in or options to choose from in order to quickly book the customer’s flight.

Example UI (View)
Step-by-step guides also help business operation teams figure out new ways to ensure that their agents are operating well and adjusting to new use cases. Step-by-step guides provide managers with insights into what agents do during a contact. During a workflow, data about what is shown to an agent, the decisions they made, the amount of time they spent on different steps, and what actions they took is captured and stored as a log record. Managers can use this data to improve their workflows and the agent and customer experiences.
Conclusion
In this post we discussed what step-by-step guides offer the agent and the manager of a contact center. Our customers are excited about how the guided experience consolidates actions into workflows and reduces the number of screens for their agents – at times from five screens down to one. In addition to all the benefits we’ve discussed in this post, guides provide you with opportunities to save between 15 – 20 percent on maintenance cost.
Now Available
Step-by-step guides are now generally available in all Regions where Amazon Connect is available, except AWS GovCloud (US-West) and Africa (Cape Town).
To learn more, refer to the Getting started with step-by-step guides for the Amazon Connect agent workspace post, and please send feedback to AWS re:Post for Amazon Connect or through your usual AWS support contacts.
– Veliswa x.
 This online and mobile usage drives very specific traffic patterns on IT systems: a huge peak of connections and authentications in the few minutes before the start of a game and millions of video streams that must be delivered reliably over a variety of changing network qualities. In addition to these technical challenges, there is also an economic challenge: to deliver advertisements at key moments, such as before a national anthem or during a 15-minute half-time. The digital platform sells its own set of commercials, which are different from the commercials broadcast over the air, and might also be different from region to region. All these video streams have to be delivered to millions of viewers on a wide range of devices and a variety of network conditions: from 1 Gbs fiber at home down to 3 G networks in remote areas.
 By the time France took to the pitch on Dec. 18, 2022, TF1 knew they would break records on the platform. Thierry said the traffic was higher than estimated, but the platform absorbed it. He also described that during the first part of the game, when Argentina was leading, the TF1 team observed a slow decline of connections… that is, until