Black Cat Security

Simplify Service-to-Service Connectivity, Security, and Monitoring with Amazon VPC Lattice – Now Generally Available

At AWS re:Invent 2022, we introduced in preview Amazon VPC Lattice, a new capability of Amazon Virtual Private Cloud (Amazon VPC) that gives you a consistent way to connect, secure, and monitor communication between your services. With VPC Lattice, you can define policies for network access, traffic management, and monitoring to connect compute services across instances, containers, and serverless applications.

Today, I am happy to share that VPC Lattice is now generally available. Compared to the preview, you have access to new capabilities:

  • Services can use a custom domain name in addition to the domain name automatically generated by VPC Lattice. When using HTTPS, you can configure an SSL/TLS certificate that matches the custom domain name.
  • You can deploy the open-source AWS Gateway API Controller to use VPC Lattice with a Kubernetes-native experience. It uses the Kubernetes Gateway API to let you connect services across multiple Kubernetes clusters and services running on EC2 instances, containers, and serverless functions.
  • You can use an Application Load Balancer (ALB) or a Network Load Balancer (NLB) as a target for a service.
  • The IP address target type now supports IPv6 connectivity.

Let’s see some of these new features in practice.

Using Amazon VPC Lattice for Service-to-Service Connectivity
In my previous post introducing VPC Lattice, I show how to create a service network, associate multiple VPCs and services, and configure target groups for EC2 instances and Lambda functions. There, I also show how to route traffic based on request characteristics and how to use weighted routing. Weighted routing is really handy for blue/green and canary-style deployments or for migrating from one compute platform to another.

Now, let’s see how to use VPC Lattice to allow the services of an e-commerce application to communicate with each other. For simplicity, I only consider four services:

  • The Order service, running as a Lambda function.
  • The Inventory service, deployed as an Amazon Elastic Container Service (Amazon ECS) service in a dual-stack VPC supporting IPv6.
  • The Delivery service, deployed as an ECS service using an ALB to distribute traffic to the service tasks.
  • The Payment service, running on an EC2 instance.

First, I create a service network. The Order service needs to call the Inventory service (to check if an item is available for purchase), the Delivery service (to organize the delivery of the item), and the Payment service (to transfer the funds). The following diagram shows the service-to-service communication from the perspective of the service network.

Diagram describing the service network view of the e-commerce services.

These services run in different AWS accounts and multiple VPCs. VPC Lattice handles the complexity of setting up connectivity across VPC boundaries and permission across accounts so that service-to-service communication is as simple as an HTTP/HTTPS call.

The following diagram shows how the communication flows from an implementation point of view.

Diagram describing the implementation view of the e-commerce services.

The Order service runs in a Lambda function connected to a VPC. Because all the VPCs in the diagram are associated with the service network, the Order service is able to call the other services (Inventory, Delivery, and Payment) even if they are deployed in different AWS accounts and in VPCs with overlapping IP addresses.

Using a Network Load Balancer (NLB) as Target
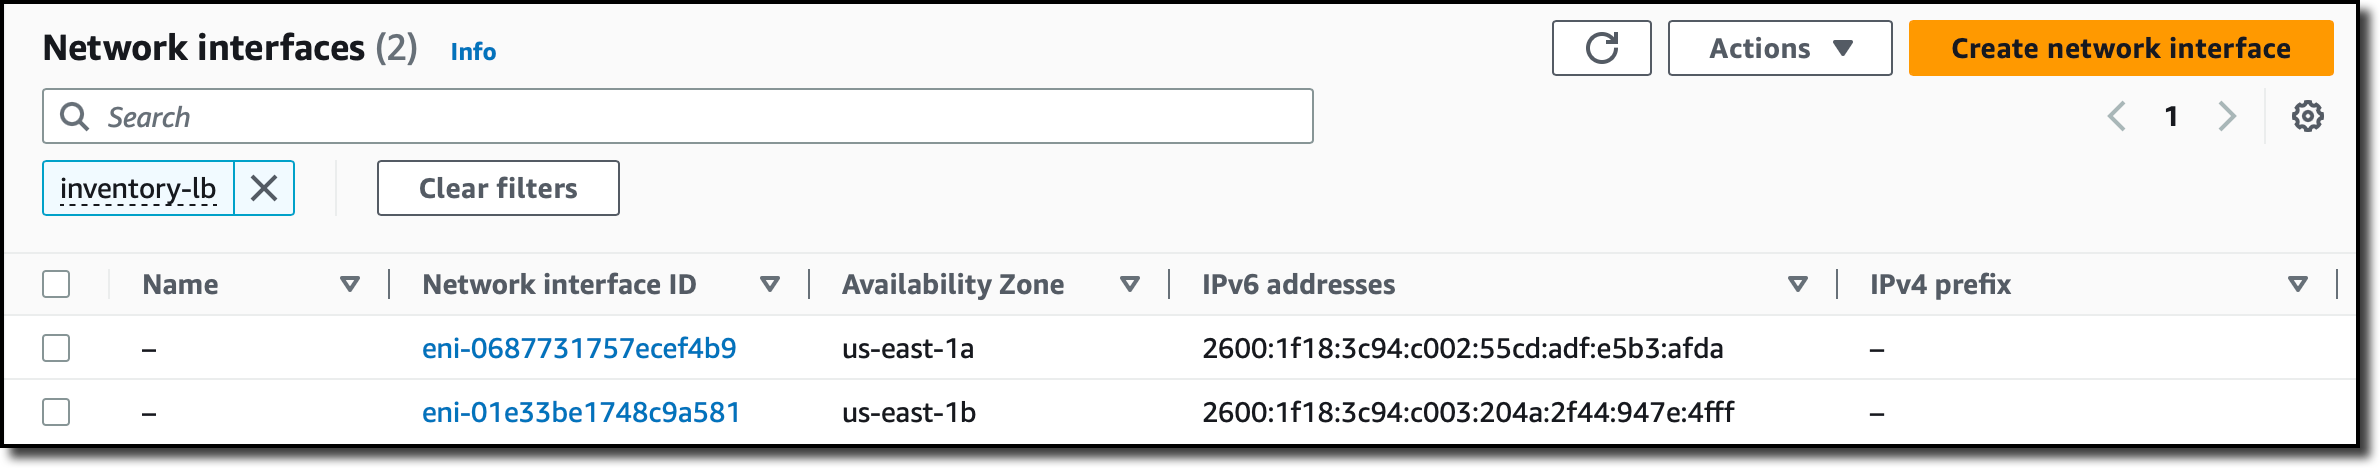
The Inventory service runs in a dual-stack VPC. It’s deployed as an ECS service with an NLB to distribute traffic to the tasks in the service. To get the IPv6 addresses of the NLB, I look for the network interfaces used by the NLB in the EC2 console.

Console screenshot.

When creating the target group for the Inventory service, under Basic configuration, I choose IP addresses as the target type. Then, I select IPv6 for the IP Address type.

Console screenshot.

In the next step, I enter the IPv6 addresses of the NLB as targets. After the target group is created, the health checks test the targets to see if they are responding as expected.

Console screenshot.

Using an Application Load Balancer (ALB) as Target
Using an ALB as a target is even easier. When creating a target group for the Delivery service, under Basic configuration, I choose the new Application Load Balancer target type.

Console screenshot.

I select the VPC in which to look for the ALB and choose the Protocol version.

Console screenshot.

In the next step, I choose Register now and select the ALB from the dropdown. I use the default port used by the target group. VPC Lattice does not provide additional health checks for ALBs. However, load balancers already have their own health checks configured.

Console screenshot.

Using Custom Domain Names for Services
To call these services, I use custom domain names. For example, when I create the Payment service in the VPC console, I choose to Specify a custom domain configuration, enter a Custom domain name, and select an SSL/TLS certificate for the HTTPS listener. The Custom SSL/TLS certificate dropdown shows available certificates from AWS Certificate Manager (ACM).

Console screenshot.

Securing Service-to-Service Communications
Now that the target groups have been created, let’s see how I can secure the way services communicate with each other. To implement zero-trust authentication and authorization, I use AWS Identity and Access Management (IAM). When creating a service, I select the AWS IAM as Auth type.

I select the Allow only authenticated access policy template so that requests to services need to be signed using Signature Version 4, the same signing protocol used by AWS APIs. In this way, requests between services are authenticated by their IAM credentials, and I don’t have to manage secrets to secure their communications.

Console screenshot.

Optionally, I can be more precise and use an auth policy that only gives access to some services or specific URL paths of a service. For example, I can apply the following auth policy to the Order service to give to the Lambda function these permissions:

  • Read-only access (GET method) to the Inventory service /stock URL path.
  • Full access (any HTTP method) to the Delivery service /delivery URL path.
{
    "Version": "2012-10-17",
    "Statement": [
        {
            "Effect": "Allow",
            "Principal": {
                "AWS": "<Order Service Lambda Function IAM Role ARN>"
            },
            "Action": "vpc-lattice-svcs:Invoke",
            "Resource": "<Inventory Service ARN>/stock",
            "Condition": {
                "StringEquals": {
                    "vpc-lattice-svcs:RequestMethod": "GET"
                }
            }
        },
        {
            "Effect": "Allow",
            "Principal": {
                "AWS": "<Order Service Lambda Function IAM Role ARN>"
            },
            "Action": "vpc-lattice-svcs:Invoke",
            "Resource": "<Delivery Service ARN>/delivery"
        }
    ]
}

Using VPC Lattice, I quickly configured the communication between the services of my e-commerce application, including security and monitoring. Now, I can focus on the business logic instead of managing how services communicate with each other.

Availability and Pricing
Amazon VPC Lattice is available today in the following AWS Regions: US East (Ohio), US East (N. Virginia), US West (Oregon), Asia Pacific (Singapore), Asia Pacific (Sydney), Asia Pacific (Tokyo), and Europe (Ireland).

With VPC Lattice, you pay for the time a service is provisioned, the amount of data transferred through each service, and the number of requests. There is no charge for the first 300,000 requests every hour, and you only pay for requests above this threshold. For more information, see VPC Lattice pricing.

We designed VPC Lattice to allow incremental opt-in over time. Each team in your organization can choose if and when to use VPC Lattice. Other applications can connect to VPC Lattice services using standard protocols such as HTTP and HTTPS. By using VPC Lattice, you can focus on your application logic and improve productivity and deployment flexibility with consistent support for instances, containers, and serverless computing.

Simplify the way you connect, secure, and monitor your services with VPC Lattice.

Danilo

Amazon GuardDuty Now Supports Amazon EKS Runtime Monitoring

Since Amazon GuardDuty launched in 2017, GuardDuty has been capable of analyzing tens of billions of events per minute across multiple AWS data sources, such as AWS CloudTrail event logs, Amazon Virtual Private Cloud (Amazon VPC) Flow Logs, and DNS query logs, Amazon Simple Storage Service (Amazon S3) data plane events, Amazon Elastic Kubernetes Service (Amazon EKS) audit logs, and Amazon Relational Database Service (Amazon RDS) login events to protect your AWS accounts and resources.

In 2020, GuardDuty added Amazon S3 protection to continuously monitor and profile S3 data access events and configurations to detect suspicious activities in Amazon S3. Last year, GuardDuty launched Amazon EKS protection to monitor control plane activity by analyzing Kubernetes audit logs from existing and new EKS clusters in your accounts, Amazon EBS malware protection to scan malicious files residing on an EC2 instance or container workload using EBS volumes, and Amazon RDS protection to identify potential threats to data stored in Amazon Aurora databases—recently generally available.

GuardDuty combines machine learning (ML), anomaly detection, network monitoring, and malicious file discovery using various AWS data sources. When threats are detected, GuardDuty automatically sends security findings to AWS Security Hub, Amazon EventBridge, and Amazon Detective. These integrations help centralize monitoring for AWS and partner services, automate responses to malware findings, and perform security investigations from GuardDuty.

Today, we are announcing the general availability of Amazon GuardDuty EKS Runtime Monitoring to detect runtime threats from over 30 security findings to protect your EKS clusters. The new EKS Runtime Monitoring uses a fully managed EKS add-on that adds visibility into individual container runtime activities, such as file access, process execution, and network connections.

GuardDuty can now identify specific containers within your EKS clusters that are potentially compromised and detect attempts to escalate privileges from an individual container to the underlying Amazon EC2 host and the broader AWS environment. GuardDuty EKS Runtime Monitoring findings provide metadata context to identify potential threats and contain them before they escalate.

Configure EKS Runtime Monitoring in GuardDuty
To get started, first enable EKS Runtime Monitoring with just a few clicks in the GuardDuty console.

Once you enable EKS Runtime Monitoring, GuardDuty can start monitoring and analyzing the runtime-activity events for all the existing and new EKS clusters for your accounts. If you want GuardDuty to deploy and update the required EKS-managed add-on for all the existing and new EKS clusters in your account, choose Manage agent automatically. This will also create a VPC endpoint through which the security agent delivers the runtime events to GuardDuty.

If you configure EKS Audit Log Monitoring and runtime monitoring together, you can achieve optimal EKS protection both at the cluster control plane level, and down to the individual pod or container operating system level. When used together, threat detection will be more contextual to allow quick prioritization and response. For example, a runtime-based detection on a pod exhibiting suspicious behavior can be augmented by an audit log-based detection, indicating the pod was unusually launched with elevated privileges.

These options are default, but they are configurable, and you can uncheck one of the boxes in order to disable EKS Runtime Monitoring. When you disable EKS Runtime Monitoring, GuardDuty immediately stops monitoring and analyzing the runtime-activity events for all the existing EKS clusters. If you had configured automated agent management through GuardDuty, this action also removes the security agent that GuardDuty had deployed.

To learn more, see Configuring EKS Runtime Monitoring in the AWS documentation.

Manage GuardDuty Agent Manually
If you want to manually deploy and update the EKS managed add-on, including the GuardDuty agent, per cluster in your account, uncheck Manage agent automatically in the EKS protection configuration.

When managing the add-on manually, you are also responsible for creating the VPC endpoint through which the security agent delivers the runtime events to GuardDuty. In the VPC endpoint console, choose Create endpoint. In the step, choose Other endpoint services for Service category, enter com.amazonaws.us-east-1.guardduty-data for Service name in the US East (N. Virginia) Region, and choose Verify service.

After the service name is successfully verified, choose VPC and subnets where your EKS cluster resides. Under Additional settings, choose Enable DNS name. Under Security groups, choose a security group that has the in-bound port 443 enabled from your VPC (or your EKS cluster).

Add the following policy to restrict VPC endpoint usage to the specified account only:

{
	"Version": "2012-10-17",
	"Statement": [
		{
			"Action": "*",
			"Resource": "*",
			"Effect": "Allow",
			"Principal": "*"
		},
		{
			"Condition": {
				"StringNotEquals": {
					"aws:PrincipalAccount": "123456789012"
				}
			},
			"Action": "*",
			"Resource": "*",
			"Effect": "Deny",
			"Principal": "*"
		}
	]
}

Now, you can install the Amazon GuardDuty EKS Runtime Monitoring add-on for your EKS clusters. Select this add-on in the Add-ons tab in your EKS cluster profile on the Amazon EKS console.

When you enable EKS Runtime Monitoring in GuardDuty and deploy the Amazon EKS add-on for your EKS cluster, you can view the new pods with the prefix aws-guardduty-agent. GuardDuty now starts to consume runtime-activity events from all EC2 hosts and containers in the cluster. GuardDuty then analyzes these events for potential threats.

These pods collect various event types and send them to the GuardDuty backend for threat detection and analysis. When managing the add-on manually, you need to go through these steps for each EKS cluster that you want to monitor, including new EKS clusters.

To learn more, see Managing GuardDuty agent manually in the AWS documentation.

Checkout EKS Runtime Security Findings
When GuardDuty detects a potential threat and generates a security finding, you can view the details of the corresponding findings. These security findings indicate either a compromised EC2 instance, container workload, an EKS cluster, or a set of compromised credentials in your AWS environment.

If you want to generate EKS Runtime Monitoring sample findings for testing purposes, see Generating sample findings in GuardDuty in the AWS documentation. Here is an example of potential security issues: a newly created or recently modified binary file in an EKS cluster has been executed.

The ResourceType for an EKS Protection finding type could be an Instance, EKSCluster, or Container. If the Resource type in the finding details is EKSCluster, it indicates that either a pod or a container inside an EKS cluster is potentially compromised. Depending on the potentially compromised resource type, the finding details may contain Kubernetes workload details, EKS cluster details, or instance details.

The Runtime details such as process details and any required context describe information about the observed process, and the runtime context describes any additional information about the potentially suspicious activity.

To remediate a compromised pod or container image, see Remediating EKS Runtime Monitoring findings in the AWS documentation. This document describes the recommended remediation steps for each resource type. To learn more about security finding types, see GuardDuty EKS Runtime Monitoring finding types in the AWS documentation.

Now Available
You can now use Amazon GuardDuty for EKS Runtime Monitoring. For a full list of Regions where EKS Runtime Monitoring is available, visit region-specific feature availability.

The first 30 days of GuardDuty for EKS Runtime Monitoring are available at no additional charge for existing GuardDuty accounts. If you enabled GuardDuty for the first time, EKS Runtime Monitoring is not enabled by default, and needs to be enabled as described above. After the trial period ends in the GuardDuty, you can see the estimated cost of EKS Runtime Monitoring. To learn more, see the GuardDuty pricing page.

For more information, see the Amazon GuardDuty User Guide and send feedback to AWS re:Post for Amazon GuardDuty or through your usual AWS support contacts.

Channy

Find files quicker with search chips in Google Drive

What’s changing

Last month, we pre-announced numerous features that offer new experiences in smart canvas, including enhancing Google Drive to help you complete your most frequent tasks more quickly. 
Today, we’re introducing search chips in Drive that enable you to filter by criteria like file type, owner, and last modified date. Filtering by these criteria helps you narrow down and find relevant files faster in any view throughout Drive. 

Getting started 

Rollout pace 

  • Rapid Release domains: Extended rollout (potentially longer than 15 days for feature visibility) starting on March 30, 2023 
  • Scheduled Release domains: Gradual rollout (up to 15 days for feature visibility) starting in Q2, 2023. (We will provide an update once the date approaches.)

Availability 

  • Available to all Google Workspace customers, as well as legacy G Suite Basic and Business customers 
  • Available to users with personal Google Accounts 

Resources

Roadmap 

HDInsight

Azure HDInsight for Apache Spark 3.3.0 is under development.